2020 Barclays Global Financial Services Conference - Huntington ...
←
→
Page content transcription
If your browser does not render page correctly, please read the page content below
2020 Barclays Global
Financial Services
Conference

September 14, 2020

The Huntington National Bank is Member FDIC.       ®, Huntington® and     Huntington. Welcome.®
are federally registered service marks of Huntington Bancshares Incorporated. ©2020 Huntington
Bancshares Incorporated.

Disclaimer

CAUTION REGARDING FORWARD‐LOOKING STATEMENTS
This communication contains certain forward‐looking statements, including, but not limited to, certain plans, expectations, goals, projections,
and statements, which are not historical facts and are subject to numerous assumptions, risks, and uncertainties. Statements that do not
describe historical or current facts, including statements about beliefs and expectations, are forward‐looking statements. Forward‐looking
statements may be identified by words such as expect, anticipate, believe, intend, estimate, plan, target, goal, or similar expressions, or future or
conditional verbs such as will, may, might, should, would, could, or similar variations. The forward‐looking statements are intended to be subject
to the safe harbor provided by Section 27A of the Securities Act of 1933, Section 21E of the Securities Exchange Act of 1934, and the Private
Securities Litigation Reform Act of 1995.

While there is no assurance that any list of risks and uncertainties or risk factors is complete, below are certain factors which could cause actual
results to differ materially from those contained or implied in the forward‐looking statements: changes in general economic, political, or industry
conditions; the magnitude and duration of the COVID‐19 pandemic and its impact on the global economy and financial market conditions and
our business, results of operations and financial condition; uncertainty in U.S. fiscal and monetary policy, including the interest rate policies of
the Federal Reserve Board; volatility and disruptions in global capital and credit markets; movements in interest rates; reform of LIBOR;
competitive pressures on product pricing and services; success, impact, and timing of our business strategies, including market acceptance of
any new products or services including those implementing our “Fair Play” banking philosophy; the nature, extent, timing, and results of
governmental actions, examinations, reviews, reforms, regulations, and interpretations, including those related to the Dodd‐Frank Wall Street
Reform and Consumer Protection Act and the Basel III regulatory capital reforms, as well as those involving the OCC, Federal Reserve, FDIC, and
CFPB; and other factors that may affect our future results. Additional factors that could cause results to differ materially from those described
above can be found in our 2019 Annual Report on Form 10‐K, and our Quarterly Report on Form 10‐Q for the quarters ended March 31, 2020
and June 30, 2020, as well as our subsequent Securities and Exchange Commission (“SEC”) filings, which are on file with the SEC and available in
the “Investor Relations” section of our website, http://www.huntington.com, under the heading “Publications and Filings.”

All forward‐looking statements speak only as of the date they are made and are based on information available at that time. We do not assume
any obligation to update forward‐looking statements to reflect circumstances or events that occur after the date the forward‐looking statements
were made or to reflect the occurrence of unanticipated events except as required by federal securities laws. As forward‐looking statements
involve significant risks and uncertainties, caution should be exercised against placing undue reliance on such statements.

                                                                 2020 Barclays Global Financial Services Conference             2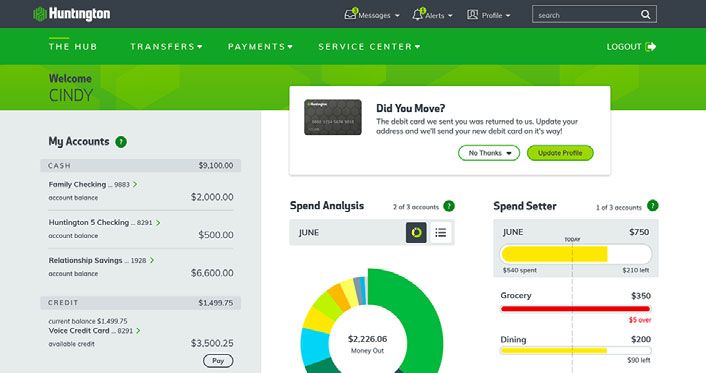
Building the Leading People First, Digitally Powered Bank
Creating a sustainable competitive advantage with focused investment in
customer experience, product differentiation, and key growth initiatives
We are a Purpose‐driven company
Our Purpose is to make people’s lives better, help businesses thrive, and strengthen the communities we serve
Drive organic growth across all business segments
Deliver a superior customer experience through differentiated products, digital capabilities, market segmentation, and
tailored expertise
Leverage the value of our brand, our deeply‐rooted leadership in our communities, and our market‐leading convenience to
efficiently acquire, deepen, and retain client relationships
Deliver sustainable, top quartile financial performance and efficiency
Drive diversified revenue growth while maintaining rigorous expense management discipline and maximizing returns on organic
growth investments
Minimize earnings volatility through the cycle
Deliver top quartile returns on capital
Be a source of stability and resilience through enterprise risk management & balance sheet strength
Maintain an aggregate moderate‐to‐low risk profile through the cycle
Disciplined capital allocation and priorities (first fund organic growth, second maintain the dividend, and then other capital uses)
2020 Barclays Global Financial Services Conference 3
Updated 3Q20 Expectations

                 3Q20E
               (vs. 2Q20)                                           Commentary
                            •   Commercial loans down approximately 1% as full quarter impact of PPP offset by
                                continued reductions in dealer floorplan and commercial line utilization rates
Avg Loans        ~Flat
                            •   Consumer loans up approximately 2% driven by growth in residential mortgage, indirect
                                auto, and RV/Marine with the remaining categories relatively flat
                            •   Commercial deposits down approximately 1% assuming gradual usage of deposit inflows
                                from government stimulus
Avg Deposits    Up ~1%
                            •   Consumer deposits up approximately 2% driven by continued strong digital acquisition
                                and as branches return to BAU production
                            •   Net interest income up 3‐4% benefitting from modest NIM expansion of approximately
                                2‐5 bp and slightly higher average earning assets
Revenue         Up ~4%
                            •   Fee income up more than 5% as mortgage banking increases further while pandemic‐
                                impacted lines rebound
                            •   Approximately +2% driven by $15 million of the $25 million restructuring costs from the
                                2020 expense management plan
Expense         Up ~5%      •   Approximately +3% driven by investments in technology capabilities and marketing as
                                well as the return of customer and sales activity costs closer to pre‐pandemic levels
                            •   Forecasting analysis indicates positive operating leverage for FY20 (8th consecutive year)

                 65 bp      •   NCOs to remain elevated, impacted by the oil and gas portfolio as well as broader
NCOs            +/‐ 5 bp        economic conditions

                                               2020 Barclays Global Financial Services Conference      4
Commercial Financial Accommodations
Commercial deferrals are down $3.9B from June 30 as most customers have exited their deferral period with no known
significant credit issues to date
o Hospitality customers generally receiving a second 90‐day deferral due to longer‐term recovery outlook
o Auto dealers have no remaining deferral balances
o Franchise restaurant customers generally out of deferral periods and resuming contractual payments
o We expect some incremental deferral requests within the total $1 billion SBA portfolio in Q4 as the CARES Act payments
cease. All other segments are expected to show a continued decline in deferrals through the end of the year.
As of 6/30/20 As of 8/31/20
Deferral % of Portfolio Deferral % of Portfolio Change in
$ in millions # Deferrals # Deferrals
Balance Deferred Balance Deferred Deferral Balance
CRE/Construction 335 $1,496 21% 41 $423 6% $(1,073)
Business Banking 4,319 986 19% 528 172 2% (814)
Auto Dealers 165 467 16% 0 0 0% (467)
Middle Market 173 705 12% 51 293 5% (412)
Franchise
290 729 67% 10 36 3% (693)
Finance
C&I – All Other 865 612 3% 75 184 1% (428)
Total 6,147 $4,995 12% 705 $1,108 3% $(3,887)
2020 Barclays Global Financial Services Conference 5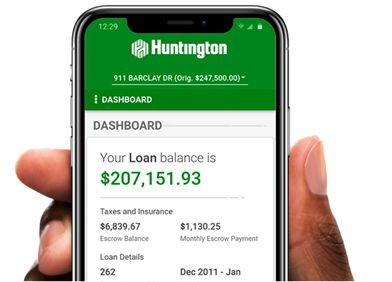
Consumer Financial Accommodations
Consumer deferrals are down $1.2B from June 30 as customers have exited their original deferral plans, with limited new or
second deferrals
o Mortgage deferrals reduced by $626MM with 80% of post deferral customers current or in a pending payment status,
15% requesting additional forbearance time, and 5% requiring additional Home Savers(1) assistance
o Auto deferrals reduced by $353MM, with post deferral 30+ delinquency rate of 4%
o HELOC deferrals reduced by $137MM, with a post deferral 30+ day delinquency rate of 2%
o RV/Marine deferrals reduced by $99MM, with a post deferral 30+ delinquency rate of 2.5%
As of 6/30/20 As of 8/31/20
Deferral % of Portfolio Deferral % of Portfolio Change in
$ in millions # Deferrals # Deferrals
Balance Deferred Balance Deferred Deferral Balance
Residential
4,178 $1,062 8% 2,401 $436 3% $(626)
Mortgage
Indirect Auto 21,841 423 3% 4,081 70 1% (353)
HELOC 2,465 207 3% 778 70 1% (137)
RV / Marine 2,159 115 3% 343 16 < 1% (99)
Other Consumer 1,520 17 2% 145 2 < 1% (15)
Total 32,163 $1,824 5% 7,748 $594 2% $(1,230)
See notes on slide 17
2020 Barclays Global Financial Services Conference 6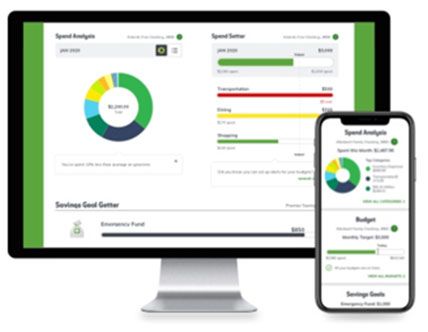
Huntington’s Digital Evolution

     Digital Differentiation
                                                                Building our Core
      and Transformation
                                                           Owning our online, mobile, and alerts
      Driving engagement and profitability
                                                                 platforms, leveraging agile
     through digital tools, AI, segmentation
                                                              development, and partnering to
                  and mobility
                                                           further enhance customer experience

        Digital Origination
                                                               Branch Experience
            Expansion
          Ensuring our customers can                         Leveraging digital technology to
          open accounts digitally in all                  optimize sales & service and empower
             core product families                         3,500+ bankers across our footprint

                                               2020 Barclays Global Financial Services Conference   7
Differentiating with Digital & Product
 100+ digital projects launched over 2 years, driving value

       Customers that are engaged with The Hub tools demonstrate higher
       levels of satisfaction, lower levels of attrition, and higher profitability

                                 Differentiated Digital Services                                                2 New Products

      Money                              Personalized                      Savings
    Management                             Insights                      Automation
                                                                                                                Now for Businesses

                                                                                                            & $50      Safety Zone
                                                                                                                    for Consumers and
                                                                                                                         Businesses
                                                                                                              When you overdraw your
       The Hub                                                                                             account, you have a $50 Safety
                                                                                                              Zone before you incur an
   Track and analyze your            Leveraging AI to provide         Use AI to analyze your                overdraft fee. If you overdraw
spending and help you create        personalized and proactive     spending habits, income, and            your account by more than $50,
and reach your financial goals               insights               upcoming expenses to find               you have 24‐Hour Grace giving
                                                                     money you're not using in                you more time to make a
             E.g.                                E.g.
                                                                          your account                         deposit and avoid a fee.
Spend Analysis, Savings Goals      Duplicate charges, Returned
        & Budgets                    check, Refund received              September ‘20
                                                                                                                     September ‘20

 See notes on slide 17
                                                               2020 Barclays Global Financial Services Conference      8
Digital Transformation
           Tailored Customer
                                                                                          Mobility
           Experiences
Customer centric experiences designed to support the              Invest in mobile as the platform of choice for our
  unique needs of our Consumer, Business Banking,               customers while leveraging new technology and AI to
       Private Bank and Corporate customers                                      enhance self service

                              Consumer
                              •   Budget
                                                                                             Payments
                                                                                             • Bank to Bank Transfers
                              •   Goals
                                                                                             • Zelle
                              •   Credit & ID Monitoring
                              •   Automated Saving

                              Private Bank                                                   Self Help
                              • My Team                                                      • ChatBot (AI)
                              • Insights                                                     • Schedule a Call Back
                              • Credit & ID Monitoring

                              Business                                                       Enhanced Servicing
                              • Cashflow                                                     • Card Controls
                              • Treasury Services                                            • Enhanced Mortgage Servicing
                              • Access Management

                                                    2020 Barclays Global Financial Services Conference    9
Digital Usage
A key indicator of engagement
Active Digital Users Active Mobile Users Digital Logins
(Millions) (Millions) (Millions)
+8% YoY +45% YoY
+13% YoY 139.39
2.99 2.10
2.95 2.05 108.72 25.96
96.50
23.81
23.95
2.76 1.86
113.43
72.55 84.90
2Q19 1Q20 2Q20 2Q19 1Q20 2Q20 2Q19 1Q20 2Q20
Mobile Online
Consumer Checking Consumer Deposit
New Households Transactions by Channel
Digital vs Non‐Digital Acquisition
42% 34%
46%
48%
62%
75% 34%
33% 34%
52%
38% 25% 32%
25% 22%
2Q19 1Q20 2Q20 2Q19 1Q20 2Q20
Digital Non‐Digital Mobile ATM Branch
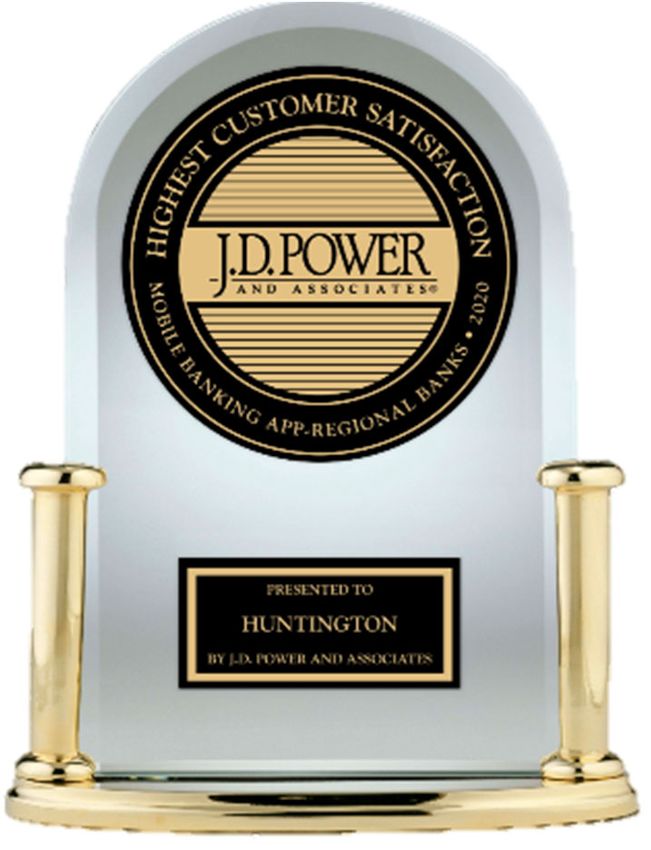
2020 Barclays Global Financial Services Conference 10Industry‐leading Mobile and Online Customer Satisfaction
Honored for the second consecutive year for consumer mobile and digital
banking customer satisfaction
August 1, 2019
Huntington Online Banking and Mobile App Rank Highest in Two
J.D. Power 2019 Banking Satisfaction Studies
Awards reflect focus on listening to customers and
delivering an exceptional digital experience
COLUMBUS, Ohio – Huntington Bank (Nasdaq: HBAN; www.huntington.com) has claimed the
top spots in the J.D. Power 2019 U.S. Banking App Satisfaction Study and the U.S. Online
Banking Satisfaction Study.
August 19, 2020
Huntington Mobile App Ranks Highest Among Regional Banks in the
J.D. Power 2020 U.S. Banking Mobile App Satisfaction Study
for the Second Year in a Row
Award reflects Huntington’s continued focus on listening to customers
and delivering exceptional digital tools
COLUMBUS, Ohio – Huntington Bank (Nasdaq: HBAN; www.huntington.com) has claimed the
top spot among regional banks in the J.D. Power 2020 U.S. Banking Mobile App Satisfaction
Study for the second year in a row.
#1 in Regional Bank Mobile App
Customer Satisfaction(1)
Visit jdpower.com/awards for more details
See notes on slide 17
2020 Barclays Global Financial Services Conference 11Our Competitive Edge: Owned and Partnered
Owning Our Core World Class Partnerships
Foundation including Online, Mobile, Accelerating speed to market
and Alerts platform built internally
Development Investment YoY Differentiation
+54%
+36%
Origination
2018 2019 2020 Est
Digital Features Released
Segmentation & Servicing
+73% +77%
2Q19 2Q20 3Q19 3Q20
Est
2020 Barclays Global Financial Services Conference 12Expanding Best In Class Servicing Satisfaction to
Digital Origination
In 2020, Huntington is aggressively expanding origination capabilities to
ensure all core product families can originate digitally
1Q20 2Q20 3Q20 4Q20
Consumer Credit Card Consumer Credit Card Consumer Credit Card Consumer Credit Card
Consumer Checking Consumer Checking Consumer Checking Consumer Checking
Consumer Saving Consumer Saving Consumer Saving Consumer Saving
Mortgage Mortgage Mortgage
Home Equity Home Equity Home Equity
Business Savings Business Savings
Existing Capability (existing customers only) (new & existing customers)
New Capability Added Business Checking
Business Lending
2020 Barclays Global Financial Services Conference 13COVID Has Not Changed the Importance of Branches,
But It Has Changed the Branch Experience
Branch Toolset Digital Capabilities
Built on the premise of the Built to drive Product
customer physically being Selection, self service and
present in branch satisfaction
We leverage digital technology to optimize
sales & service and empower 3,500+ bankers
across our footprint
Virtual Digital Sales Remote Appointment Remote Account eSign
Collaboration Collateral Authentication Setting Opening Integration
Full launch in 3Q20 ‐ 4Q20 Piloting in 4Q20
Building the Leading People First, Digitally Powered Bank
2020 Barclays Global Financial Services Conference 14Basis of Presentation
Use of Non‐GAAP Financial Measures
This document contains GAAP financial measures and non‐GAAP financial measures where management believes it to be helpful in
understanding Huntington’s results of operations or financial position. Where non‐GAAP financial measures are used, the
comparable GAAP financial measure, as well as the reconciliation to the comparable GAAP financial measure, can be found in this
document, conference call slides, or the Form 8‐K related to this document, all of which can be found in the Investor Relations
section of Huntington’s website, http://www.huntington.com.
Annualized Data
Certain returns, yields, performance ratios, or quarterly growth rates are presented on an “annualized” basis. This is done for
analytical and decision‐making purposes to better discern underlying performance trends when compared to full‐year or year‐over‐
year amounts. For example, loan and deposit growth rates, as well as net charge‐off percentages, are most often expressed in
terms of an annual rate like 8%. As such, a 2% growth rate for a quarter would represent an annualized 8% growth rate.
Fully‐Taxable Equivalent Interest Income and Net Interest Margin
Income from tax‐exempt earning assets is increased by an amount equivalent to the taxes that would have been paid if this income
had been taxable at statutory rates. This adjustment puts all earning assets, most notably tax‐exempt municipal securities and
certain lease assets, on a common basis that facilitates comparison of results to results of competitors.
Earnings per Share Equivalent Data
Significant income or expense items may be expressed on a per common share basis. This is done for analytical and decision‐
making purposes to better discern underlying trends in total corporate earnings per share performance excluding the impact of
such items. Investors may also find this information helpful in their evaluation of our financial performance against published
earnings per share mean estimate amounts, which typically exclude the impact of Significant Items. Earnings per share equivalents
are usually calculated by applying an effective tax rate to a pre‐tax amount to derive an after‐tax amount, which is divided by the
average shares outstanding during the respective reporting period. Occasionally, when the item involves special tax treatment, the
after‐tax amount is disclosed separately, with this then being the amount used to calculate the earnings per share equivalent.
2020 Barclays Global Financial Services Conference 15Basis of Presentation
Rounding
Please note that columns of data in this document may not add due to rounding.
Significant Items
From time to time, revenue, expenses, or taxes are impacted by items judged by management to be outside of ordinary banking
activities and/or by items that, while they may be associated with ordinary banking activities, are so unusually large that their
outsized impact is believed by management at that time to be infrequent or short term in nature. We refer to such items as
“Significant Items”. Most often, these Significant Items result from factors originating outside the company – e.g., regulatory
actions/assessments, windfall gains, changes in accounting principles, one‐time tax assessments/refunds, and litigation actions. In
other cases they may result from management decisions associated with significant corporate actions out of the ordinary course of
business – e.g., merger/restructuring charges, recapitalization actions, and goodwill impairment.
Even though certain revenue and expense items are naturally subject to more volatility than others due to changes in market and
economic environment conditions, as a general rule volatility alone does not define a Significant Item. For example, changes in the
provision for credit losses, gains/losses from investment activities, and asset valuation write‐downs reflect ordinary banking
activities and are, therefore, typically excluded from consideration as a Significant Item.
Management believes the disclosure of “Significant Items”, when appropriate, aids analysts/investors in better understanding
corporate performance and trends so that they can ascertain which of such items, if any, they may wish to include/exclude from
their analysis of the company’s performance ‐ i.e., within the context of determining how that performance differed from their
expectations, as well as how, if at all, to adjust their estimates of future performance accordingly. To this end, management has
adopted a practice of listing “Significant Items” in our external disclosure documents (e.g., earnings press releases, quarterly
performance discussions, investor presentations, Forms 10‐Q and 10‐K).
“Significant Items” for any particular period are not intended to be a complete list of items that may materially impact current or
future period performance. A number of items could materially impact these periods, including those which may be described from
time to time in Huntington’s filings with the Securities and Exchange Commission.
2020 Barclays Global Financial Services Conference 16Notes
Slide 6:
(1) Home Savers is Huntington’s customer assistance team for residential properties that works with customers on repayment
plans, modifications, and other options when a customer experiences a financial hardship.
Slide 8:
(1) If your account is overdrawn, we’ll give you more time to make it right to avoid the overdraft fee. To find out how 24‐Hour
Grace® works, visit huntington.com/Grace. For the no overdraft fee $50 Safety Zone, your account is automatically closed in
60 days if it remains negative.
Slide 11:
(1) Visit jdpower.com/awards for more details.
In 2020, Huntington received the highest score among regional banks ($55B to $150B in deposits) in the J.D. Power 2019‐
2020 U.S. Banking Mobile App Satisfaction Study of customers’ satisfaction with their financial institution’s mobile
applications for banking account management.
In 2019, Huntington ranked #1 in both the J.D. Power 2019 U.S. Banking App Satisfaction and U.S. Online Banking
Satisfaction studies, receiving the highest score among all banks (i.e., national banks and regional banks) in both surveys.
2020 Barclays Global Financial Services Conference 17You can also read