Short term and long term opportunities to leverage synergies between the electricity and transport sectors through power-to- Hinicio
←
→
Page content transcription
If your browser does not render page correctly, please read the page content below
Power-to-gas
Short term and long term
     opportunities to
   leverage synergies
 between the electricity
  and transport sectors
   through power-to-
        hydrogen

       1 8   D e c e m b e r   2 0 1 5

             COPYRIGHT: HINICIO & LBST
Hinicio
STRATEGY CONSULTANTS
IN SUSTAINABLE ENERGY
HYDROGEN AND AND TRANSPORT
FUEL CELLS
Multidisciplinary
approach and team:
Technology
Market/economics
RENEWABLE ENERGY Policy and regulation
3 offices:
Brussels (HQ)
Paris
Bogota
Clients in more than 15
countries in Europe,
ENERGY STORAGE ELECTRO-MOBILITY Latin America and Asia
2
LBST
Independent expert for
sustainable energy and mobility
for over 30 years
Bridging technology, markets,
and policy
Renewable energies, fuels,
infrastructure
Technology-based strategy
consulting,
System and technology studies,
Sustainability assessment
Global and long term
perspective
Rigorous system approach –
thinking outside the box
Serving international clients
in industry, finance, politics, and
NGOs
3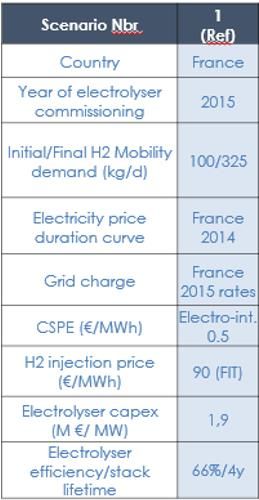
Content of the presentation

1. Introduction - Setting the scene

2. Application A : Hydrogen from power-to-gas for use in
   refineries

3. Application B : Semi-centralised power-to-hydrogen system
   for coupling the electricity and transport sectors

4. Questions

                                                           4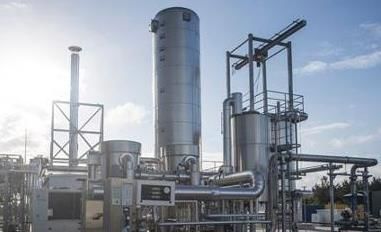
Introduction
Setting the scene

               S e c t i o n   1

       COPYRIGHT: HINICIO & LBST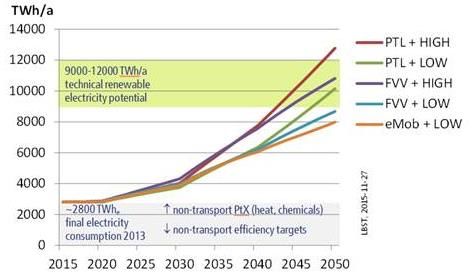
More renewables and electrification of transport
                                         are required on the road to 2oC
                                                                                        IEA 450 (2oC) scenario

     2oC requires more renewables…                       … and electrification of transport

                                                            Global light duty vehicle sales

                                Global emissions

    Global emissions from power plants

•     Investment increase from B$270/yr in 2014 to   •   Sales of EVs exceed 40% of total passenger car
      B$400/yr in 2025.                                  sales worldwide in 2040.

•     Installed capacity growing from 450 GW today   •   Sets the scene for providing the needed
      to 3300 GW in 2040.                                emissions reductions after 2040.
•     Variable renewables increase from 3% of
      generation to more than 20% by 2040.

                                                                                                             6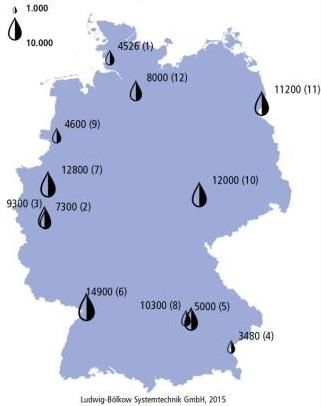
Additional power generation will be needed
                                                for transport

The required additional power generation capacity depends on the adopted
            powertrain technology, but is in any case substantial.

                                 Road transport

         EU-28 2013 final
         electricity
         consumption
         ~ 2800 TWhe

                                                                 All transport

                                                                                                     7
                            Figures: LBST, Renewables in Transport 2050 – Europe and Germany, 2015
Power-to-Gas allows to decarbonise transport while
improving the power system’s operating conditions
More renewable without PtG More renewable with PtG
= More problems = Less problems
Consumption, VRE production an residual load - without PtoG Consumption, VRE production an residual load - with PtoG
120 000 120 000
100 000 100 000
80 000 80 000
MW
MW
60 000 60 000
52 GW
Reduced load 42 GW
40 000 factor 40 000
20 000 Low minimum 20 000
load
0 0
00:00
01:00
02:00
03:00
04:00
05:00
06:00
07:00
08:00
09:00
10:00
11:00
12:00
13:00
14:00
15:00
16:00
17:00
18:00
19:00
20:00
21:00
22:00
23:00
00:00
01:00
02:00
03:00
04:00
05:00
06:00
07:00
08:00
09:00
10:00
11:00
12:00
13:00
14:00
15:00
16:00
17:00
18:00
19:00
20:00
21:00
22:00
23:00
00:00
01:00
02:00
03:00
04:00
05:00
06:00
07:00
08:00
09:00
10:00
11:00
12:00
13:00
14:00
15:00
16:00
17:00
18:00
19:00
20:00
21:00
22:00
23:00
00:00
01:00
02:00
03:00
04:00
05:00
06:00
07:00
08:00
09:00
10:00
11:00
12:00
13:00
14:00
15:00
16:00
17:00
18:00
19:00
20:00
21:00
22:00
23:00
Residual load VRE production Consumption Mean residual load New residual load VRE production Additional VRE
Mean resiudal load Consumption w/o PtoG Consuption with PtoG
Power consumption during two days in France in Jan and Power to H2
Feb 2013. Actual VRE* production on these days multiplied 60 000
by 10
40 000
Power-to-Gas provides systemic benefits and
MW
improved economics for all: 20 000
0
• Improved load factors / less curtailment;
00:00
01:00
02:00
03:00
04:00
05:00
06:00
07:00
08:00
09:00
10:00
11:00
12:00
13:00
14:00
15:00
16:00
17:00
18:00
19:00
20:00
21:00
22:00
23:00
00:00
01:00
02:00
03:00
04:00
05:00
06:00
07:00
08:00
09:00
10:00
11:00
12:00
13:00
14:00
15:00
16:00
17:00
18:00
19:00
20:00
21:00
22:00
23:00
PtoH2 Mean PtoG
• More predictable operation of dispatchable Additional consumption of 20 GW on average from H2
mobility
capacity. Only half of this is provided by additional VRE
The other half is provided by the existing capacity:
*VRE : variable renewable energy Figures: Hinicio, Compensating VRE intermittency with Power-to-gas 8
with data [RTE,2015]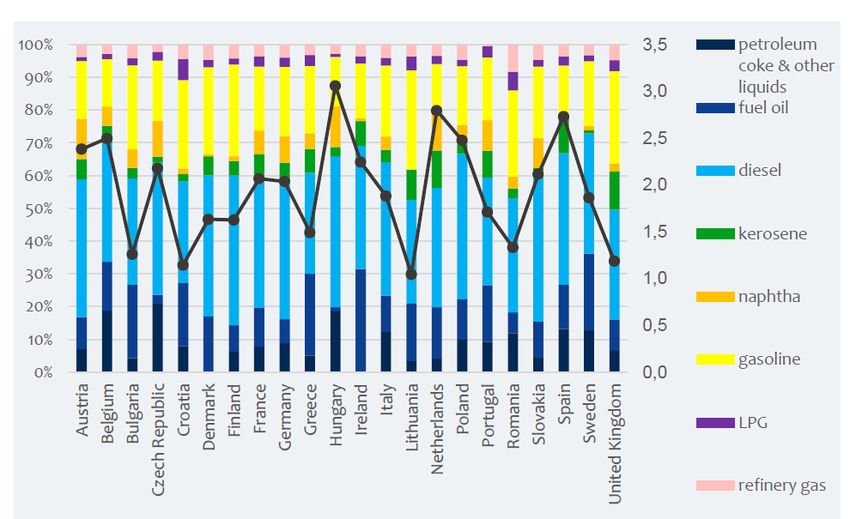
Power-to-Gas:
                                 Linking renewable electricity and transport

                                                                                                      Source: LBST 2015
                                                                         Electricity infrastructure                           Electricity
                                                                                                                              Hydrogen
                                                                                                                              Gas

                                                                                                                               Focus of this study
            Renewable electricity

                                                      Electricity grid                                                    Hydrogen applications

                                                                         Hydrogen infrastructure

                                                                                                                                                Mobility
                                                                                                                                H2

                  G         Fuel Cell

                                                                                                                          Refuelling stations

    Gas turbine / CCGT     Fuel cell                    Electrolysis
                                                                                                                                                            Scope of the study

                                                                                                                                                Fuels
                                                                                H2 supply chain

                                                                                                                              Refineries

                                                                                                                                                Chemicals
                                                                          H2 storage

                                        Methanation                Underground storage
                                                                                                                              Industry

                                                                                Gas infrastructure

                                                          Gas grid

               Power-to-Gas – PtG :
Production of a high-energy-density gas via water
electrolysis
                                                                                                                                                            Image: LBST.     9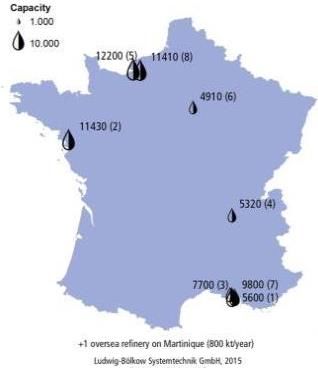
Power-to-Gas can support balancing at any
time scale and at any point in the T&D system
 1
     With a high degree of flexibility and
     supported by large amounts of storage, PtG
     can support balancing at any time scales,
     from supply of primary reserve to seasonal
     storage (with underground storage).

 2
     PtG can close growing gaps between local
     production and consumption, reducing the
     need to expand the distribution grid, which
     carries most of the burden

 3
     PtG can be used along with other flexibility
     options such as CHP & heat pumps with
     heat storage, batteries and demand
     response.

                                                    10
Power-to-hydrogen can be implemented at
different scales, from distributed to centralised
W/o H2 use With H2 use
centralised Semi-centralised On-site
>X0 MW X MW
Source: Hinicio 2016
X00 km
X0 km
Nation-wide HRS network
Region-wide HRS network
X0 kW
Image: Hinicio 11Comparing electrolyser technologies
Alkaline PEM
Development stage Industrial since 1920s Early stage commercialization
Unit : 3.8 MW/67,7 kg/h
6 MW/ 120 kg/h
Maximum capacity Plant : 100 MW/1900 kg/h
(3 x 2 MW pilot unit)
(Zimbabwe)
Up to 2 A/cm2
Current density Up to 0.4 A/cm2
(R&D: 3.2 A cm-2 at 1.8 V at 90oC)
Dynamic response Less than one minute Within seconds
Peak load 100% 200% (30 min)
Turn down 20 – 40 %Direct injection is the cheapest way to “dump”
hydrogen from excess RE into the gas grid
Advantages Disadvantages
DIRECT INJECTION • Maximum injection limit
• Natural gas specification allows (technical and regulatory).
the blending of hydrogen
• There is no business case for
• Less costly than methanation direct injection unless
regulatory changes are made
(FIT…)
METHANATION
(Sabatier process) • No maximum injection limit • Requires a concentrated CO2
source
• Exothermal – potential
synergies with CO2 generating • More costly than direct
process injection: no business case
without regulatory changes
13Regulation drives the energy transition in
both the power and transport sectors
Topic Sector World EU France Germany
2020: -20% 2030: -40% 2020: -40%
2030: -40% 2050: -75% 2030: -55%
< 2oC
All sectors 2040: -60% vs. 1990 2040: -70%
(COP21)
2050: -80/-95% (LTE) 2050: -80/-95%
Greenhouse vs. 1990 vs. 1990
gases 2020: -6% (FQD) 2020: -10%2010 2015: -3.5%2010
2050: -60% (code de l énergie) 2017: -4%2010
Transport (COM 2011 144) 2028:-22%2013 2020: -6%
2050:-70%2013 (BImSchG)
(SNBC proj)
2020: 20% 2020: 23% 2020: 18%
2030: 27% (LTE) 2030: 30%
All sectors 2040: 45%
Renewable
2050: 60%
energy
(Energiekonzept)
2020: 20% 2020: 10.5%2013
Transport (RED) (SNBC proj)
2020: -20%1990 2020: -7%2005 2020: -20%
(COM 2011 112) (SNBC) 2030: /
All sectors
2040: /
Energy 2050: -50%
consumption 2020: -10%
2030: /
Transport
2040: /
2050: -40%
14Power-to-hydrogen systems can
simultaneously address multiple applications
Business model
assessed
Applications Options BM1 BM2
H2 sales to other markets • H2 fuelling stations
• Industry – H2 refineries
H2 injection into gas grid • Direct
• Methanation
Ancillary services to power • Primary and/or
grid secondary reserve
BM1: Business model 1 BM2: Business model 2
• Electrolyser investment and • Electrolyser considered as a part of
operation by an independent entity the T&D infrastructure
• Income from hydrogen sales to • Costs fully covered by costs-based
market and gas grid and from grid charges
provision of ancillary services to the
power grid
15Application A
Hydrogen from
power-to-gas for use
in refineries
S e c t i o n 2
COPYRIGHT: HINICIO & LBSTRegulatory framework
Fuel greenhouse gas emission reduction
EU France Germany
Criteria
Fuel Quality Directive (FQD) Code de l‘énergie BImSchG/V
Lifetime 2020 2020 2020
-2 % by 2015 -10% by 2020 -3.5 % by 2015
GHG targets -4 % by 2017 -4 % by 2017
-6 % by 2020 -6 % by 2020
Energy tax responsible
Energy tax responsible
Responsibility Supplier entity (usually the fuel
entity (usually the refinery)
refinery)
Options
upstream: Flaring/venting Flaring/venting –
refinery: – Refinery GHG emissions –
reduction
downstream: Biofuels and alternative Biofuels, electricity Biofuels
fuels from non-biological
sources
H2 eligible as transportation H2 not yet eligible as H2 not yet eligible; ‘further
fuel (2015/652/EU, ANNEX I), transportation fuel. renewable fuels’ (e.g. PtG)
not for use in refineries yet Reduction of refinery and ‘other measures’ are
Hydrogen
emissions through use of subject to enforcement of
low carbon hydrogen is a legal ordinance (§37d
eligible (2), point 13
Subject to national Not yet defined 470 €/t CO2eq
implementation, which shall
Infringement (Application decrees to be
There
penalty is increasing interest
be ‘effective, in Germany from refiner’s
published in 2017) side
proportionate and
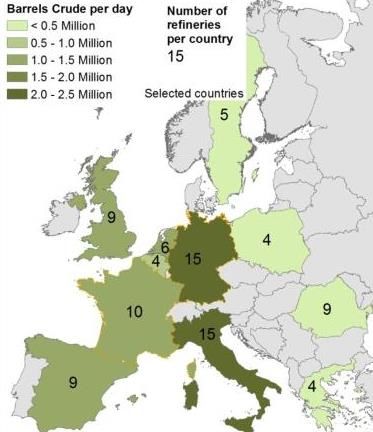
dissuasive’ 17Refinery landscape Europe
France and Germany are among the
‘top 5’ countries in Europe with regard
to the number of refineries and the
total installed refinery
Germany is the leading refinery
location in Europe, by installed
distillation capacity as well as by the
number of refineries installed
France ranks fourth in Europe by
number and capacity
Source: LBST with data [E3M et al. 2015]
18Refineries in France and Germany
FRANCE GERMANY
68.4 million t/yr capacity 103.4 million t/yr capacity
Image: LBST with data [MEDDE 2015] Image: LBST with data [MWV 2015]
19Product portfolio of European refineries
The product mix from European refineries is diesel oriented
(31-49% diesel, 13-30% gasoline, 1-12% kerosene – in % of total refinery output)
Marginal differences between French & German refineries’ product mixes only
France and Germany are well within the average of European refineries
Image: [EXERGIA et al. 2015] 20Crude oil qualities in European refineries
There is a trade-off between crude oil cost and quality
In Europe, a wide range of crude oil qualities is processed
French and German refiners source rather better qualities
Average crude oil quality [EXERGIA et al. 2015]:
France: 36.0 API gravity, 0.7 wt.-% sulphur
Germany: 37.3 API gravity, 0.5 wt.-% sulphur
Image: [EXERGIA et al. 2015] 21Hydrogen sources and uses in a refinery
Refinery Gasoline
H2 Sources H2 Uses Kerosene
Crude oil Reformer/ Desulphurisation
Platformer Hydrotreating Diesel
H2 Hydrocracking
Other
LBST, 27.10.2015
H2
Net H2 demand
Calculation: Net hydrogen demand = process sources – process uses
Desulphurisation is a sensitive parameter to net hydrogen demand
By tendency,
crude oil quality is further deteriorating increasing sulphur content
demand for heavy fuel fractions is decreasing maritime emission areas
22Synthetic refinery France
LPG: 1.6 Mt Crude naphtha: 7.6 Mt
Alklylate
iC4
1.1 Mt
Alkylation
C1/C2
Isomerate
Light naphtha
Isomerization C4 & lighter H2
C3 2.5 Mt
Gas C4 & lighter
C4 & lighter
Sep. iC4/nC4 Heavy naphtha Reformate
plant Catalytic fractionation
and
7.9 Mt reformer hydrogenation
H2S H2
17.6 Mt H2
Reformate
0.4 Mt
HDS
Visbreaker Lt. naphtha
Naphtha H2 Alkylate
H2S H2 C4 & lighter ETBE: 0.1 Mt
Crude
Atm.
6.4 Mt
Isomerate Gasoline
distillation HDS Lt. naphtha FCC naphtha
oil Kerosene (6.7 Mt) Hydro
Visbreaker Gasoline:
68.4 Mt
kerosene
Cracker Heavy naphtha
0.7% S 14.9 Mt
36 API Diesel
H2S H2 Jet fuel:
C1/C2 Kerosene
10.5 Mt
(13.0 Mt)
Kerosene 7.8 Mt
C3/iC4
HDS
Visbreaker Diesel FCC FCC naphtha
diesel Diesel/
Diesel Diesel/Lt. lt. heating oil:
Atm. residue: 29.1 Mt 21.5 Mt
C4 & lighter: 0.2 Mt heating oil
H2S H2 1.4 Mt
Vacuum
distillate: 16.9 Mt To naphtha HDS: 0.4 Mt H2S
Vacuum HDS
distillation Visbreaker To kerosene HDS Claus plant
Vaccuum residue 5.3 Mt 0.9 Mt
To diesel HDS
Heavy fuel oil/ S
Feed bitumen plant: 6.9 Mt Heavy fuel oil: 5.2 Mt
Refinery France
Source: LBST refinery model 23Hydrogen demand and production
French & Germany crude oil refineries (kt/yr)
Refinery process H2 demand H2 production Net H2 demand
Hydrocracking 220.3
France [kt/yr]
Vacuum distillate desulfurisation 29.2
Middle distillate desulfurisation 48.9
Naphtha desulfurisation 21.7
FCC cracker 0*
Catalytic reformer 158.9
Total 320.1 158.9 161.3**
Refinery process H2 demand H2 production Net H2 demand
Hydrocracking 327.2
Germany [kt/yr]
Vacuum distillate desulfurisation 22.3
Middle distillate desulfurisation 65.1
Naphtha desulfurisation 37.0
FCC cracker 0*
Catalytic reformer 307.7
Total 452.1 307.7 144.4**
* H2 from FCC plus other gases for heat supply; ** assumed to be supplied by steam-methane reformer (SMR)
24Life-cycle assessment (LCA)
Pathways for gasoline and diesel supply
Gasoline Gasoline
Crude oil
Crude oil Crude oil Diesel Diesel
TODAY (SMR H2)
Extraction Transport Refinery Distribution Refuelling station
H2
Natural gas
Natural gas
LBST, 2015-12-09
Natural gas
Extraction & processing Transport Steam reforming
Crude oil
Gasoline Gasoline
Crude oil Crude oil Diesel Diesel
NEAR FUTURE (GREEN H2)
Extraction Transport Refinery Distribution Refuelling station
H2
Electricity H2
Renew. electricity
Wind power Electrolysis Compression
& storage
LBST, 2015-12-09
Electricity
Photovoltaic
25Scenario
Refinery net H2 demand from 100% green H2
26Greenhouse gas emissions per final fuel
France and Germany [g CO2eq/MJfinal fuel]
100
-0.70% -0.45%
GHG (g CO2 equivalent/MJfinal fuel)
90
80
70
60
50
94.1 93.4 93.7
40
30
20
10
0
Reference Renwable PtH2 Renwable PtH2
Fossil fuel comparator France Germany
FQD minimum target is -6% GHG emissions by 2020
27Refinery GHG emission reduction (gate-to-gate)
France and Germany
France Germany
1.33 Mt CO2eq/a 1.50 Mt CO2eq/a
GHG mitigation of refinery emissions
14.1 % 7.2 %
To give an impression about the quantities, this is equivalent to annual GHG
emission of C segment cars in the order of
Gasoline car @ 7.0l/100km 575,000 648,000
Diesel car @ 5.5l/100km 658,000 740,000
Tangible action for refinery corporate social responsibility (CSR)
28Gasoline and diesel production costs
France and Germany [€/GJfinal fuel]
18
16 +1.4% +0.9%
14
Costs (€/GJfinal fuel)
12
10
8 15.58 15.80 15.73
6
LBST, 2015-12-15
4
2
0
H2 from SMR Renwable PtH2 Renwable PtH2
Reference France Germany
Impact on fuel costs: +0.8 ct/lDiesel-eq +0.5 ct/lDiesel-eq
GHG abatement costs: 331 €/t CO2eq 339 €/t CO2eq
Penalties for non-compliance are 470 €/t CO2eq in Germany
29Cumulated investments
France and Germany
40 % PV : 60 % wind onshore
France Germany
Net H2 input per crude oil input 0.66 % (LHV) 0.39 % (LHV)
1.33 Mt CO2eq/a 1.50 Mt CO2eq/a
GHG mitigation of refinery emissions
14.1 % 7.2 %
4.06 TWhH2/a 4.56 TWhH2/a
H2 demand
122 ktH2/a 137 ktH2/a
Required electrolyser capacities 1.58 GWe 1.78 GWe
Electrolyser cost reduction 2025 45 %2015 45 %2015
Cumulated investments electrolysis [€] 1.5 billion € 1.6 billion €
Electricity demand H2 production 6.24 TWhe/a 7.02 TWhe/a
Required RES plant capacities 3.14 GWe 3.73 GWe
Wind onshore 1.90 GWe 2.24 GWe
Photovoltaics 1.24 GWe 1.49 GWe
Cumulated investments RES plants 4.4 billion € 5.4 billion €
Cumulated investments RES + electrolysis 5.9 billion € 7.0 billion €
For comparison: 650,000 cars 30,000 €/EV = 19.5 billion €
30Scenario installed electrolyser capacities in
French and German refineries
2,000
1,800 France
Installed capacity (MWe)
1,600 Germany
1,400
1,200
1,000
800
600
400
200
0
2015 2020 2025 2030
Year
Example for an average refinery in France in 2020:
8 units of 4 MW wind power plants + 20 MW installed photovoltaics
31Green hydrogen in refineries
Take-away messages
Conclusions
Green H2 in refineries is an attractive GHG mitigation option
A portfolio of options will be needed post-2020 at the latest
Introduction of green H2 in an established bulk H2 application
Volume production of H2 reduces electrolyser costs
Electrolysers ‘valley of death’ is bridged by all fuel users
Deployment of electrolysers for refineries is a strategic move
entailing long-term benefits for all hydrogen uses.
Recommendations
Establish regulatory grounds for accountability at EU level
Fast-track implementation rather at national level
This study did full-cost analysis to explore the potentials ― next:
Refinery specific business case analyses
Regional renewable electricity supply scenarios
Synergies between electricity, refinery, H2 infrastructure
32Application B
Semi-centralised PtG
system for coupling
the electricity and
transport sectors
S e c t i o n 3
COPYRIGHT: HINICIO & LBSTNovel techno-economic modelling of a semi-
centralised hydrogen system
W/o transport With transport
centralised Semi-centralised On-site
>X0 MW X MW
Source: Hinicio 2015
X00 km
X0 km
Nation-wide HRS network
Region-wide HRS network X0 kW
Image: Hinicio 34Main components of a semi-centralised
Power-to-Gas system
kgH2
H2 production &
conditioning €/kgH2
Production Conditioning Storage and Distribution Consolidated
1 MW transport
Business Case
M€ M€ X M€
Source: Hinicio 2015
CAPEX
OPEX k€/yr k€/yr X k€/yr
H2 cost X
€/kgH2 €/kgH2 €/kgH2
€/kg
Revenues - - X k€/yr
35
Image: HinicioSystem dimensioning: starting from the
demand
Electrolyser dimensioning and location
• Dimensioning:
Hypothetical demand of 325 kg/day requiring a
1 MW of electrolysers capacity
• Location:
The electrolyser is located where its makes most
Source: Hinicio 2015
Production sense with regards to interfacing with the power
1 MW and natural gas grid, operations and logistics.
Aggregated hydrogen demand (kg/d)
400
350
300
250
kg/d
200
150
100
50
0
2015 2017 2019 2021 2023 2025
Year
36
Image& figures: HinicioSystem dimensioning: costs and revenues of
the electolyser and conditioning center
CAPEX OPEX
1 MW electrolyser including Electricity costs
conditioning and trailer filling • Spot market price/Energy
center and grid injection skid: purchase price
• Grid charges and other fees
• 2015: 2.5 M€
• Grid charge exemption for
Production • 2030: 1.2 M€ electricity used for injection of H2
O&M : 6% CAPEX/year
Conditioning
REVENUES
• H2 injection: 90 €/MWh
• Primary/ secondary reserve payments: 18 €/MW/h
Image: Hinicio, H2BCase model 37System dimensioning: Hydrogen storage and
distribution system
3-step dimensioning method
1
The HRS storage is sized according to the specific cost of
delivery vs. the specific cost storage capacity (€/kg): delivery
every 3 to 4 days at full capacity.
2
How to dimension hydrogen The trailer capacity is chosen in order to have a filling time of
less than one day from the electrolyser.
logistics and storage?
• Size of storage @ HRS
• Size of trailers 3
• Number of trailers The number of trailers needed in the supply chain is
determined based on time to refill vs total hydrogen
consumption.
One 200 kg trailer is sufficient for initial volumes,
3 trailers when full electrolyser capacity is reached.
38System dimensioning: costs of logistics and
storage
CAPEX OPEX
• CAPEX trailer * N_trailers N_delivery X Cost of delivery
• N_supply-chain fleet = Rotation • Delivery cost:
time * Demand / Trailer cap. • 45 €/h
• CAPEX 200 kg trailer: 125k€ • 1.0 €/km
• N_delivery = Consumption /
Storage and Effective capacity
transport
REVENUES
• H2 sales: 8€/kgH2 (delivered from the electrolyser to the hydrogen
refueling stations at 200 bar)
Image: Hinicio, H2BCase model 39PtG can build on a more favorable electricity
tax regime in France
FRANCE GERMANY
€ 0 / MWh
GRID ACCESS
€ 18 / MWh
(electro-intensive)
RENEWABLE ENERGY € 0.5 / MWh
€ 70* / MWh
CHARGE (electro-intensive)
TOTAL € 19.5 / MWh € 70 / MWh
* Agglomerated average cost including
the concession fees and appropriations
Table: Hinicio & LBST 40Increasing penetration of low marginal cost
generation makes PtG more attractive, in
particular in France
Historical and projected marginal-cost-based Historical and projected marginal-cost-based
price duration curves - GERMANY price duration curves - FRANCE
140 140
120 120
100 100
80 80
60 60
€/MWh
€/MWh
40 40
20 20
0 0
-20 -20
-40 -40
-60 -60
0 1000 2000 3000 4000 5000 6000 7000 8000 0 1000 2000 3000 4000 5000 6000 7000 8000
Hours Hours
Historical (2013) Leitstudie 2011 A (2020) Leitstudie 2011 A (2030) Historical (2014) Marginal cost based "Nouv Mix 2030"
Historical data : 2014 spot market prices for France ; 2013 spot market prices for Germany
For 2020 and 2030, curves are based on marginal costs of production, including CO2 price, and based on projected residual load
power duration curves.
• Marginal costs are generally lower in France than in
Germany, due to nuclear and increased share of
variable RE.
• Visible impact of zero marginal cost RE going forward.
Figures: Hinicio with data [Leitstudies 2011, RTE 2015, EPEX SPOT 2014, EPEX SPOT 2013] 41H2BCase by HINICIO: Optimising and
simulating your hydrogen supply chain
Techno-economic database of Energy markets Local data
hydrogen technologies
• Production • Electricity spot price • H2 Demand
• Conditioning • Balancing market • Gas grid
• Storage • Capacity market • Electricity grid
• Logistics • Natural gas market • Road access
• HRS • Carbon tax • Distances
• Vehicles
H2BCase All configurations
by • centralised
• Semi-centralised
• On-site
System sizing optimum System operation Economics and finance
• Production • Production • CAPEX
• Conditioning • Conditioning • OPEX
• Storage • Storage • Revenues
• Logistics • Logistics • Cash flow
• HRS • HRS • IRR, NPV
• P&L
Images: Hinicio H2BCase model 4212 scenarios assessed
Scenario
Parameter
1 - Ref 2 3 4 5 6 7 8 9 10 11 12
Country France Germany
Year of electrolyser
2015 2020 2030 2030
commissioning
No H2
Initial/Final H2 Mobility 100/ 100/
100/325 mobilit
demand (kg/d) 163 163
y sales
26% 100% of 17% of
Electricity price France Germ. Germ. Germ. of wind wind wind
duration curve or cost 2014 2014 2020 2030 el. Cost el. cost el. Cost
France France Germ.
France
Grid charge Germany 2015 rates
2015
Electr.-
CSPE (€/MWh) int. 19.5
0.5
H2 injection price No No
90 (FIT) 55.8 55.8
(€/MWh) inject. inject
Electrolyser capex
1,9 0.55 0.55
(M €/ MW)
Electrolyser
75%/ 75%/
efficiency/stack 66%/4y
10y 10y
lifetime
Table: Hinicio 43Scenario 1 - Reference - Hypotheses
• H2Mobility market consumes 1/3 of electrolyser
capacity in year 1 (1MW electrolyser – 100
kg/day – 100 FCEV/REX or 4 busses) and
increases to full electrolyser capacity in year 10.
• Electrolyser plant considered to be benefiting
from “electro intensif” regime (low grid / tax
fees).
• Available capacity permitting, H2 is produced
for injection into the Gas Grid when marginal
costs of H2 production are lower than Feed-In-
Tariff (assuming €90/ MWh) to achieve increase
revenue streams during market take-off phase of
FCEV.
• No charges applied to the electricity consumed
for producing the hydrogen injected into the gas
Table: Hinicio
grid
44Representation of Results per Scenario (1)
Revenues:
1. H2Mobility: €8 / kg @ 200
bar @ HRS
2. H2 injected @FIT:
€90/MWh
Source: Hinicio 2016
3. Primary reserve:
€18/MW/h
Figure: Hinicio, H2BCase Model 45Representation of Results per Scenario (2)
Variable Costs:
1. H2Mobility: variable
Electricity costs & water
costs
Source: Hinicio 2016
2. H2Mobility: variable cost of
trailer transport (€1/km and
€45/hr)
3. Injection: variable electricity
costs & water costs
Figure: Hinicio, H2BCase Model 46Representation of Results per Scenario (3)
Fixed Costs:
1. H2 Mobility: electrolyser
O&M (3% +3% of CAPEX) &
Fixed part of Grid fee &
Trailer & Storage @ HRS O&M
2. Injection: Electrolyser O&M
Source: Hinicio 2016
(3% +3% of CAPEX) & Fixed
part of Grid fee
3. Depreciation of Electrolyser
+ Stack Replacement +
Compressor & Injection Skid
4. Depreciations of Trailer &
Storage @ HRS 47
Figure: Hinicio, H2BCase ModelScenario 1 - Reference - Results
1 MW semi-central Power-to-H2 system - Revenues and Costs
(CAPEX depreciated)
1.400
1.200 Log. annualized capex
Prod annualized capex
1.000
Injection fixed costs
Source: Hinicio 2016
800 Market fixed costs IRR = 0% (10y)
k€/y
Injection var.cost
600 Market var. log. costs Payback = 10
400
Market var. prod.cost years
H2 GoO's
200 Grid services
Injection sales
0
Market sales
2015 2016 2017 2018 2019 2020 2021 2022 2023 2024
Year
Injection into the Gas Grid complement revenue streams during “valley of
death” of FCEV market. Its contribution to margin decreases as hydrogen
mobility market takes off.
Figure: Hinicio, H2BCase Model 48Injection provides risk coverage against lower
than expected hydrogen sales
700
Log. annualized capex
S2: low H2 Mob Market Take-
600
Prod annualized capex
500 Injection fixed costs
Off With injection
Market fixed costs
Source: Hinicio 2016
400
Injection var.cost
k€/y
300 Market var. log. costs IRR = -2% (10y)
Market var. prod.cost
200
H2 GoO's Payback = 11 years
100
Grid services
0 Injection sales
2015 2016 2017 2018 2019 2020 2021 2022 2023 2024
Market sales
Year
700
S9: low H2 Mob Market Take-
Log. annualized capex
600
Prod annualized capex
Off Without injection
500 Injection fixed costs
Source: Hinicio 2016
Market fixed costs
400 IRR = -12%
Injection var.cost
k€/y
300 Market var. log. costs
Payback = 19 years
Market var. prod.cost
200
H2 GoO's
100 Grid services
Injection sales
0
2015 2016 2017 2018 2019 2020 2021 2022 2023 2024 Market sales
49
Year
Figures: Hinicio, H2BCase ModelScenario 3 - Germany 2015 - Hypotheses
Parameter
1 - Ref 2 3 4 5
Country France Germany
Year of electrolyser
2015 2020 2030
commissioning
Initial/Final H2 Mobility 100/
100/325
demand (kg/d) 163
Electricity price France Germ. Germ. Germ.
duration curve or cost 2014 2014 2020 2030
France
Grid charge Germany 2015 rates
2015
Electr.-
CSPE (€/MWh) int.
0.5
H2 injection price
90 (FIT) 55.8
(€/MWh)
Electrolyser capex
1,9 0.55
(M €/ MW)
Electrolyser
75%/
efficiency/stack 66%/4y
10y
lifetime
50
Figures and Table: Hinicio, based on data [EPEX SPOT 2013, Germany]Scenario 3 – Germany 2015 - Results
German electricity market conditions : Revenues and Costs
1.400
1.200 Log. annualized capex
Prod annualized capex
1.000
Injection fixed costs
Market fixed costs
Source: Hinicio 2015
800
k€/y
Injection var.cost
600 Market var. log. costs
400
Market var. prod.cost
H2 GoO's
200 Grid services
Injection sales
0
2015 2016 2017 2018 2019 2020 2021 2022 2023 2024 Market sales
Year
IRR = -28% (10y)
Payback = N/A
Figure: Hinicio, H2BCase Model 51Scenario 11 – France 2030 - Hypotheses
11
2030
• Upfront purchase of the
production of renewable
generation capacity at
projected full cost
100% of
wind
el. cost • Electrolyser technology of 2030
France
55.8
0.55
75%/
10y
Table: Hinicio 52Scenario 11 – France 2030 - Results
1.400
1.200
Log. annualized
capex
1.000
Prod annualized
capex
Injection fixed
800 costs
k€/y
Market fixed costs
Source: Hinicio 2015
600 Injection var.cost
Market var. log.
400 costs
Market var.
prod.cost
200 H2 GoO's
Grid services
0
Injection sales
2015 2016 2017 2018 2019 2020 2021 2022 2023 2024
Year
IRR = 0% (10y)
Payback = 10 years
Figure: Hinicio, H2BCase Model 53Based on the marginal cost based priced
duration curve considered for 2030, the Power-to-
Gas application would break even
1.200
S5: German Electricity Prices &
Electrolyser Performance 2030
1.000 Log. annualized capex
Prod annualized capex
800 Injection fixed costs
Market fixed costs
Source: Hinicio 2015
IRR = 0% (10y)
k€/y
600 Injection var.cost
Market var. log. costs
400 Market var. prod.cost
Payback = 10 years
H2 GoO's
200 Grid services
Injection sales
0 Market sales
2030 2031 2032 2033 2034 2035 2036 2037 2038 2039
Year
1.400
S3: German Electricity prices
1.200 Log. annualized capex
Prod annualized capex
1.000
Injection fixed costs
800 Market fixed costs IRR = -28%
Source: Hinicio 2015
2014
k€/y
Injection var.cost
600 Market var. log. costs Payback = N/A
Market var. prod.cost
400
H2 GoO's
Grid services
200
Injection sales
0 Market sales
2015 2016 2017 2018 2019 2020 2021 2022 2023 2024
Year 54
Figures: Hinicio, H2BCase ModelResults of Scenario analysis
1
Scenario Nbr 2 3 4 5 6 7 8 9 10 11 12
(Ref)
Count ry France Germany
Y ear of elect rolyser
2015 2020 2030 2030
commissioning
Init ial/Final H2 100/325 100/163 No H2
Mobilit y demand (50+50/(70+ mobilit y 100/163
(kg/d) (50+50 / 93) sales
140+185)
100%
26% of 17% of
Elect ricit y price of
France Germ. Germ. Germ. w ind el. wind
durat ion curve or wind
2020 Cost el. Cost
cost el. cost
2014 2014 2030 France France Germ.
France
Grid charge Germany 2015 rat es
2015
Elect r.-int .
CSPE (€/MWh) 19.5
0.5
H2 inject ion price
90 (FIT) 55,8 No inject . No inject 55,8
(€/MWh)
Elect rolyser capex
1,9 0,55 0,55
(M €/ MW)
Elect rolyser
75%/10
efficiency/st ack 66%/4y 75%/10y
y
lifet ime
IRR aft er 10 years 0% -2% -28% 0% -5% N/A -3% -12% 0% 0% 0%
1st Y ear EBIT > 0 Y ear 4 Y ear 2 N/A Y ear 3 Y ear 5 N/A year 5 year 13 year 4 Y ear 5 year 3
10 10
Payback Period 10 years 11 years N/A 10 years 12 years N/A 11 years 19 years 9 years
years years
Primary
Alt ernat ive 1 t o €8.4/Kg H2 €9.5/Kg H2 €9.0/Kg €8.5/Kg H2 €11/kg H2
Reserve @
achieve IRR = 0% Mob Mob H2 Mob Mob Mob
45.5/MW/h
FIT @ FIT @ Primary Primary
Alt ernat ive 2 t o FIT €109 FIT @ €190
€121 €133.5 Reserve @ Reserve @
achieve IRR = 0% MWh MWh
MWh MWh €27/MW/h €70/MW/h
55
Table: Hinicio, H2BCase ModelConclusions
• Assuming a certain number of favourable regulatory conditions, achieving
economic balance seems feasible for short-term deployments in France;
therefore, with some further support, for instance in the form of investment
subsidies, such deployments could attract private investment.
• The French fee regime applied as assumed above, would be particularly
favourable for Power-to-gas. In contrast, the grid fee regime currently applied
in Germany handicaps Power-to-gas.
• Injection into the natural gas grid can generate two complementary revenue
streams – from sales to the gas grid, and from services to the power grid
performed when hydrogen is produced– which reduces exposure to
uncertainty of revenues from the hydrogen market.
• An economic balance could potentially be achieved in both market
environments and without public financial support by 2030 thanks to
technological improvements.
56Recommendations
• Create a feed-in tariff for the injection of green or low-carbon hydrogen into
the natural gas grid of a level comparable to that of biomethane in France;
• In France, grant the hyperélectro-intensif status to hydrogen power-to-gas
production;
• In Germany, provide similar tax, EEG appropriation, and grid fee benefits to
hydrogen production by electrolysis as the hyperélectro-intensif status;
• In Europe, further develop sustainability criteria, certification procedures and
accountability of green or low-carbon hydrogen towards EU targets, especially
with regard to the EU Renewable Energies Directive (RED) and the EU Fuel
Quality Directive (FQD);
• Exempt electricity used to produce green or low-carbon hydrogen injected
into the natural gas grid from grid fees and energy taxes;
• Financially support the implementation of supplying hydrogen to fuel cell
electric vehicles.
57Acknowledgment
Hinicio and LBST would like to thank Fondation Tuck for
supporting this study under its The Future of Energy programme
58You can also read