Der Leitzins und die Zinsen auf dem Girokonto - Konversatorium "Berufsbild Mathematik (Finanzmathematik in der Praxis)" - Andreas Németh Wien, am ...
←
→
Page content transcription
If your browser does not render page correctly, please read the page content below

Der Leitzins und die Zinsen auf dem Girokonto
Konversatorium "Berufsbild Mathematik (Finanzmathematik in der Praxis)"

                                              Andreas Németh

Wien, am 06. Juni 2018

                                                                          © d-fine
                                                                              © d-fine
                                                                                   — All—rights
                                                                                           All rights
                                                                                                 reserved
                                                                                                      reserved
                                                                                                           | 0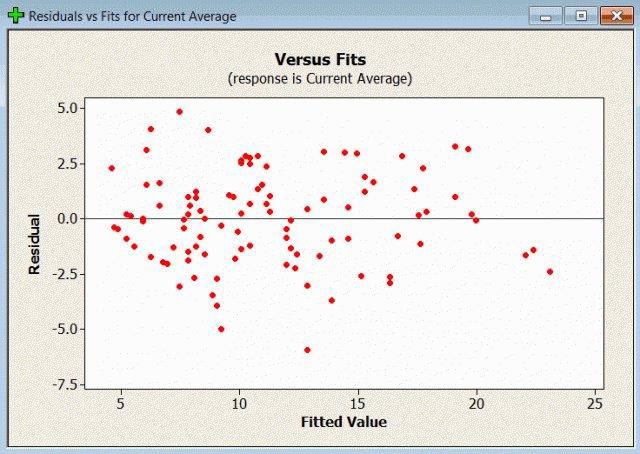
Definitions

Account types
» A savings account is a deposit account held at a retail bank that pays interest but cannot be used directly
  as money in the narrow sense of a medium of exchange. A time deposit is a bank deposit account that has
  a specified date of maturity and usually earns a fixed interest. Money cannot be withdrawn before the
  maturity date (unless a penalty is paid). When the time deposit expires, it can be withdrawn or it can be
  renewed for another term (subject to new interest rates).
» The opposite, sometimes known as a sight deposit or "on call" deposit, can be withdrawn at any time,
  without any notice or penalty, e.g. a current account held at a bank. In economic terms, the funds held in a
  sight deposit are regarded as liquid funds and in accounting terms they are considered as cash.
Liquidity
» Market liquidity is a market's feature whereby an individual or firm can quickly purchase or sell an asset
  without causing a drastic change in the asset's price. Money, or cash, is the most liquid asset, because it
  can be "sold" for goods and services instantly with no loss of value.
» In the case of sight deposits the bank faces funding liquidity risk, the risk that liabilities cannot be met
  when they fall due, i.e. when the customer wants to withdraw their funds.
» As sight deposits do not have a contractual maturity, the bank needs to dispose of a clear understanding of
  their duration level within the banking books.
Replication
» In such models one attempts to find the optimal portfolio of investments (replication portfolio), which, if
  being refinanced by a particular product to be analyzed, best fits a set of well defined interest rate risk and/or
  liquidity risk criteria.
Source of Definitions: Wikipedia

   2018-06-06 | Der Leitzins und die Zinsen auf dem Girokonto                                © d-fine
                                                                                                 © d-fine
                                                                                                      — All—rights
                                                                                                              All rights
                                                                                                                    reserved
                                                                                                                         reserved
                                                                                                                              | 1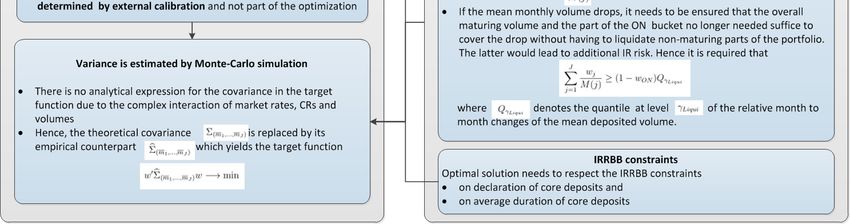
Function of Interest Rate Replication Models

» Bank pays Client Rate for deposits of undetermined maturity (current and savings accounts)

» Bank invests the deposits into maturity buckets between 3M and 10Y with fixed bucket weights in
   monthly time steps

» IR replication model optimizes the investment weights of the buckets aiming to

   1.     generate stable margins between investment rate and client rate

   2.     provide sufficient liquidity for buffering volume changes by means of maturing investments
          Note: Liquidation of non-maturing investments would create IR risk

                                                              Client Rates

                                                              Optimization

                                  Market Rates                                 Deposited Volumes

    IR replication models mitigate IR and liquidity risk by optimization of the investment portfolio

 2018-06-06 | Der Leitzins und die Zinsen auf dem Girokonto                                    © d-fine
                                                                                                   © d-fine
                                                                                                        — All—rights
                                                                                                                All rights
                                                                                                                      reserved
                                                                                                                           reserved
                                                                                                                                | 2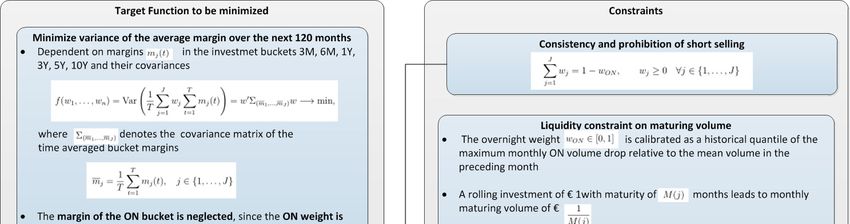
Function of the Interest Rate Replication Model

» The IR replication model determines optimal rolling investment portfolios for deposits with
   undetermined maturity such as current and savings accounts

» The optimization output are investment weights for a set of maturity buckets between 3 months and 10
   years

» Weights are determined separately for the savings, commercial, and current accounts

» The optimization aims to selects investment weights that

   1.     generate stable margins between investment and client rate

   2.     provide sufficient liquidity to buffer volume changes by means of maturing investments
» Technically, the optimization

   ›    minimizes the variance of the mean margin on a 10 year forward looking horizon over a set of
        10,000 hypothetical scenarios

   ›    Imposes constraints on the maturing volume to provide liquidity for coverage of volume changes

» The model does not optimize the expected margin

    The IR replication model mitigates IR and liquidity risk by optimization of the investment portfolio

 2018-06-06 | Der Leitzins und die Zinsen auf dem Girokonto                                  © d-fine
                                                                                                 © d-fine
                                                                                                      — All—rights
                                                                                                              All rights
                                                                                                                    reserved
                                                                                                                         reserved
                                                                                                                              | 3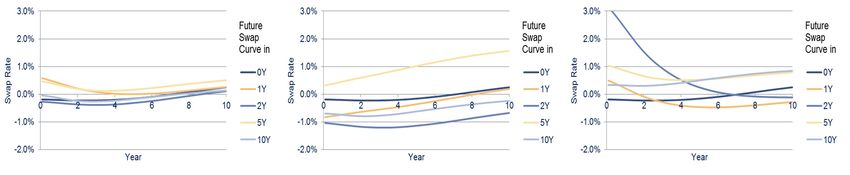
Challenge: Complex network of dependencies have to be understood and
managed comprehensively

Sample (sub-)path for the effect from interest rate replication model on the balance sheet composition:

                                             Expenses                                          Profitability
                                                                           P&L
                                               Earnings
                 Growth
                                                 Off-balance
                                                  positions                       Cash flow        Capital
                                                                                                                           Rating /
      Balance sheet                                                                                                        Solvency
        positions                           Balance sheet
                                                                     Derivative     Downside
                                                                                      Risk
                                                     Hedge                                                     Investor
                           Optionalities                                                                        opinion

                 Risk                                                             Cash flow      External funding
                                                              Liquidity
                                                               levels
                                                                            Investment
                                     Liquidity risk                                                        Based on: Managing Liquidity in Banks,
                                                                           opportunities                   R. Duttweiler, 2009

    Analysis paths is key               Systems and processes to analyze new pathways in a short time frame

 2018-06-06 | Der Leitzins und die Zinsen auf dem Girokonto                                                      © d-fine
                                                                                                                     © d-fine
                                                                                                                          — All—rights
                                                                                                                                  All rights
                                                                                                                                        reserved
                                                                                                                                             reserved
                                                                                                                                                  | 4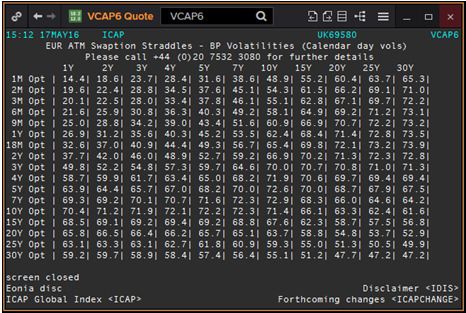
The development of a scenario model should be focussed on the essential
value drivers initially neglecting driver interactions

      Products /                    Market
A                         B                                              “The Model”                                   Plan / Forecast
      Positions                   parameters
                                                                                                          Analysis of effect of input factor variations
                                                                       FTP                                on resulting (time dependent) figures
                                                                                  Tax effects
                                                                                                          » Single deals
                                                                     Accounting Rules                     » Market environment
                                                                                                          » Modell assumptions
       Model                         Time                                       Products
C    parameters
                          D       dependence                                                                                        Liquidity profile
                                  Time dep.                           Pricing Engine
      » Assumptions               parameters
      » Correlations              New business                                 Cash Flows
                                  assumptions,         “flow” of
      » Sensitivities             etc.               information                                                                                          t

                        Product    Coupling   Coupling
                                                            The development of a scenario model should consider
                           A         A+B       A+C          materiality:
                                  Business
                                  Segment
                                           Coupling          » Focus on primary and direct effects (diagonal)
                                            B+C
                                     B
                                              Portfolio
                                                             » Secondary effects and interactions/correlations of value drivers
                                               Desk            should be considered subsequently (secondary diagonals)
                                                 C

    In its core, simple scenario driven model mechanics, however handling of complex correlations between
    model parameters needed

 2018-06-06 | Der Leitzins und die Zinsen auf dem Girokonto                                                              © d-fine
                                                                                                                             © d-fine
                                                                                                                                  — All—rights
                                                                                                                                          All rights
                                                                                                                                                reserved
                                                                                                                                                     reserved
                                                                                                                                                          | 5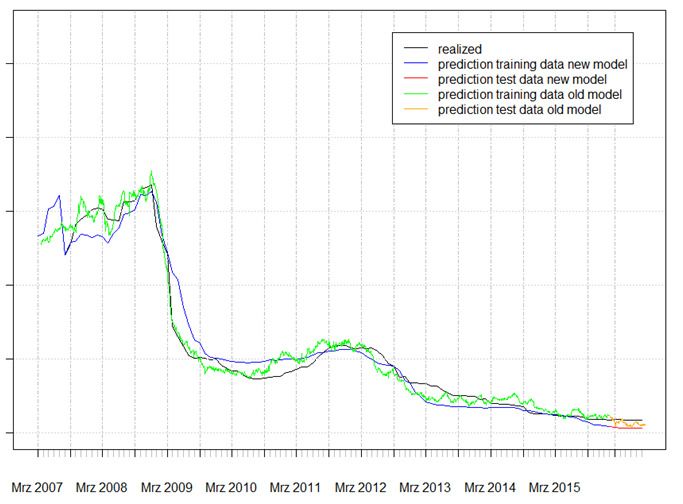
Implementation: comprehensive bank management by a central data hub
including raw data, calculation engines and result data aggregation

                                               Business perspectives / reports                     Vision
   Internal reporting,
  regulatory reporting,                                                                            » Deliver all data and functions
  accounting, financial                                                                              (risk types, accounting, reg.
       controlling                                                                                   reporting etc.) out of one
                                                                                                     harmonized source
                                                        Outbound logic and aggregation
 Goal:                                                                                             » Provide different perspectives
                                                                      Results                        on the same data
 Business data hub in a
 sustainable and source                                                                            » Establish common taxonomies
 system independent                                                                                  in order to achieve consistent
 structure in order to provide                                                                       reporting across risk types
 common consistent                                                                       Engines
 calculation and reporting logic                                                                   » Enable integrated (stress)
                                                        Raw Data
 for all business users                                                                              scenario evaluation across
                                                              Integration / DQM                      risk types
                                                                                                   » Avoid individual data sourcing
                                                                                                     and source system dependent
  System landscape,                                                                                  business logic across the
 products, processes,
                                                                                                     departments
    group structure
                                                        Source systems (Front Office,              » Create transparency through
                                                        supplementary data, ledgerN)                 central function architecture

2018-06-06 | Der Leitzins und die Zinsen auf dem Girokonto                                                   © d-fine
                                                                                                                 © d-fine
                                                                                                                      — All—rights
                                                                                                                              All rights
                                                                                                                                    reserved
                                                                                                                                         reserved
                                                                                                                                              | 6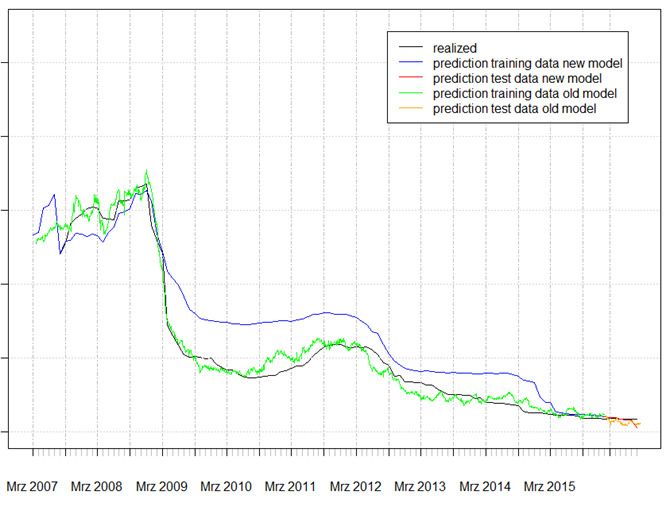
First Step: Linear Regression

2018-06-06 | Der Leitzins und die Zinsen auf dem Girokonto | First Step: Linear Regression   © d-fine
                                                                                                 © d-fine
                                                                                                      — All—rights
                                                                                                              All rights
                                                                                                                    reserved
                                                                                                                         reserved
                                                                                                                              | 7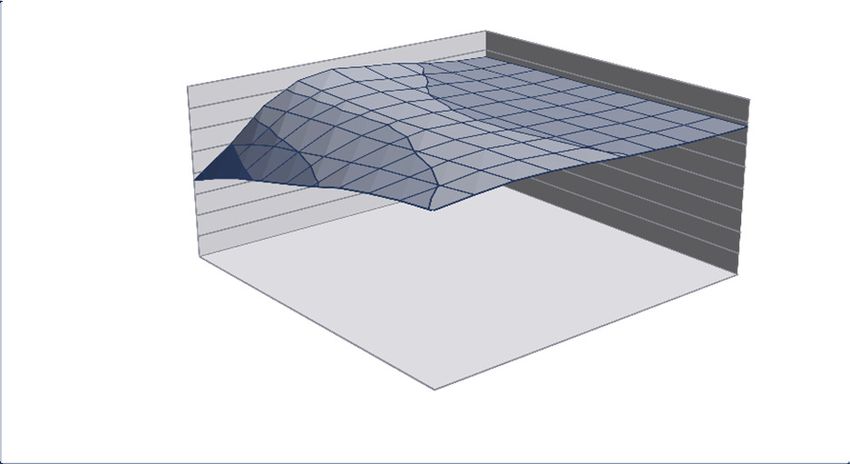
Linear Regression to forecast Client Rates
  Approach

              Fitting of a linear regression model                                                                      Forecasted
                                                                            Application of fitted linear
              Dependent variable: TS of CRs                                                                            Client Rate per
                                                                              model to simulated
                                                                                                                          market IR
              Explanatory variables: TS of IRs                                market IR scenarios
                                                                                                                           scenario

                                          Market IR of bucket j                                         Market IR with time lag
                                          (e.g. Euribor 6M) in
  Model

                                          scenario i at time t

                Client Rate in
                                               c, =α +                  r, +                 r          +          r         +ε,
                                                                                                                                          Noise
                scenario i at time t                                                                ,                    ,

             » {ε , } independent with Var(ε , ) < ∞ ⇒ LSE for {                          } unbiased and consistent
Assump-

             » {ε , } homoskedastic (same variance) ⇒ LSE has minimum variance
 tions

             » {ε , } independent and normally distr. ⇒ Validity of standard statistical tests for the significance of
               the linear relationship (F-Test) and single explanatory variables α (t-Test).

 2018-06-06 | Der Leitzins und die Zinsen auf dem Girokonto | First Step: Linear Regression (1/4)                                  © d-fine
                                                                                                                                       © d-fine
                                                                                                                                            — All—rights
                                                                                                                                                    All rights
                                                                                                                                                          reserved
                                                                                                                                                               reserved
                                                                                                                                                                    | 8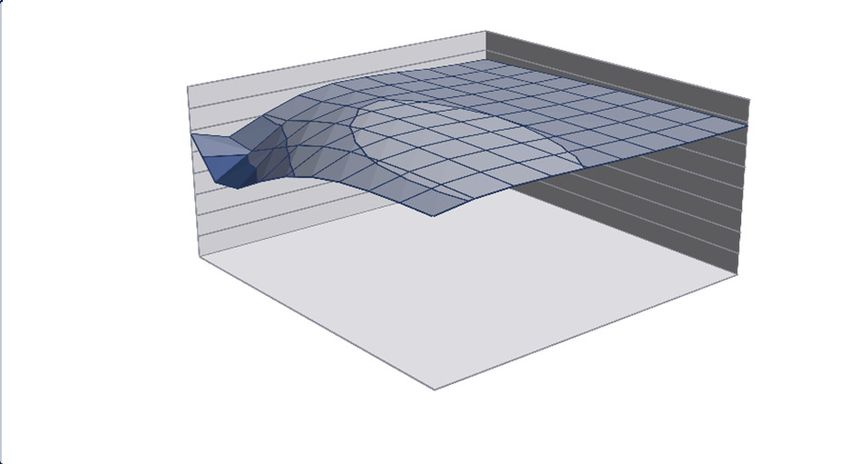
Analysis of Linear Regression Approach

» Very high autocorrelation of the regression residuals indicates spurious regression, i.e. the model may
  assume a functional relationship without economic validity
                                      Autocorrelation

                               ------ significance level of
                               autocorrelation function

» Consequence: standard significance tests for a good model-fit are not valid
» This is also true for the regression constants
» A high significance of the t-tests has therefore no value

    The model for Client Rates should hence be based on uncorrelated data

 2018-06-06 | Der Leitzins und die Zinsen auf dem Girokonto | First Step: Linear Regression (2/4)   © d-fine
                                                                                                        © d-fine
                                                                                                             — All—rights
                                                                                                                     All rights
                                                                                                                           reserved
                                                                                                                                reserved
                                                                                                                                     | 9
Linear Regression to forecast Client Rates
Approach
Fitting of a linear regression model Forecasted
Application of fitted linear
Dependent variable: TS of CRs Client Rate per
model to simulated
market IR
Explanatory variables: TS of IRs market IR scenarios
scenario
Market IR of bucket j Market IR with time lag
(e.g. Euribor 6M) in
Model
scenario i at time t
Client Rate in
c, =α + r, + r + r +ε,
Noise
scenario i at time t , ,
» {ε , } independent with Var(ε , ) < ∞ ⇒ LSE for { } unbiased and consistent
Assump-
» {ε , } homoskedastic (same variance) ⇒ LSE has minimum variance
tions
» {ε , } independent and normally distr. ⇒ Validity of standard statistical tests for the significance of
the linear relationship (F-Test) and single explanatory variables α (t-Test).
2018-06-06 | Der Leitzins und die Zinsen auf dem Girokonto | First Step: Linear Regression (3/4) © d-fine
© d-fine
— All —
rights
All rights
reserved
reserved
| 10Spurious Regression and Consequences for Prediction Quality
» Does the model work for prediction anyway?
› No!
› Too many explanatory autocorrelated market IR time series cause overfitting since they act like a set
of basis functions.
» Consequences of overfitting:
› Almost perfect fit for training data
› Risk of a drastic loss in prediction quality after structural disruptions of the market
› Example: Shift from normal to low IR regime
modeling goals: reduce overfitting and increase robustness of predictions under structural market changes
2018-06-06 | Der Leitzins und die Zinsen auf dem Girokonto | First Step: Linear Regression (4/4) © d-fine
© d-fine
— All —
rights
All rights
reserved
reserved
| 11Fixing the Regression: Analyzing Returns
2018-06-06 | Der Leitzins und die Zinsen auf dem Girokonto | Fixing the Regression: Analyzing Returns © d-fine
© d-fine
— All —
rights
All rights
reserved
reserved
| 12Correlation Analysis of Returns
» Autocorrelation of returns found to be very small for Client Rates, Volumes as well as Market IRs
» Return-based regression models are therefore not prone to spurious regression
» Statistical tests can therefore be used to assess model validity
» Variable Selection
1. Correlation analysis of returns identifies products where return-based regression models may
succeed in forecasting Client Rates and/or Volumes based on market IRs
2. Backward elimination identifies a „parsimonious Model“ to avoid overfitting
Results of Correlation Analysis
Significant Not Significant Significant
Volume
vs. CR
CR current
CR savings
accounts
&
Volume retail & basis
commercial
vs. IR savings
accounts vs.
Market vs. Market
Market IR
IR IR
"
2018-06-06 | Der Leitzins und die Zinsen auf dem Girokonto | Fixing the Regression: Analyzing Returns (1/8) © d-fine
© d-fine
— All —
rights
All rights
reserved
reserved
| 13Grouping of Modeling Approaches for Forecasting
CRs IR
sensitive insensitive
to market CRs
IRs
Volumes
SARIMA models and Plan Figures
Forecasts are based on three basic model types
2018-06-06 | Der Leitzins und die Zinsen auf dem Girokonto | Fixing the Regression: Analyzing Returns (2/8) © d-fine
© d-fine
— All —
rights
All rights
reserved
reserved
| 14Return-based regression model
» Linear model for returns
Δc , = c , −c , =α + (r %*+ , −r %*+ , )+ε ,
» This yields the estimators
Δc# , = # + ∑ (r# %*+ , −.̂ %*+ , ),
where r# , denotes the simulated market IR of maturity bucket j at time t in the i-th scenario.
» Forecast:
c# , = max{c$%&&' , c# , + Δc# , }, t>0
c# , ≔ c (real observed starting Client Rate)
» Floor-Parameter c$%&&' applies to all retail products, set by management decision within legal bounds
Drawbacks
» Misprediction of single returns may lead to sustainable bias in CR levels with very slow decay
» Model does not account for the market tending to keep the spread between CR and market IRs at
historically observed levels
» Introduction of a jump component was able to reduce these shortcomings
2018-06-06 | Der Leitzins und die Zinsen auf dem Girokonto | Fixing the Regression: Analyzing Returns (3/8) © d-fine
© d-fine
— All —
rights
All rights
reserved
reserved
| 15Fitting Results for Pure Return-Based Regression Models
Drawbacks
» Misprediction of single returns may lead to sustainable bias in CR levels with very slow decay
» Model does not account for the market tending to keep the spread between CR and market IRs at
historically observed levels
» Introduction of a jump component was able to reduce these shortcomings
2018-06-06 | Der Leitzins und die Zinsen auf dem Girokonto | Fixing the Regression: Analyzing Returns (4/8) © d-fine
© d-fine
— All —
rights
All rights
reserved
reserved
| 16Return-Based Regression Models: Design of the Jump Component
» Compute cumulated margin between intersections of
CR and a historical reference CR after shift by mean
margin
» Determine max and min cumulated margins 01 2 >0
(for IR>CR) und 0156 < 0 (for IRIR, a downshift occurs with probability
89 7, : = ; ⋅ 05 (7)/0156 and size 89 r# , 7 − c# , r# , 7 − c# , >0
Model parameters ? and ;∈ 0,1 controlling jump-behavior are calibrated via Least-Squares-Minimization
2018-06-06 | Der Leitzins und die Zinsen auf dem Girokonto | Fixing the Regression: Analyzing Returns (5/8) © d-fine
© d-fine
— All —
rights
All rights
reserved
reserved
| 17Fitting Results: CR Forecast by Return-Based Regression with Jumps
Without Jump Correction With Jump Correction
Jump Component keeps margin at historically observed levels and corrects forecasts for level errors
2018-06-06 | Der Leitzins und die Zinsen auf dem Girokonto | Fixing the Regression: Analyzing Returns (6/8) © d-fine
© d-fine
— All —
rights
All rights
reserved
reserved
| 18Macro State Model
» Modeling Client Rates with infrequent adjustments:
› CRs for new accounts are set by the bank to few fixed levels (called macro states)
› CR changes only affect new accounts and and propagate slowly
Macro-State Model
Two modeling approaches capture diverse product-specific behavior of CRs
2018-06-06 | Der Leitzins und die Zinsen auf dem Girokonto | Fixing the Regression: Analyzing Returns (7/8) © d-fine
© d-fine
— All —
rights
All rights
reserved
reserved
| 19The Model for Client Rates
Return-Based Regression Models and
Direct Regression Model
Macro State Model
Basic assumption Basic assumptions
» CR is a linear combination of market IR curves » IR-sensitive CRs:
» Statistical validity of regression approach relies › CR returns are a linear combination of
on uncorrelated input data market IR returns
(This is severely violated by the data) › the bank tries to adjust spreads between
Model parameters CR and market IR to the historically
observed levels
» (time lagged) market IR time series
Model
» CRs with infrequent adjustments:
Evolution
› CRs for new accounts are set by the bank
to few fixed levels (called macro states)
› CR changes only affect new accounts and
propagate slowly
Calibration Calibration
» Least Squares » Least Squares Calibration
Scenario generation Scenario generation
» Apply regression model to simulated market IRs » Apply model to simulated returns of market IRs
For CRs with significant correlations to IR returns, return-based regression models avoid the pitfalls of
spurious regression. Alternative modeling approaches cover products without significant correlations.
2018-06-06 | Der Leitzins und die Zinsen auf dem Girokonto | Fixing the Regression: Analyzing Returns (8/8) © d-fine
© d-fine
— All —
rights
All rights
reserved
reserved
| 20Modeling Deposit Volumes
2018-06-06 | Der Leitzins und die Zinsen auf dem Girokonto | Modeling Deposit Volumes © d-fine
© d-fine
— All —
rights
All rights
reserved
reserved
| 21Deposit Volume Modeling
Basic observations
» Deposit volumes show a significant trend component (can usually be steered by the bank)
» Deposit volumes show an inter-month seasonal pattern, e.g. pre-holiday season gain, new year drop, N
» Current accounts also have a distinct intra-month pattern, i.e. pay-day and consecutive draw-downs
Observations from calculating correlations
» No correlation to Client Rates discernible, i.e. clients seem to be insensitive to rate changes
(this clearly just holds within bounds and in the current interest rate environment)
» No correlation to market rates discernible, i.e. clients do not change their saving behavior based on the
interest rate environment
(this should also be taken with a large grain of salt)
Calibration and scenario generation
» Detrend the historical time series
» Fit a SARIMA time series model to the detrended data
» Take trend from plan figures (constant extrapolation beyond planning horizon)
» Simulate seasonal component via time series model
» Add residuals by bootstrapping from the historical data
Volume forecasts can be based on SARIMA model, but assumptions should be re-evaluated carefully from
time to time!
2018-06-06 | Der Leitzins und die Zinsen auf dem Girokonto | Modeling Deposit Volumes (1/3) © d-fine
© d-fine
— All —
rights
All rights
reserved
reserved
| 22Deposit Volume Forecast
Model for constant plan figures Model for increasing plan figures with constant
extrapolation beyond the planning horizon
Single model type captures diverse landscape of volume trajectories.
2018-06-06 | Der Leitzins und die Zinsen auf dem Girokonto | Modeling Deposit Volumes (2/3) © d-fine
© d-fine
— All —
rights
All rights
reserved
reserved
| 23Volume Prediction: Combining Plan Figures with Time Series Modeling
Seasonal Time Series Model with Plan
Direct Regression Model
Figures for Trend
Basic assumption Basic assumptions
» Volume is a linear combination of market IR » Volume trends develop according to plan figures
curves and CR
» Inter-Month fluctuations can be captured by a
(This assumption is not supported by the data) seasonal time series model
» Statistical validity of regression approach relies » Future fluctuations are similar to historically
on uncorrelated input data.
observed client behavior
(This assumption is severely violated by the data)
Calibration
Model parameters Model
Evolution » Detrend the historical time series
» (time lagged) market IR time series
» Fit a SARIMA time series model to the detrended
» CR data
Scenario generation
Calibration » Take trend from plan figures (constant
» Least squares calibration on historical data extrapolation beyond planning horizon)
Scenario generation » Simulate seasonal component via time series
» Apply regression model to simulated market IRs model
and CR prediction » Add residuals by bootstrapping from the historical
data
Liquidity risk due to volume drops can be captured by classical time series models. Replacing the trend
component by plan figures yields replication portfolios that are consistent with the plan.
2018-06-06 | Der Leitzins und die Zinsen auf dem Girokonto | Modeling Deposit Volumes (3/3) © d-fine
© d-fine
— All —
rights
All rights
reserved
reserved
| 24Interest Rate Scenario Generation
2018-06-06 | Der Leitzins und die Zinsen auf dem Girokonto | Interest Rate Scenario Generation © d-fine
© d-fine
— All —
rights
All rights
reserved
reserved
| 25The Hull-White 2 Factor Model
» The Hull-White 2 factor model is a so called short-rate model. This model class models only
the very front end of the yield curve
» It uses two stochastic processes A 7 and B 7 to model the short rate
. 7 =A 7 +B 7 +C 7 , . 0 =.
» C 7 assures that the initial term structure of the yield curve is matched
» The dynamics of the two stochastic processes A 7 and B 7 are described by the following
stochastic differential equations (SDEs)
;A 7 = −D ∙ A 7 ;7 + F;G 7 , A 0 =0
;B 7 = −H ∙ B 7 ;7 + I;G 7 , B 0 =0
;G 7 ;G 7 = ";7
» Hence, the level and shape of the yield curve at any future date is completely determined by
two stochastic quantities
2018-06-06 | Der Leitzins und die Zinsen auf dem Girokonto | Interest Rate Scenario Generation (1/4) © d-fine
© d-fine
— All —
rights
All rights
reserved
reserved
| 26Calibration of the Hull-White 2 Factor Model
» The five free parameters D, H, F, I, " are set by fitting the model to ATM swaption volatilities
» Set of benchmark instruments: [1Y,2Y, 3YN10Y] x [1Y,2Y, 3YN10Y] swaptions
» Use of vega-weighting improves stability and puts focus on long end of yield curve
20%
18% 20.0%
17.5%
2Y 15.0%
16% 12.5%
Market 5Y 10.0%
7.5%
14% 10Y 5.0%
implied 2.5%
0.0%
12% Swap
volatilities
1Y
3Y
10% 9Y
5Y
Tenor 7Y
7Y
1Y 2Y 3Y 4Y 5Y 6Y 7Y 8Y 9Y 10Y 5Y
3Y Expiry
9Y
Expiry
1Y
20%
18% 20.0%
17.5%
2Y 15.0%
Model 16%
5Y
12.5%
10.0%
7.5%
implied 14% 10Y 5.0%
2.5%
volatilities 12% Swap 0.0%
1Y
3Y
10% 9Y
5Y
Tenor 7Y
7Y
1Y 2Y 3Y 4Y 5Y 6Y 7Y 8Y 9Y 10Y 5Y
3Y Expiry
9Y
Expiry
1Y
2018-06-06 | Der Leitzins und die Zinsen auf dem Girokonto | Interest Rate Scenario Generation (2/4) © d-fine
© d-fine
— All —
rights
All rights
reserved
reserved
| 27Yield curve scenario generation using the Hull-White 2 factor model
Steps required
Transformation
into correlated, Calculation of Calculation of
Calculation of
Generation of normally A 7 and y 7 yield curves
distributed discount
random by applying (zero and swap
factors using
numbers numbers for Euler‘s method rates for future
HW2F model
;G 7 and to SDEs spot dates)
;G 7
Exemplary scenarios
Simulation covers a variety of normally distributed scenarios
2018-06-06 | Der Leitzins und die Zinsen auf dem Girokonto | Interest Rate Scenario Generation (3/4) © d-fine
© d-fine
— All —
rights
All rights
reserved
reserved
| 28New process and model yields robust calibration and scenario generation
Market data input from 2-Factor Hull White Scenario generation in
Reuters to model calibration in Excel/VBA and output to
Excel/QuantLib Excel/QuantLib/VBA CSV files
Example calibration results Example yield curve
show variances between market scenarios
and model-implied volatilities(1)
[model – market] vols
Though there are variances between market and model-implied volatilities (e.g. for short expiries/swap
terms) the overall model fit is fairly good and fit for purpose
(1) Variances expressed in terms of shifted log-normal volatilities with 3% shift size
2018-06-06 | Der Leitzins und die Zinsen auf dem Girokonto | Interest Rate Scenario Generation (4/4) © d-fine
© d-fine
— All —
rights
All rights
reserved
reserved
| 29Optimization Problem
2018-06-06 | Der Leitzins und die Zinsen auf dem Girokonto | Optimization Problem © d-fine
© d-fine
— All —
rights
All rights
reserved
reserved
| 30Optimization Problem
» Consider time-averaged margin over the next 10 years and minimize its variance
» Liquidity Constraints: maturing volume fraction > historical quantile of volume drops
Q
» Theoretical Target Function 1
S T , … , T6 = Var T O (7) = T X Kw min
W
R
» Covariance matrix K =< Cov(O
P 5, O P =
P ) > of the time-averaged margins O
Q
∑QR O (7) to be estimated
Monte-Carlo-Simulation
» 10,000 trajectories of market swap par rates over the next 10 years (2-Factor Hull White Model)
Market IRs
› Normal distribution allows for modeling of negative IRs
› Five Parameters (for volatilities, mean reversion and correlation) fitted to ATM swaption
Client
Rates
» Prediction of Client Rates that are consistent with market rates (correct correlation)
Volumes
» Prediction of Deposited Volumes reflecting historically observed client behavior
2018-06-06 | Der Leitzins und die Zinsen auf dem Girokonto | Optimization Problem (1/2) © d-fine
© d-fine
— All —
rights
All rights
reserved
reserved
| 31Details on the Optimization Problem
2018-06-06 | Der Leitzins und die Zinsen auf dem Girokonto | Optimization Problem (2/2) © d-fine
© d-fine
— All —
rights
All rights
reserved
reserved
| 32Time Series Forecasts with Automated Modell Selection
2018-06-06 | Der Leitzins und die Zinsen auf dem Girokonto | Time Series Forecasts with Automated Modell Selection © d-fine
© d-fine
— All —
rights
All rights
reserved
reserved
| 33Application of an Automated Time Series Forecast Procedure
» Forecasts can be used to model a realistic expected behaviour of a time series firmly based in
well understood mathematics, for example:
› Customer deposits
› Volume of new business
› Operating expenditures (non-project related)
» Often the setup is highly manual and done very infrequently, but in principle the process can
be automated
Pros and Cons of an automated time series forecast compared to a manual setup
Pro Contra
» Can expand a consistent forecast » Initial setup has to be performed
procedure to many products and » Maintenance of the running system
different departments required
» Can perform the forecast » Higher requirements for data quality
frequently and can steer » Results may need more
accordingly interpretation
» Higher granularity possible
» Higher accuracy of the forecast
2018-06-06 | Der Leitzins und die Zinsen auf dem Girokonto | Time Series Forecasts with Automated Modell Selection (1/5) © d-fine
© d-fine
— All —
rights
All rights
reserved
reserved
| 34Basic Goals and Requirements of an Automated Time Series Forecast
Goals Model Space
» Highly automated
» ARIMA models
8 ≤ 4, ; ≤ 2, ` ≤ 4
» Ideally no manual steps
» Scalable and highly performant (Non-Seasonal parameters)
» Selection of the best model for
a ≤ 2, b ≤ 1, c ≤ 2
the currently available data (Seasonal parameters)
Goals
where 8 + ` ≤ 4 and
; + b ≤ 2.
» Range of seasonality
(1 ≤ S ≤ 12)
Requirements
Automated » Yeo and Johnson
» Time series with a Timeseries parameter
sufficiently long history Forecast » Parameters for ETS
» No outliers in the time › error term
series due to bad data › trend term
quality Require Model › seasonality term
ments space › damping term
Want to achieve a highly automated model selection over a large model space with minimal manual input
2018-06-06 | Der Leitzins und die Zinsen auf dem Girokonto | Time Series Forecasts with Automated Modell Selection (2/5) © d-fine
© d-fine
— All —
rights
All rights
reserved
reserved
| 35Schematic Depiction of the Forecast Procedure
Time series should be
free of outliers Models
Time series (ARIMA,
data ETS,
et al.)
This step has to be
performed for every Calculation of
model in the model consistency
space and can be Selection of short list
parallelized. criteria members according to
quality of fit criteria like
Akaike’s Criterion or
Bayesian Criterion to
Selection of avoid overfitting
shortlist
Split of timeseries in test
data and training data
members
and selection according
to total error (or other Calculation
criterion) on test data. Model
of total error
selected
on test data
2018-06-06 | Der Leitzins und die Zinsen auf dem Girokonto | Time Series Forecasts with Automated Modell Selection (3/5) © d-fine
© d-fine
— All —
rights
All rights
reserved
reserved
| 36From Models to Shortlist – Calculation of Consistency Criteria
» Only models that pass the following criteria are accepted for the shortlist:
Small autocorrelation of residuals
Variance of residuals constant Residuals follow a normal distribution
Only models that pass basic consistency criteria are considered for the shortlist
2018-06-06 | Der Leitzins und die Zinsen auf dem Girokonto | Time Series Forecasts with Automated Modell Selection (4/5) © d-fine
© d-fine
— All —
rights
All rights
reserved
reserved
| 37From Shortlist to Model Selection
» Select from the shortlist the top 10 models according to:
› Sample corrected Akaike’s Information Criterion AICc (preferred)
› Akaike’s Information Criterion AIC
› Bayesian Information Criterion BIC
» Selection of the model:
› Divide data in training set
and test set
› Calculate expectation for
models on the shortlist and
combination of these
models (i.e. sums of two
models)
› Compute forecast errors on
the test data and select
model according to:
› Mean absolute error
(MAE) (preferred)
› Mean error (ME)
› Mean absolute scaled
error (MASE)
The model that describes the test data set in the best way based on the training data is automatically
selected
2018-06-06 | Der Leitzins und die Zinsen auf dem Girokonto | Time Series Forecasts with Automated Modell Selection (5/5) © d-fine
© d-fine
— All —
rights
All rights
reserved
reserved
| 38Contact
Andreas Nándor Németh d-fine
Senior Consultant Berlin
Tel +43 1 5121792-0 Dusseldorf
Frankfurt
E-Mail AndreasNandor.Nemeth@d-fine.at London
Munich
Vienna
Zurich
Vienna office
d-fine Austria GmbH
Riemergasse 14 Top 12
A-1010 Vienna
Austria
Tel +43 1 5121792-0
Fax +43 1 5121792-20
www.d-fine.com
© d-fine
© d-fine
— All —
rights
All rights
reserved
reserved
| 39d-fine (textbox is required to avoid an issue where this page gets rotated by 90° if printing (both “physical” and pdf))
You can also read