Westside Point-in-Time - Count 2018 Report 2018 Westside Point-in-Time Count Report - Westbank First Nation
←
→
Page content transcription
If your browser does not render page correctly, please read the page content below
Westside
Point-in-Time
Count 2018 Report
     2018 Westside Point-in-Time Count Report   1|Page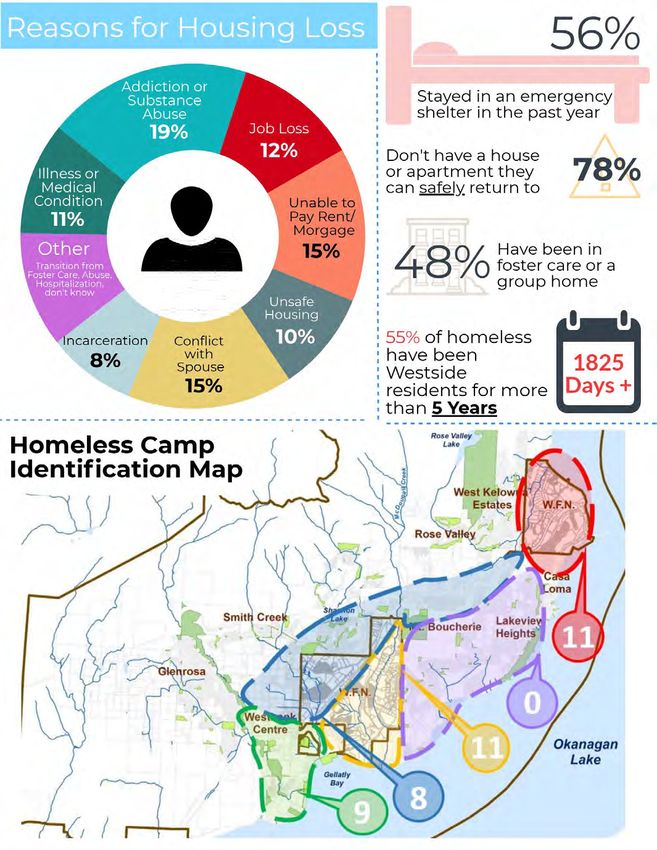
Table of Contents
Acknowledgments .............................................................................................. 4
The 2018 Westside Point-in-Time Count ............................................................. 5
What is a Point in Time Count? .............................................................................. 5
What does a Point in Time Count Provide? ............................................................ 5
Defining Homelessness ....................................................................................... 6
Typology of Living Conditions ................................................................................ 6
PiT Count Exercise............................................................................................... 7
Eligibility criteria .................................................................................................... 7
Magnetic Events .................................................................................................... 8
Outreach Groups ................................................................................................... 8
Volunteer Training ................................................................................................. 9
Resources Provided ............................................................................................... 9
Findings ............................................................................................................ 10
Data Collection .................................................................................................... 10
Respondent Characteristics ................................................................................. 10
      AGE (72 Respondents) .......................................................................................................... 10
      FIRST HOMELESS EXPERIENCE (64 Respondents) ................................................................. 11
      GENDER (71 Respondents) ................................................................................................... 12
      SEXUAL ORIENTATION (71 Respondents) ............................................................................. 12
      FOSTER CARE OR GROUP HOME (72 Respondents) ............................................................. 12
      INDIGENOUS BACKGROUND (71 Respondents) ................................................................... 13
      INDIGENOUS ANCESTRY (38 Respondents) .......................................................................... 13
      BAND OR NATION (32 Respondents) .................................................................................... 14
Living Conditions .................................................................................................. 14
      LOCATION (71 Respondents) ................................................................................................ 14
      LIVING WITH OTHERS (69 Respondents) .............................................................................. 15
      FAMILY HOMELESSNESS (72 Respondents) .......................................................................... 15

2018 Westside Point-in-Time Count Report                                                                                2|Page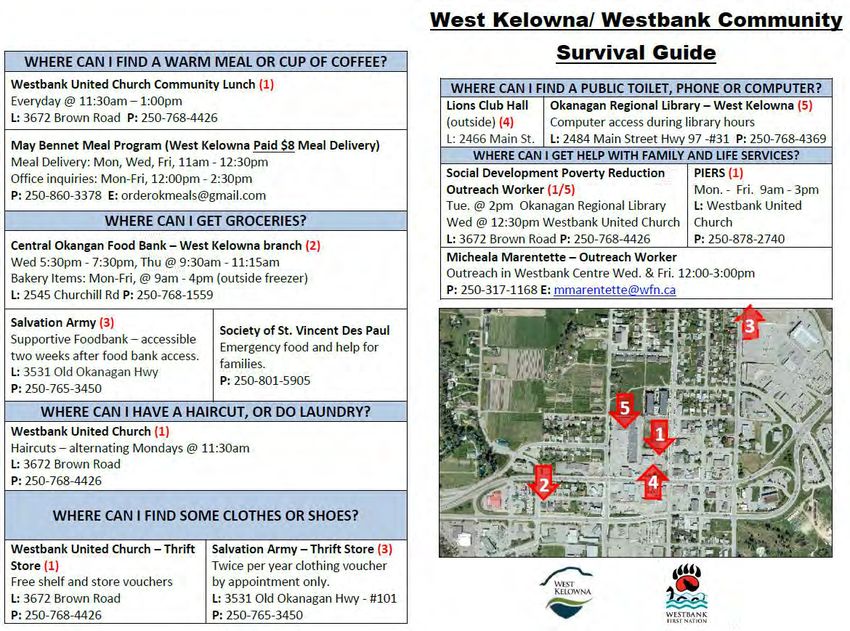
History of Homelessness ...................................................................................... 16
      REASON FOR HOUSING LOSS (72 Respondents)................................................................... 16
      SOURCES OF INCOME (72 Respondents) .............................................................................. 17
      TIME WITHOUT HOUSING IN PREVIOUS YEAR (64 Respondents) ........................................ 17
      EMERGENCY SHELTER (72 Respondents).............................................................................. 17
Migration ............................................................................................................. 18
      LENGTH OF TIME ON THE WESTSIDE (72 Respondents) ...................................................... 18
      PREVIOUS LOCATION (72 Respondents) ............................................................................... 18
      MAIN REASON FOR RESIDING ON THE WESTSIDE (71 Respondents) .................................. 19
      IDENTITY AS AN IMMIGRANT, REFUGEE OR REFUGEE CLAIMANT (61 Respondents) ......... 19
Conclusion ........................................................................................................ 19
Appendix A – Key Findings Summary Sheet....................................................... 20
Appendix B - Survey .......................................................................................... 22
Appendix C – Westside Survival Guide .............................................................. 24

2018 Westside Point-in-Time Count Report                                                                     3|Page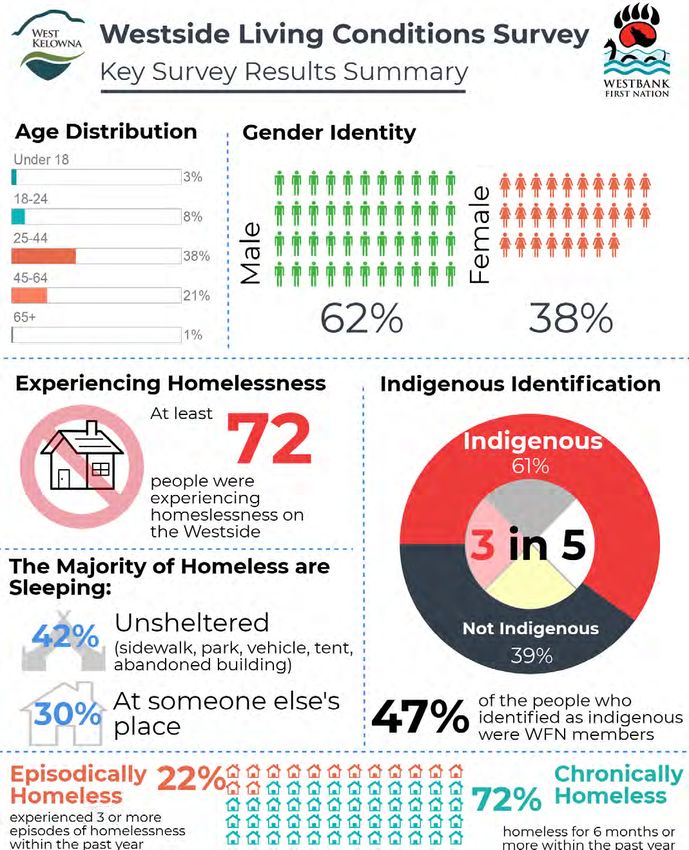
Acknowledgments
A project with the complexity of the Westside 2018 Point-in-Time (PiT) Count could not have
been completed without the participation and support of many individuals and organizations.

The Westside Point-in-Time Count Steering Committee would like to take this opportunity to
thank all agencies, service providers, government staff, businesses, and other individuals who
helped organize and implement the PiT Count.

A special thank you to our dedicated volunteers who contributed their time, enthusiasm, and
compassion to the success of the 2018 PiT Count. Volunteers not only spent their shifts walking
and surveying individuals on the streets and in shelters, they, most importantly, connected
individuals to available resources and made sure that everyone’s voice was heard.

This project was a partnership between the City of West Kelowna and Westbank First Nation and
represents the commitment to taking a community first approach to solving homelessness in our
community.

     Diane M.A. Roy                             Nancy Henderson
     PiT Count Coordinator,                     City of West Kelowna Co-Chair
     Westbank First Nation Co-Chair

Point in Time Count Steering Committee
       Diane M.A. Roy                      Westbank First Nation
       Nancy Henderson                     City of West Kelowna
       Reanne Holden-Amadio                United Way
       Rosemary Weighill                   West Kelowna Shelter Society
       Kristy Butterworth                  Okanagan Boys and Girls Club
       Kevin Bourchier                     City of West Kelowna
       Christene Walsh                     Regional District of Central Okanagan
       Cal Kahn                            Emmanuel Church
       Gloria Helfrick                     Partners in Resources, West Kelowna
Special Thanks
       Jennifer May-Hadford                First Nation Health Authority
       Chris Oliver                        City of West Kelowna
       Corey Scott                         City of West Kelowna

2018 Westside Point-in-Time Count Report                                            4|Page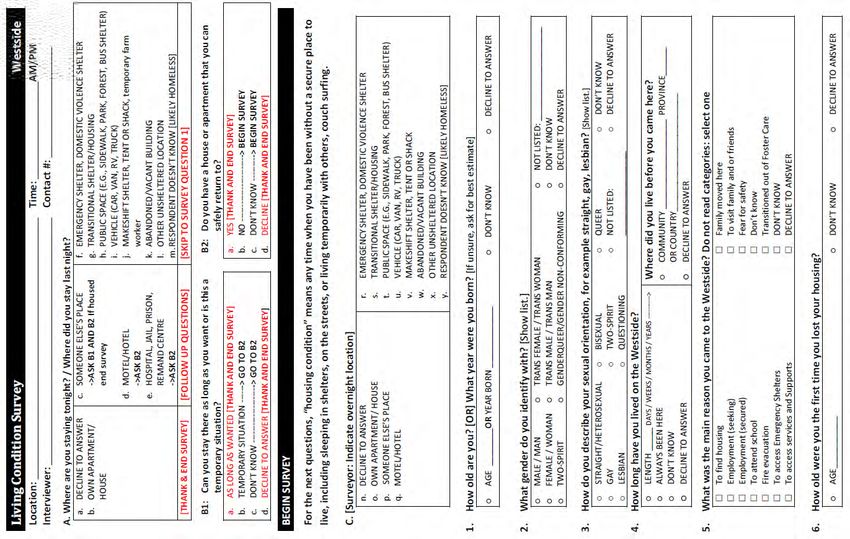
The 2018 Westside Point-in-Time Count
On Wednesday July 23rd, 2018, the City of West Kelowna and Westbank First Nation coordinated
with community agencies and volunteers to conduct the Westside’s first-ever Point-in-Time (PiT)
Homeless Count.
The 2018 Point-in-Time Count is a significant step towards better understanding homelessness
on the Westside. It provides valuable information about the individuals experiencing or struggling
with homelessness in the community.
In addition to important data on living conditions, the 2018 PiT Count allowed the City of West
Kelowna and Westbank First Nations as partnering agencies to build and foster relationships with
service providers and improve the capacity to conduct PiT Counts in the future. The lessons
learned from the 2018 count will inform future counts and housing initiatives on the Westside.

What is a Point in Time Count?
A Point-in-Time Count is a strategy used to help determine the extent of homelessness in a
community at a single point in time. A PiT Count allows the community to better understand the
nature and extent of homelessness and the characteristics of the homeless population. Such
counts support better planning, and when done on more than one occasion, allow communities
to assess their progress in reducing homelessness.

A PiT count is simply a snapshot and cannot provide an exact number of people experiencing
homelessness in a given community. For example, those who are “couch surfing”, a term more
familiar to the public, are less likely to be counted or seen as homeless using Point-in-Time
methodology.

What does a Point in Time Count Provide?
   1.   Increase capacity to undertake a local needs assessment
   2.   Identify the characteristics of the local population
   3.   Enhance community planning, policy, and program development
   4.   Increases public awareness about homelessness
   5.   Measures progress towards ending homelessness
   6.   Community data to inform policies, decisions and funding around housing, supports
        and essential services for people experiencing homelessness
Communities across Canada have been utilizing PiT Counts and this methodology for many years,
including Kelowna, Kamloops, Victoria, Vancouver, Toronto, Edmonton, Comox Valley and
Yellowknife. The Province of Ontario has mandated PiT counts for certain municipalities,
requiring counts to be conducted every two years in order to track progress towards the goal of
ending chronic homelessness by 2025.

2018 Westside Point-in-Time Count Report                                              5|Page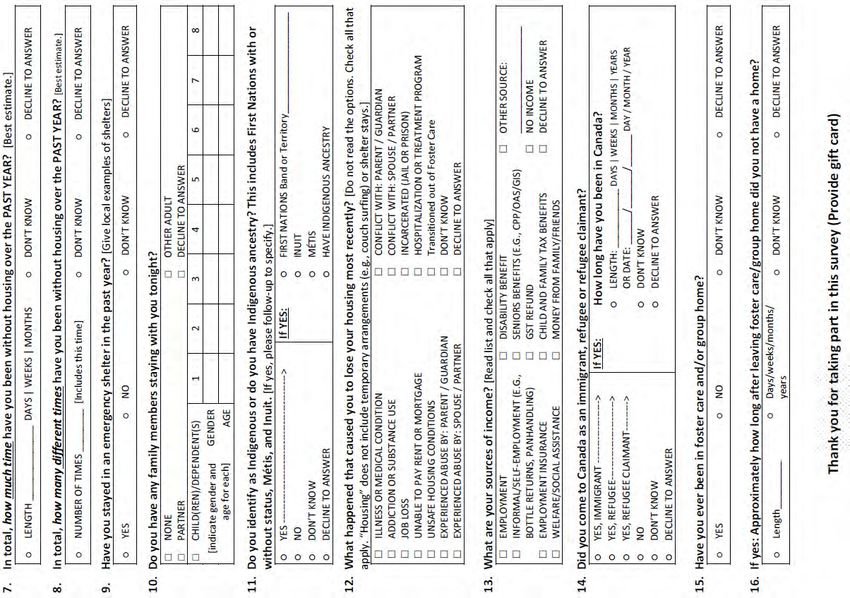
Defining Homelessness
The Canadian Definition of Homelessness 1 describes homelessness as the situation of an
individual, family or community without stable, safe, permanent, appropriate housing, or the
immediate prospect, means and ability of acquiring it. It is the result of systemic or societal
barriers, a lack of affordable and appropriate housing, the individual/household’s financial,
mental, cognitive, behavioural or physical challenges, and/or racism and discrimination. Most
people do not choose to be homeless, and the experience is generally negative, unpleasant,
unhealthy, unsafe, stressful and distressing.

Indigenous homelessness is a human condition that describes First Nations, Métis and Inuit
individuals, families or communities lacking stable, permanent, appropriate housing, or the
immediate prospect, means or ability to acquire such housing. Unlike the common colonialist
definition of homelessness, Indigenous homelessness is not defined as lacking a structure of
habitation; rather, it is more fully described and understood through a composite lens of
Indigenous worldviews. These include: individuals, families and communities isolated from their
relationships to land, water, place, family, kin, each other, animals, cultures, languages and
identities. Importantly, Indigenous people experiencing these kinds of homelessness cannot
culturally, spiritually, emotionally or physically reconnect with their Indigeneity or lost
relationships2.

Typology of Living Conditions1
The typology of living conditions describes the range of accommodations that people without
appropriate, stable, and permanent housing may experience. Those without acceptable housing
experience a range of different types of homelessness, from being unsheltered to having housing
that is insecure or inappropriate. As homelessness is not one single event or state of being, it is
important to recognize that at different points in time people may find themselves experiencing
different types of homelessness. Different types include:
Unsheltered: This includes people who lack housing and are not accessing emergency shelters or
accommodation, except during extreme weather conditions. In most cases, people are staying in
places that are not designed or fit for human habitation.

Emergency Sheltered: This refers to people who, because they cannot secure permanent
housing, are accessing emergency shelter and system supports, generally provided at no or
minimal cost to the user. Such accommodation represents a stop-gap institutional response to
homelessness provided by government, non-profit, faith based organizations and/or volunteers.

1
  Gaetz, S.; Barr, C.; Friesen, A.; Harris, B.; Hill, C.; Kovacs-Burns, K.; Pauly, B.; Pearce, B.; Turner, A.; Marsolais, A.
(2012) Canadian Definition of Homelessness. Toronto: Canadian Observatory on Homelessness Press.
2
  Aboriginal Standing Committee on Housing and Homelessness, 2012.

2018 Westside Point-in-Time Count Report                                                                         6|Page

Provisionally Accommodated: This describes situations in which people, who are technically
homeless and without permanent shelter, access accommodation that offers no prospect of
permanence. Those who are provisionally accommodated may be accessing temporary housing
provided by government or the non-profit sector, or may have independently made
arrangements for short-term accommodation.

At-Risk of Being Homeless: Although not technically homeless, this includes individuals or
families whose current housing situations are dangerously lacking security or stability, and so are
considered to be at risk of homelessness. They are living in housing that is intended for
permanent human habitation, and could potentially be permanent (as opposed to those who are
provisionally accommodated). However, as a result of external hardship, poverty, personal crisis,
discrimination, a lack of other available and affordable housing, insecurity of tenure and / or the
inappropriateness of their current housing (which may be overcrowded or does not meet public
health and safety standards) residents may be “at risk” of homelessness.

PiT Count Exercise
The Canadian Definition of Homelessness provides clarity and consistency around the definition of
homelessness. While each of these categories was not enumerated in full, individuals that described
at least one of the following living situations were deemed eligible to participate in the count.

Based on the preceding definitions, screening questions were used to determine eligibility.

Eligibility Criteria
1. The participant had not yet completed a Westside PiT Count Survey
2. The participant indicated that they were without a permanent residence
3. The participant was defined as homeless, as per the Canadian Definition of Homelessness

In total, 83 individuals completed the screening questions. During the data analysis we removed
anyone who failed to meet all three criteria. For example, we removed individuals that indicated
they had previously completed the PiT Count Survey (Appendix B). Additionally, we removed
individuals that indicated a history of homelessness but were currently staying in a permanent
residence.

2018 Westside Point-in-Time Count Report                                                 7|Page
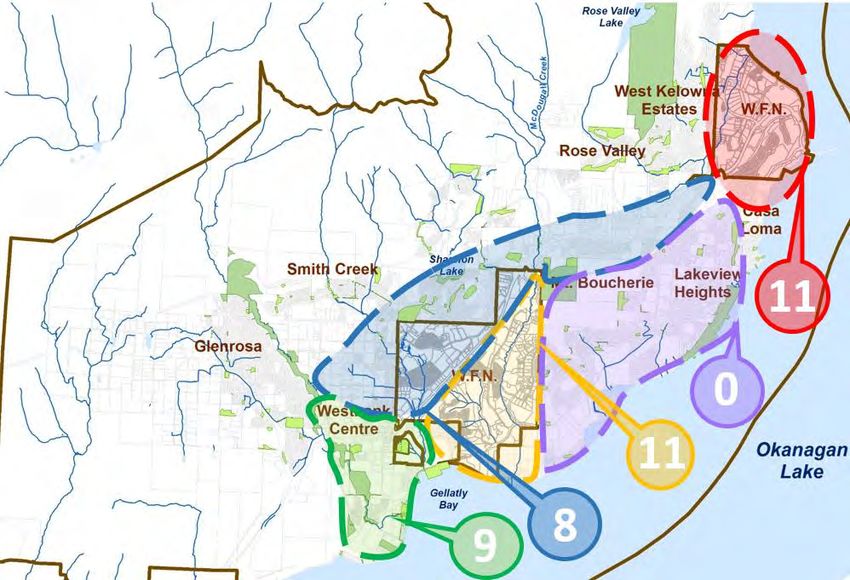
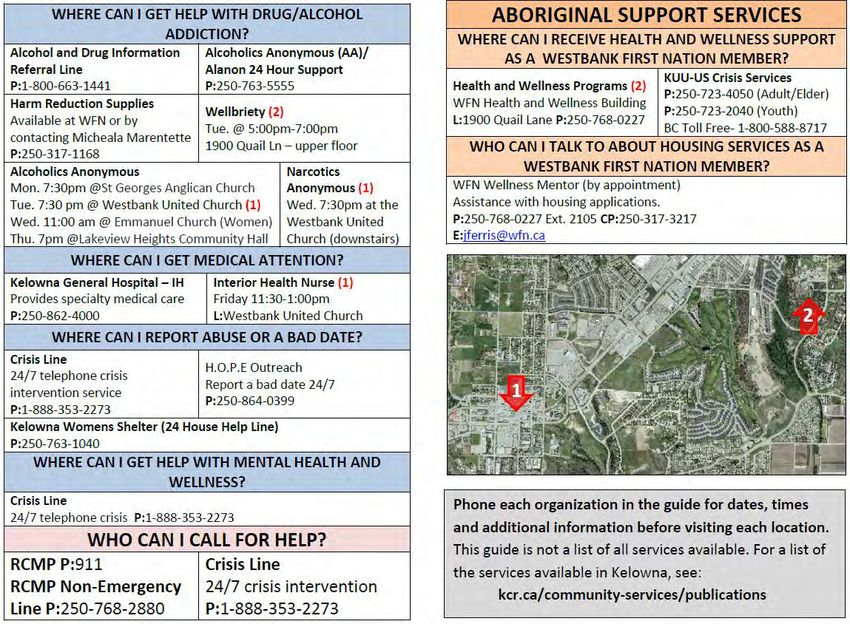
Magnetic Events
In order to best capture our vulnerable population, the
committee elected to host three magnetic events on
Monday July 23, 2018. The details of the events were
shared with service providers on the Westside in advance
of the events’ date. Two of the magnetic events were
specifically targeted to capture certain populations, one
being youth and the other Indigenous persons. Magnetic
events are designed to increase survey opportunities and
engagement with people who may be experiencing
homelessness. These events are especially important when
considering how to engage hard-to-reach populations such
as youth.                                                      Figure 1. Handout that was distributed
Events Times and Locations:                                    prior to the count.

1. The United Church hosted an indoor BBQ from 11:00am – 1:30 pm
2. The Okanagan Boys and Girls Club held an outdoor BBQ at the Westbank Lions Hall from
   4:00pm – 6:00pm
3. An outdoor BBQ was held at the Westbank First Nation Public Beach from 5:00pm – 7:00 pm

Outreach Groups
In advance of the PiT Count, the Steering Committee also identified and categorized locations
where people experiencing homelessness may be residing or “sleeping rough” (i.e. in tents or
without shelter). Given that the Westside does not have an Emergency Shelter or subsidized
housing, the Steering Committee decided small outreach surveying groups could be utilized to
help gain an accurate count at these locations. Overall, with the assistance of partnering agencies
and bylaw, 39 camps were identified throughout the Westside (Figure 2).

The Outreach Teams consisted of three to four volunteers and one team leader. The volunteers
were recruited from local community agencies, non-profit organizations, faith community and
UBC Okanagan and the team leaders recruited were all individuals with front-line experience
working with the homeless population. Teams were geographically assigned based on the density
of temporary shelters or camps throughout the Westside. A total of four outreach teams
participated in the count. The four outreach teams surveyed between 5:00pm and 8:00pm in
order to correspond with the magnetic events and reduce opportunities for duplication in the
enumeration of people experiencing absolute homelessness. Outreach teams were given a map
with highlighted points of interest and detailed directions, a tally sheet to report the number of
observed homeless, and surveys to be conducted.

2018 Westside Point-in-Time Count Report                                                 8|Page
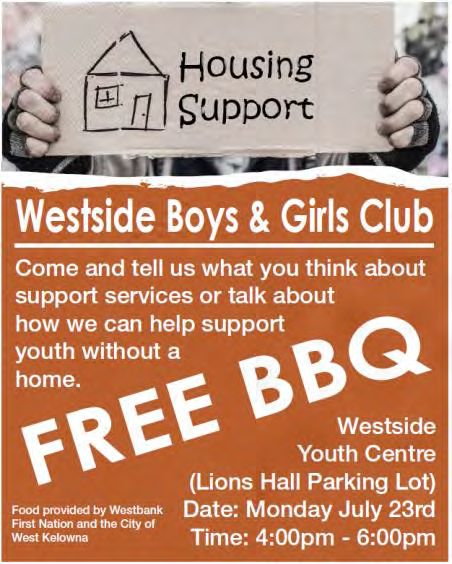
Figure 2. Illustration of identified temporary shelters or camps on the Westside.

Volunteer Training
All volunteers and team leaders participating in the 2018 Westside PiT Count were required to
attend a mandatory 2.5-hour training session. At this training session, volunteers were provided
with information on survey administration, safety protocols, cultural sensitivity and
homelessness to prepare them to support in a volunteer capacity. All Outreach Teams followed
a check-in protocol throughout the count and each team was provided with emergency contact
numbers and information. All volunteers were provided with the opportunity to attend a
volunteer debrief session provided by the RCMP following the count. A total of 29 volunteers
supported the count.

Resources Provided
All volunteer teams were provided with emergency contact numbers and a West Kelowna/
Westbank Community Survival Guide information sheet about local resources to hand out if they
encountered an individual in crisis or immediate need (Appendix C). Small medical kits were also
made available to outreach groups to distribute. All participants that completed a survey were
given a $10 Tim Hortons Gift Card.

2018 Westside Point-in-Time Count Report                                             9|Page
Findings
Data Collection
Surveys were administered and collected at the three magnetic events and by the Outreach
Teams. A total of 83 surveys were completed during the 2018 Westside PiT Count based on the
homeless criteria (Figure 3). Based on the completed surveys, we conclude that there are at least
72 people experiencing homelessness on the Westside.
The majority of the surveys were completed during the Westbank United Church indoor lunch
BBQ magnetic event. The Westbank United Church currently provides daily lunches seven days a
week between 11:00am – 1:00pm to 100+ people. There has been a significant increase in the
past few months. The response to the magnetic event at the United Church encapsulates the
number of surveys. Many of the “rough sleepers” are camped in and around the Westbank
United Church, with seventeen camps that have been identified in this proximity. Respondents
that completed the outreach group surveys were identified beyond this area.

Figure 3. Locations where the surveys were collected (72 Respondents).

Respondent Characteristics
AGE (72 Respondents)
A wide range of ages were represented in our survey population from under 19 to over 65 (Figure 4).
According to the administrative data, the largest age group experiencing homeless was the 25-44 age
group (38 respondents). The second largest age group was 45-64 years of age.
Of note is the percentage of youth ages 18-24 found to be experiencing homelessness on the
Westside, which is 11.1%. According to Without a Home: The National Youth Homelessness
Survey, 20% of the homeless population in Canada is comprised of youth between the ages of
13-24.

2018 Westside Point-in-Time Count Report                                              10 | P a g e
52.8%

                                                                                  29.2%

                                             11.1%
                            2.8%                                                                     1.4%

Figure 4. Age distribution of survey respondents (72 Respondents).

FIRST HOMELESS EXPERIENCE (64 Respondents)
Survey respondents were asked to identify at what age their first instance of homelessness
occurred. Studies suggest that around 1/3 of homeless adults first experienced homelessness as
teenagers3. The administrative data supports this trend for those experiencing homelessness on
the Westside. Indigenous persons report more initial homelessness at
GENDER (71 Respondents)
Males were more prevalent in the administrative
data than females. Over half of the respondents are
male (44 respondents) with females accounting for
38% (respondents 27). Women consistently
continue to be significantly under-represented in
the count compared to the general population.
SEXUAL ORIENTATION (71 Respondents)
The majority of respondents identified as straight
(Figure 7). Of the respondents who identified as
bisexual, all were female. Figure 6. Gender Distribution (71 Respondents).
Figure 7. Sexual Orientation (71 Respondents).
FOSTER CARE OR GROUP HOME (72 Respondents)
Survey participants were asked if they had ever been in
foster care or a group home. 48% of those experiencing
homelessness on the Westside responded that yes, they
were previously in foster care or a group home.
Research suggests a significant link between young
people aging out of care and homelessness; almost 60%
of youth experiencing homelessness have had
involvement with the child welfare system at some point
in their lives4.
Figure 8. Foster Care / Group Home
(32 Respondents).
4
Without a Home: The National Youth Homelessness Survey.
2018 Westside Point-in-Time Count Report 12 | P a g eINDIGENOUS BACKGROUND (71 Respondents)
The general aboriginal population of Westside is
estimated to be 1,025. Indigenous Background Survey
respondents were asked if they identify as Indigenous
or have Indigenous ancestry. 39% of those who
identify as Indigenous report being homeless. The
majority of the respondents that were inadequately
housed were Indigenous (42 respondents) or had
Indigenous ancestry (1 respondent). This is a
significant over-representation compared to the
overall population.
The 2016 Figure 9. Indigenous Background (71 Respondents).
The 2016 Census identified:
580 aboriginals with status in the City of West Kelowna
140 aboriginals with status in Westbank First Nation IR#10
725 aboriginals with status in Westbank First Nation IR#9
As of August 10, 2018, only 509 WFN members lived on reserve.
INDIGENOUS ANCESTRY (38 Respondents)
The 2018 Point in Time count survey featured a locally developed Indigenous specific question to
identify their nation or Band. In the administrative data, 60.6% of respondents identified as being of
indigenous ancestry. Individuals that identified as First Nation were the most common Indigenous
group and no Inuit individuals were identified.
74.4%
11.6%
2.3%
Figure 10. Indigenous Ancestry (38 Respondents).
2018 Westside Point-in-Time Count Report 13 | P a g eBAND OR NATION (32 Respondents)
Survey respondents that indicated Indigenous identify or ancestry were asked to specify the band or
nation. Almost half of the First Nation group identified as members of the Westbank First Nation
(46.9%), almost half. 12.5% had relocated within the Sylix territory. This is a common pattern for the
Okanagan Nation, as members tend to move up and down the valley.
Figure 11. Indigenous Ancestry (32 Respondents).
Living Conditions
LOCATION (71 Respondents)
Figure 12 illustrates the living
accommodations of respondents. The
largest cohort is unsheltered at 45% of
the respondents, while 18% of
respondents are staying at someone
else’s place. Other common answers
were a shelter or hotel, jail or hospital
or one’s own apartment, house or
trailer. 5% of respondents indicated
that they did not know where they
would be staying that night.
Figure 12. Locations of respondents’ living accommodations (71
Respondents).
2018 Westside Point-in-Time Count Report 14 | P a g eLIVING WITH OTHERS
LIVING ALONE 69.4%
(69 Respondents)
Figure 13 shows the 12.5%
proportion of respondents
that were either living 11.1%
alone or with others.
Responses with respect to 1.4%
those who are living with
others varied from living 1.4%
with a partner, other
adult, children, or children
and a partner.
Figure 13. Respondents living with others (69 Respondents).
FAMILY HOMELESSNESS (72 Respondents)
Families experiencing homelessness can face additional challenges in securing housing or accessing
shelters designed for single individuals. Two survey respondents indicated that they had children
staying with them who were also experiencing homelessness.
Figure 14. Family homelessness (72 Respondents).
2018 Westside Point-in-Time Count Report 15 | P a g eHistory of Homelessness
REASON FOR HOUSING LOSS
(72 Respondents)
The causes of homelessness are often
very complex and depend on each
person’s individual circumstances.
The 2018 PiT Count provided the
opportunity to gain further insight
into the causes of housing loss for
those experiencing homelessness on
the Westside. Survey respondents
had the opportunity to answer with
multiple responses if it was applicable
to their situation, and the
percentages are reflected of all the
survey responses (Figure 15).
The top five responses as to why the
survey respondent lost their housing
most recently were: Figure 15. Causes for homelessness (72 Respondents).
Addiction or substance use Job loss
Unable to pay rent/mortgage Illness or medical condition
Conflict with spouse
The majority of respondents to questions associated with continual homelessness identified
themselves as being chronically homeless (experiencing homelessness for a period of 6 months or
greater). Episodic homelessness (experiencing homelessness three or more times in the past year)
was less common (Figure 16).
CHRONIC EPISODIC
Figure 16. Experiences with chronic and episodic homelessness (72 Respondents).
2018 Westside Point-in-Time Count Report 16 | P a g eSOURCES OF INCOME (72
Respondents)
Figure 17 shows the sources of income for
the 72 respondents to income-related
questions.
TIME WITHOUT HOUSING IN
PREVIOUS YEAR (64 Respondents)
From the administrative data on
experiencing homelessness on the
Westside, a significant proportion of
40.3% reported being without a home for
more than a year. Of the 64 respondents
to this question, 72.6% reported being
without a home for 6 months or more.
Figure 17. Income Sources (72 Respondents).
40.3%
21.0% 21.0%
11.3%
6.5%
Figure 18. Time without housing in the previous year (64 Respondents).
EMERGENCY SHELTER (72 Respondents)
62% of the 72 respondents who answered questions on
whether they had stayed in an emergency shelter
within the last year noted that they had (Figure 19).
Figure 19. Percent of respondents staying in a shelter within the past year (72 Respondents).
2018 Westside Point-in-Time Count Report 17 | P a g eMigration
LENGTH OF TIME ON THE WESTSIDE (72 Respondents)
Of the 72 survey responses to questions surrounding length of time spent on the Westside, 33%
of respondents have lived on the Westside for more than ten years. Another third of respondents
have lived on the Westside between two and ten years. The remaining third of respondents has
been on the Westside for anywhere between 1 and 18 months (Figure 20).
33.3%
%
22.2%
% 19.4%
%
13.9%
%
8.3%
Figure 20. Length of time on the Westside (72 Respondents).
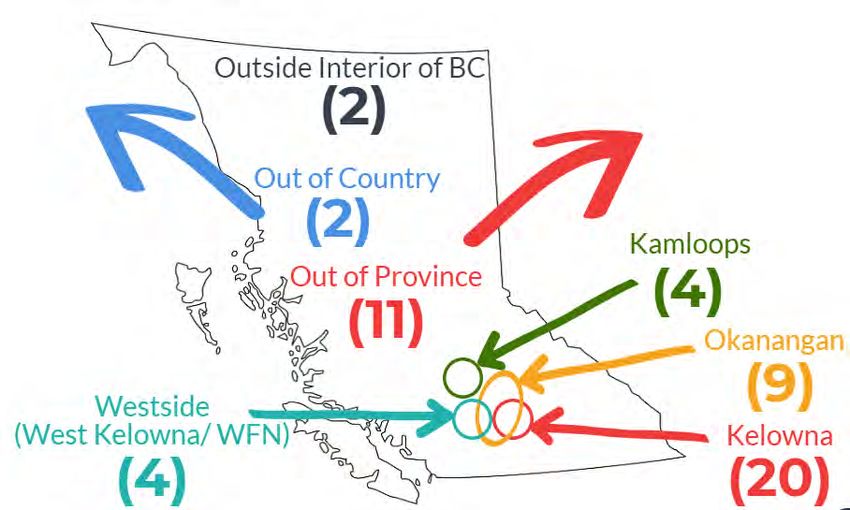
PREVIOUS LOCATION (72
Respondents)
While more than 65% of survey
respondents reported living on the
Westside for greater than 2 years,
the survey did ask where people
resided prior to their current
location to gain further insight into
migration. 72 survey respondents
answered and identified their
previous location prior to
living on the Westside (Figure Figure 21. Previous location of survey respondents (72 Respondents).
21). 5.6% have always lived here, whereas the largest proportion of respondents noted that they
came from Kelowna (27.8%). 18.1% come from other areas within the Thompson-Okanagan
Region and 6.9% noted that their previous location was within BC but outside of the Interior
Region. 15.3% came from out of province and 2.8% came from outside of the country.
2018 Westside Point-in-Time Count Report 18 | P a g eMAIN REASON FOR RESIDING ON THE WESTSIDE (71 Respondents)
Figure 22 below shows respondents’ main reason for locating on the Westside.
22.9%
16.9% 16.9%
4.8% 6.0%
2.4% 1.2% 1.2% 3.6% 2.4%
Figure 22. Main reason for residing on the Westside (71 Respondents).
IDENTITY AS AN IMMIGRANT, REFUGEE OR REFUGEE CLAIMANT (61 Respondents)
Survey respondents were asked whether they came to Canada as an immigrant, refugee or refugee
claimant. Only one person experiencing homelessness who completed the survey identified as having
once been a newcomer to Canada, arriving over 10 years ago as an immigrant.
Conclusion
The 2018 Westside Point-in-Time Count provided the opportunity to gain new insight into the
state of homelessness in our community. The data presented in this report provides essential
information about those experiencing homelessness and can be utilized to inform future
decisions around housing, policy development, programming and supports for this most
vulnerable population. Appendix A of this report provides a summary of key findings from the
report.
The data captured from the PiT Count will assist the Westside to continue to build system
capacity, create population specific responses to improve client outcomes and improve the
effectiveness of the housing system. The Westside PiT Count Steering Committee will assist in
the promotion of awareness about the count and its results and identify ways to improve the
next count.
In our next count and as part of future initiatives, the City of West Kelowna and Westbank First
Nation plan to build on its community first partnerships to benefit the Westside community and
build on the success of this initiative.
2018 Westside Point-in-Time Count Report 19 | P a g eAppendix A – Key Findings Summary Sheet
2018 Westside Point-in-Time Count Report 20 | P a g e2018 Westside Point-in-Time Count Report 21 | P a g e
Appendix B - Survey

        2018 Westside Point-in-Time Count Report   22 | P a g e
2018 Westside Point-in-Time Count Report 23 | P a g e
Appendix C – Westside Survival Guide

        2018 Westside Point-in-Time Count Report   24 | P a g e
2018 Westside Point-in-Time Count Report 25 | P a g e
2018 Westside Point-in-Time Count Report 26 | P a g e
You can also read