THE SECURITIES INDUSTRY IN NEW YORK CITY - THOMAS P. DINAPOLI, STATE COMPTROLLER OFFICE OF THE NEW YORK STATE COMPTROLLER

Page created by Russell Hughes
 
CONTINUE READING
THE SECURITIES INDUSTRY IN NEW YORK CITY - THOMAS P. DINAPOLI, STATE COMPTROLLER OFFICE OF THE NEW YORK STATE COMPTROLLER
The Securities Industry
   in New York City

OFFICE OF THE NEW YORK STATE COMPTROLLER
  Thomas P. DiNapoli, State Comptroller
       Rahul Jain, Deputy Comptroller

       REPORT 6-2021 | OCTOBER 2020
THE SECURITIES INDUSTRY IN NEW YORK CITY - THOMAS P. DINAPOLI, STATE COMPTROLLER OFFICE OF THE NEW YORK STATE COMPTROLLER
Introduction
The COVID-19 pandemic has significantly
impacted the securities industry in New York             Highlights
City, affecting both operations and profitability.
                                                          ll   Securities industry profits from the first half
After a period of market turmoil in March,
                                                               of 2020 totaled $27.6 billion, the best first-
monetary stimulus and fiscal relief actions
                                                               half results since 2009. Profits rose from
have injected massive liquidity into the
                                                               an increase in trading and underwriting
economy and buoyed industry profitability.
                                                               activity, along with lower interest rates.
Much of the industry’s work force began
working remotely in March. The industry                   ll   Revenues from underwriting activities
has remained relatively stronger than other                    totaled $10.7 billion for the second quarter,
sectors, which have experienced a more                         the strongest quarterly results on record.
severe downturn (i.e., hotels, bars, restaurants               Commission and trading income increased
and retail).                                                   by 22 percent in the first half, the strongest
                                                               first half since 2009.
Securities industry profits grew by 82 percent
in the first half of 2020 (to $27.6 billion), the         ll   The average bonus paid to securities
best first half since 2009. In the first two                   industry employees in New York City
quarters of 2020, the industry has nearly                      increased by 3 percent to $164,100 in
eclipsed the total amount of annual profits                    2019, in line with profits.
reported for 2019.                                        ll   The average salary (with bonuses) of
                                                               industry employees in New York City was
As a result of the increase in profitability, the              $406,700 in 2019, five times higher than
amount set aside for compensation this year                    the average in the rest of the private sector
increased by 4.8 percent through the first                     ($82,900).
half of 2020, but year-end bonuses will be
dependent on full-year results. For 2019, the             ll   The securities industry accounted for less
bonus pool totaled $29.3 billion, a 3 percent                  than 5 percent of New York City’s jobs
growth rate.                                                   in 2019, but one-fifth of all private sector
                                                               wages paid.
While industry profitability has grown,
                                                          ll   In 2019, immigrants made up over one-
employment in New York City’s securities
                                                               third of industry employees in New York
industry has declined slightly. The sector is on
                                                               City, a higher share than in 2008.
pace to lose 7,300 jobs in 2020, erasing close
to half the job gains (45 percent) since 2013.            ll   Commuters from outside of the City
                                                               represented 41 percent of industry
The current employment decline looks milder                    employees, the highest share of any
than in the previous two economic downturns                    major industry.
(2001 and 2009), where the industry faced
                                                          ll   The securities industry accounted for
three consecutive years of job losses before
                                                               an estimated 18 percent of State tax
growth resumed. The current downturn
                                                               collections and 6 percent of City tax
poses new questions, however, regarding
                                                               collections in the past fiscal year —
the duration of the public health crisis and
                                                               slightly lower than in recent years
associated changes to behavior, including an
                                                               as a result of the City’s economic
accelerated adoption of technology. Its full
                                                               diversification.
impact remains uncertain.

                                                     1
THE SECURITIES INDUSTRY IN NEW YORK CITY - THOMAS P. DINAPOLI, STATE COMPTROLLER OFFICE OF THE NEW YORK STATE COMPTROLLER
COVID-19 Impact
The pandemic has significantly affected the                                                        Prior to the pandemic, according to U.S. Census
way industries operate, including the securities                                                   data, slightly more than 5 percent of workers
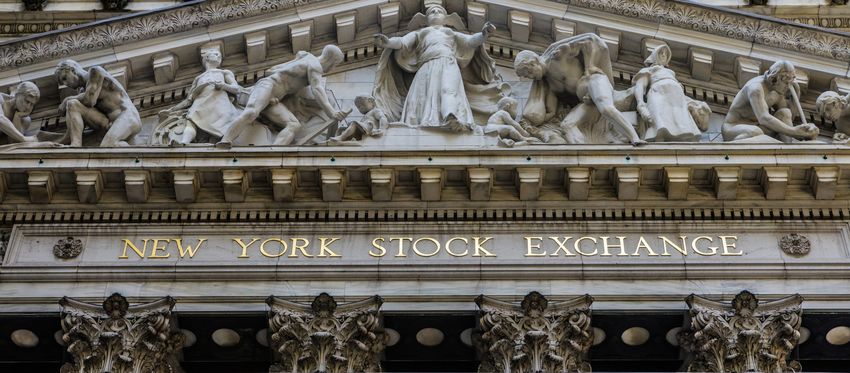
sector. On March 23, physical trading on the                                                       across the nation worked from home. For the
New York Stock Exchange (NYSE) was closed,                                                         broader financial activities industry, the rate was
and the NYSE moved to fully electronic trading.                                                    below 10 percent.
The NYSE stayed closed for two months, and
firms conducted business remotely. Since the                                                       Recently, some of the larger financial institutions
NYSE reopened on May 26, industry employees                                                        headquartered in New York City have begun to
have slowly returned to trading on premises,                                                       require a growing number of their workers to
although at a limited capacity to adhere to social-                                                return to their offices. The pace of return may
distancing restrictions and other safety protocols.                                                fluctuate because safe returns will depend on
                                                                                                   the rate of contagion as well as development
Recent data released by the Bureau of Labor                                                        of a vaccine. However, it is likely that some
Statistics show that as a result of the pandemic,                                                  portion of workers in the industry will continue to
on average across the nation, 6 out of 10                                                          telecommute or work from home on an ongoing
workers in the finance and insurance industry                                                      basis.
have either teleworked or worked from home
since April (the latest data available). This is a                                                 There is a risk that some firms and employees
higher rate than in other office sectors through                                                   may relocate. A recent Siena College survey
September (see Figure 1).1                                                                         indicates that 44 percent of high-income-earning
                                                                                                   adults ($100,000 or more) have considered
FIGURE 1                                                                                           moving outside of New York City as a result of
Percent of Employed People Teleworking or                                                          pandemic-related impacts. About 70 percent of
Working from Home                                                                                  employees in the securities industry earn wages
                              75                                                                   of at least $100,000.
                                             Finance & Insurance        Other Office Sectors
 Percent of Employed People

                              60               67                                                  The pandemic and its effects also have
                                   62
                                                           58                                      significantly disrupted financial markets. In
                              45                                        54          53
                                        51
                                                    47                                             March, volatility as measured by the Cboe Daily
                                                                   43
                              30
                                                                             40
                                                                                         37        Volatility Index (VIX) increased to levels not
                                                                                                   witnessed since the 2009 financial crisis (Cboe
                              15
                                                                                                   owns the Chicago Board Options Exchange; see
                              0                                                                    Figure 2).
                                    May         June        July        August    September

Sources: U.S. Bureau of Labor Statistics; OSC analysis                                             FIGURE 2
                                                                                                   Stock Market Volatility
According to the latest U.S. Census Household                                                       90.0
Pulse Survey, nearly 44 percent of households                                                       75.0
                                                                                                                                       80.9                                                                                                  82.7

living in the New York-Newark-Jersey City
                                                                                                    60.0
metropolitan area had members who teleworked
                                                                                                    45.0
in the most recent week of available data.
                                                                                                    30.0

                                                                                                    15.0

                                                                                                     0.0
1 Other office sectors include: information, professional and
                                                                                                           Jan-04
                                                                                                                    Jan-05
                                                                                                                             Jan-06
                                                                                                                                      Jan-07
                                                                                                                                               Jan-08
                                                                                                                                                        Jan-09
                                                                                                                                                                 Jan-10
                                                                                                                                                                          Jan-11
                                                                                                                                                                                   Jan-12
                                                                                                                                                                                            Jan-13
                                                                                                                                                                                                     Jan-14
                                                                                                                                                                                                              Jan-15
                                                                                                                                                                                                                       Jan-16
                                                                                                                                                                                                                                Jan-17
                                                                                                                                                                                                                                         Jan-18
                                                                                                                                                                                                                                                  Jan-19
                                                                                                                                                                                                                                                           Jan-20

business services, and financial activities excluding finance and
insurance.
                                                                                                   Sources: Cboe Daily Volatility Index (VIX); OSC analysis

                                                                                               2
THE SECURITIES INDUSTRY IN NEW YORK CITY - THOMAS P. DINAPOLI, STATE COMPTROLLER OFFICE OF THE NEW YORK STATE COMPTROLLER
On March 16, the Dow Jones Industrial Average                                                          For the larger bank holding companies,
plummeted 3,000 points (13 percent), the worst                                                         profitability fell despite stable revenue because
one-day drop since Black Monday in 1987.                                                               regulations require banks to set aside funds
While the Dow has recovered a large share of                                                           for credit losses in anticipation of projected
its losses, it remains volatile and below its pre-                                                     defaults. Figure 4 shows that allowances for
pandemic peak.                                                                                         credit losses at the top six banking firms have
                                                                                                       more than doubled, from $51.0 billion in 2019 to
Each of the major indices reached their lows                                                           $109.9 billion at the end of the second quarter of
for the year (thus far) in late March. The Dow                                                         this year.
declined the most, falling 36 percent, and the
S&P 500 lost 31 percent. Nasdaq has fared                                                              FIGURE 4
the best, dropping by 25 percent in March                                                              Allowance for Credit Losses at Large Bank
from the beginning of the year and rebounding                                                          Holding Companies
significantly over the summer months (see                                                                                    160
Figure 3). Nasdaq’s strong performance reflects                                                                              140
its high concentration of technology companies,                                                                              120
                                                                                                       Billions of Dollars
which have generally been less disrupted by the                                                                              100
economic effects of the pandemic, and even able                                                                               80
                                                                                                                              60
to benefit from an increase in demand.
                                                                                                                              40
                                                                                                                              20
FIGURE 3                                                                                                                       0
Year-to-Date Return of Major Stock Indices
                                                                                                                                   2009

                                                                                                                                          2010

                                                                                                                                                 2011

                                                                                                                                                        2012

                                                                                                                                                               2013

                                                                                                                                                                      2014

                                                                                                                                                                             2015

                                                                                                                                                                                    2016

                                                                                                                                                                                           2017

                                                                                                                                                                                                  2018

                                                                                                                                                                                                         2019

                                                                                                                                                                                                                2020*
  40%
                          Dow       Nasdaq             S&P 500                                                                                                                                    *Through June
  30%
                                                                                                       Sources: Securities and Exchange Commission filings; OSC
  20%
                                                                                                       analysis
  10%
   0%
 -10%
 -20%
 -30%
 -40%
        Jan-20

                 Feb-20

                           Mar-20

                                    Apr-20

                                             May-20

                                                      Jun-20

                                                               Jul-20

                                                                        Aug-20

                                                                                 Sep-20

                                                                                          Oct-20

Sources: Yahoo! Finance; OSC analysis

The increased volatility caused a flurry of trading
activity beginning in February and through the
summer, resulting in a jump in commission
and trading income of 22 percent for NYSE
member firms in the first half of 2020. (For further
discussion, see “Industry Profitability.”)

                                                                                                   3
Policy Actions and Market Impact
In response to the pandemic, Congress passed
four relief and stimulus bills in the spring totaling
$2.4 trillion to support the economy. Congress is
currently negotiating another large stimulus bill,
but bipartisan support has waned as elections
approach, and progress has stalled. Since
March, governments across the globe (including
the United States) have injected about $11 trillion
in capital into the world economy.2

In March, the Federal Reserve lowered interest
rates to near zero and increased its efforts to
support the credit markets. The Fed’s balance
sheet has grown by over $3 trillion in 2020 to
more than $7 trillion.

As a result of this tremendous influx of liquidity
and with the Federal Reserve acting as a credit
backstop, there has been record growth in                                                                                                          Global equity offerings totaled $750.7 billion
securities offerings, particularly debt.                                                                                                           (see Figure 6) for the first nine months of 2020,
                                                                                                                                                   representing a 59 percent increase from a year
According to Refinitiv (formerly Thomson                                                                                                           ago and the strongest nine-month period for
Reuters), in the first nine months of 2020, global                                                                                                 global equity capital markets on record. This
debt offerings totaled $8.1 trillion, the largest                                                                                                  was driven by an increase in global secondary
opening nine-month period on record (since                                                                                                         offerings (stock issuances of companies already
1980) and surpassing the full-year record volume                                                                                                   listed on the exchange), up 78 percent from a
achieved in 2019 ($7.7 trillion; see Figure 5).                                                                                                    year ago and totaling $475.7 billion.

FIGURE 5                                                                                                                                           FIGURE 6
Volume of Global Debt Offerings                                                                                                                    Volume of Global Equity Offerings
                        8.3                                                                                                                                               900
                        7.5                                                                                                                                               800
                        6.8
 Trillions of Dollars

                                                                                                                                                                          700
                                                                                                                                                    Billions of Dollars

                        6.0
                                                                                                                                                                          600
                        5.3
                        4.5                                                                                                                                               500
                        3.8                                                                                                                                               400
                        3.0                                                                                                                                               300
                        2.3
                                                                                                                                                                          200
                        1.5
                        0.8                                                                                                                                               100
                        0.0                                                                                                                                                0
                                                                                                                                                                                2005
                                                                                                                                                                                       2006
                                                                                                                                                                                              2007
                                                                                                                                                                                                     2008
                                                                                                                                                                                                            2009
                                                                                                                                                                                                                   2010
                                                                                                                                                                                                                          2011
                                                                                                                                                                                                                                 2012
                                                                                                                                                                                                                                        2013
                                                                                                                                                                                                                                               2014
                                                                                                                                                                                                                                                      2015
                                                                                                                                                                                                                                                             2016
                                                                                                                                                                                                                                                                    2017
                                                                                                                                                                                                                                                                           2018
                                                                                                                                                                                                                                                                                  2019
                                                                                                                                                                                                                                                                                         2020*
                              2005
                                     2006
                                            2007
                                                   2008
                                                          2009
                                                                 2010
                                                                        2011
                                                                               2012
                                                                                      2013
                                                                                             2014
                                                                                                    2015
                                                                                                           2016
                                                                                                                  2017
                                                                                                                         2018
                                                                                                                                2019
                                                                                                                                       2020*

                                                                                                      *Through September                                                                                                                               *Through September
                                                                                                                                                   Sources: Refinitiv; OSC analysis
Sources: Refinitiv; OSC analysis

2 International Monetary Fund, World Economic Outlook Update,
June 2020.

                                                                                                                                               4
Initial public offerings (IPOs) totaled $137           FIGURE 7
billion during the first nine months of 2020, an       Special Purpose IPO Issuances
increase of 26 percent and the strongest first                               55
nine months since 2018. This data excludes the                               50
                                                                             45
impact of SPACs (or special purpose acquisition                              40
companies, which are formed to raise money                                   35

                                                       Billions of Dollars
                                                                             30
through an IPO to buy another company).                                      25
                                                                             20
SPACs, also referred to as “blank-check                                      15
                                                                             10
companies,” experienced increased popularity                                  5
this year. A record number of SPAC IPOs has                                   0

                                                                                  2003
                                                                                         2004
                                                                                                2005
                                                                                                       2006
                                                                                                              2007
                                                                                                                     2008
                                                                                                                            2009
                                                                                                                                   2010
                                                                                                                                          2011
                                                                                                                                                 2012
                                                                                                                                                        2013
                                                                                                                                                               2014
                                                                                                                                                                      2015
                                                                                                                                                                             2016
                                                                                                                                                                                    2017
                                                                                                                                                                                           2018
                                                                                                                                                                                                  2019
                                                                                                                                                                                                         2020*
been issued thus far in 2020, totaling over
$48 billion, whereas these products have raised                                                                                                                 *As of October 14, 2020

a total of $59.4 billion during the previous           Sources; SPAC Analytics; OSC analysis
17 years (2003 to 2019), according to SPAC
Analytics, a leading provider of SPAC data and
research (see Figure 7).

                                                   5
Industry Profitability
Securities industry profitability is traditionally
measured by the pretax profits of the broker/
dealer operations of NYSE member firms. Other
business lines of the member firms, such as
retail and commercial banking, are not included.

Pretax profits in 2019 increased by 2.8 percent
to $28.1 billion, the fourth consecutive year
of increased profitability and the highest level
since 2009 (see Figure 8). During this period,
the levers of profitability shifted from a focus on
lowering expenses to higher revenue generation
(see Figure 9). Net revenue (i.e., gross revenue
less interest expenses, which is the preferred
industry measure) grew by 3.8 percent in 2019,
slower than in the prior two years.

Revenue from other income related to the
securities business accounted for 52 percent
or $87.3 billion of net revenues in 2019
($169.2 billion), the strongest level since
2008. This increase was primarily driven by
fees generated from negotiated and private
transactions.

FIGURE 8
Securities Industry Profits
                      80
                                                    Profits                           Inflation-Adjusted Profits
                      60
Billions of Dollars

                      40
                      20
                       0
                      -20
                      -40
                      -60
                            1990
                                   1991
                                          1992
                                                 1993
                                                        1994
                                                               1995
                                                                      1996
                                                                             1997
                                                                                    1998
                                                                                           1999
                                                                                                  2000
                                                                                                         2001
                                                                                                                2002
                                                                                                                       2003
                                                                                                                              2004
                                                                                                                                     2005
                                                                                                                                            2006
                                                                                                                                                   2007
                                                                                                                                                          2008
                                                                                                                                                                 2009
                                                                                                                                                                        2010
                                                                                                                                                                               2011
                                                                                                                                                                                      2012
                                                                                                                                                                                             2013
                                                                                                                                                                                                    2014
                                                                                                                                                                                                           2015
                                                                                                                                                                                                                  2016
                                                                                                                                                                                                                         2017
                                                                                                                                                                                                                                2018
                                                                                                                                                                                                                                       2019

Note: Pretax profits for broker/dealer operations of New York Stock Exchange member firms.
Sources: Securities Industry and Financial Markets Association; NYSE/Intercontinental Exchange; U.S. Bureau of Labor Statistics;
OSC analysis

                                                                                                                              6
FIGURE 9                                                                                         The initiation of federal and local government
Annual Change in Net Revenues and                                                                actions in the wake of COVID-19 resulted in
Net Expenses at NYSE Member Firms                                                                a flurry of trading activity beginning in late
                      20                                                                         February. Average daily volume on the NYSE
                                                 Net Revenues          Net Expenses
                      15                                                                         Composite increased significantly in late
                                                                                                 February and remained elevated through the
Billions of Dollars

                      10

                       5                                                                         summer, reaching the highest levels since
                       0                                                                         the global financial crisis of 2008. As a result,
                       -5                                                                        commission and trading income increased by 22
                      -10                                                                        percent for the NYSE member firms in the first
                      -15                                                                        half to $28.8 billion, the strongest first half since
                            2011

                                   2012

                                          2013

                                                  2014

                                                         2015

                                                                2016

                                                                       2017

                                                                              2018

                                                                                      2019
                                                                                                 2009.
Sources: Securities Industry and Financial Markets Association;                                  Revenues from underwriting activities totaled
OSC analysis
                                                                                                 $10.7 billion for the second quarter, the strongest
Pretax profits totaled $27.6 billion in the first half                                           quarterly results on record, representing an
of 2020, an 82 percent increase from the prior                                                   increase of almost 40 percent from the prior year.
year’s first half that nearly approaches full-year                                               For the first half of 2020, underwriting revenues
2019 levels. The first half results for 2020 are the                                             were up more than 34 percent to $17.3 billion.
strongest since 2009. Profits rose because of
                                                                                                 The City has not updated its revenue
an increase in trading and underwriting activity,
                                                                                                 assumptions associated with the securities
along with lower interest rates.
                                                                                                 industry since April, and is currently forecasting
                                                                                                 a loss of $6.4 billion for the industry in 2020.
                                                                                                 The industry’s performance in the first half of the
                                                                                                 year, however, suggests that the industry will
                                                                                                 be markedly profitable for the year, barring any
                                                                                                 further unforeseen events.

                                                                                             7
Employment
Employment in the securities industry in                                                 from the pandemic-induced recession are so far
New York City totaled 182,100 jobs in 2019,                                              milder for the industry than they were in 2002
the highest level since the financial crisis                                             and 2009.
(see Figure 10, which shows annual changes
along with the historical trend line). While the                                         While New York City remains the center of the
industry has added jobs in five of the past six                                          nation’s security industry, its share of the nation’s
years (16,200 jobs total), it has been losing                                            securities industry employment has been in
jobs since January. The sector is on pace to                                             long-term decline as jobs have been shifted to
lose 7,300 jobs in 2020, erasing close to half                                           lower-cost regions, firms have geographically
(45 percent) of all the job gains since 2013.                                            diversified their operations, and other regions
                                                                                         have experienced stronger economic growth.
The industry in 2019 was 4 percent (6,800 jobs)                                          The City’s share of total industry jobs has
smaller than in 2007 and 9 percent (19,000 jobs)                                         declined, from 33 percent in 1990 to 21 percent
below its peak in 2000. Securities employment                                            in 2007, and was down to 19 percent in 2019.
in the City reached 201,100 jobs in 2000, but
then declined by 35,200 through 2003 following                                           New York State had 202,300 securities industry
the 9/11 terrorist attacks and the collapse of the                                       jobs in 2019, more than any other state in the
dot-com bubble. Before the industry could fully                                          nation (California was second with 97,600
recover, it lost another 22,700 jobs between 2007                                        jobs), but it has lost 8,700 jobs since 2007. New
and 2010 in the wake of the Great Recession.                                             York City accounted for 90 percent of industry
Since then, the industry had added over 16,000                                           employment in New York State, a similar share
jobs prior to the latest downturn, but growth                                            as in 2007.
has been uneven. Employment losses resulting

FIGURE 10
New York City Securities Industry Employment
  205,000
                                                                           Job Gains                 Job Losses
  200,000
  195,000
  190,000
  185,000
  180,000
  175,000
  170,000
  165,000
  160,000
            2000

                   2001

                          2002

                                 2003

                                        2004

                                               2005

                                                      2006

                                                             2007

                                                                    2008

                                                                           2009

                                                                                  2010

                                                                                           2011

                                                                                                  2012

                                                                                                         2013

                                                                                                                2014

                                                                                                                       2015

                                                                                                                              2016

                                                                                                                                     2017

                                                                                                                                            2018

                                                                                                                                                   2019

                                                                                                                                                          2020*

                                                                                                                                        *Through September

Sources: NYS Department of Labor, Current Employment Statistics; OSC analysis

                                                                                  8
Half of the industry jobs in New York State              Securities industry employment in New Jersey
outside of New York City in 2019 were located in         has fallen precipitously since the 2007 financial
Nassau, Suffolk and Westchester counties, with           crisis. The industry has contracted by 29 percent
the rest concentrated in the metropolitan areas          since 2007 (or 15,400 jobs), a much larger
around Albany, Buffalo, Rochester and Syracuse.          contraction than in New York City and a larger
Industry employment outside of New York City             loss than in any other state. The five states with
has also declined since 2007, falling by 5 percent       the largest industry job gains since 2007 include
(1,000 jobs) to 19,900 in 2019.                          Texas (26,400), Pennsylvania (17,200), North
                                                         Carolina (8,700) Arizona (8,100) and Colorado
                                                         (7,700).3

                                                         3 The report used data from the U.S. Bureau of Labor Statistics
                                                         Quarterly Census of Employment and Wages series for this
                                                         analysis, since data for the securities industry was not available for
                                                         all 50 states from the Current Employment Survey.

                                                     9
Bonuses
Compensation practices in the securities industry                                                                           Despite the increase last year, the bonus pool
before the 2007 financial crisis encouraged                                                                                 and average bonuses remain below the record
excessive risk-taking. Since then, new                                                                                      level in 2017, when the bonus pool was boosted
regulations and guidelines have changed the                                                                                 by changes in federal tax law that encouraged
way compensation is paid. Base salaries are                                                                                 taxpayers to shift income into 2017 from future
higher, larger shares of bonuses are deferred                                                                               years, as well as a 2008 federal law that required
to future years, and bonuses can be clawed                                                                                  the repatriation of deferred compensation held
back if performance targets are not achieved.                                                                               overseas by the end of 2017.
Nonetheless, the securities industry accounted
for more than half (52 percent) of all private                                                                              The securities industry increased the amount set
sector bonus payments and one-fifth of wages in                                                                             aside for compensation by almost 5 percent in
New York City in 2019, even though it made up                                                                               the first half of 2020. The size of 2020 bonuses
less than 5 percent of private sector employment.                                                                           will depend heavily on economic activity in the
                                                                                                                            second half of the year. As the larger securities
In March 2020, the Office of the State                                                                                      businesses are embedded within bank holding
Comptroller (OSC) estimated that the bonus pool                                                                             companies where profitability has been declining,
for industry employees in New York City during                                                                              the overall bonus pool is likely to be affected.
the traditional December-March bonus season                                                                                 An August report by Johnson Associates (a
had increased by 3 percent to $29.3 billion (see                                                                            compensation consulting firm) suggests that
Figure 11). OSC’s bonus estimate includes                                                                                   management and staff bonuses for 2020 could
bonuses paid for work performed in 2019, as well                                                                            fall by as much as 15 percent to 20 percent,
as bonuses deferred from prior years.                                                                                       offsetting the increase in product areas (i.e.,
                                                                                                                            investment banking, sales and trading).
The average bonus paid to industry employees
in New York City increased in 2019 by 3 percent                                                                             The City has not updated its estimates from
to $164,100 (see Figure 11). The increase                                                                                   earlier in the year, which forecasted that bonuses
was similar to the increase in the bonus pool.                                                                              would decline by more than a third (34 percent)
Bonuses accounted for an estimated 40 percent                                                                               in 2020. Declines of larger magnitudes occurred
of securities industry wages, a larger share than                                                                           only during the last two recessions. In March
in any other major industry in the City.                                                                                    2021, OSC will release its 2020 bonus estimate
                                                                                                                            for industry employees in New York City based
FIGURE 11                                                                                                                   on tax withholding trends.
Securities Industry Bonuses in New York City
                                                       Bonus Pool                                                                                                             Average Bonus
                      40                                                                                                                           225
                                                       Bonus Pool                    Inflation-Adjusted                                                                        Average Bonus                        Inflation-Adjusted
                      35                                                                                                                           200
                                                                                                                            Thousands of Dollars
Billions of Dollars

                      30                                                                                                                           175
                      25
                                                                                                                                                   150
                      20
                                                                                                                                                   125
                      15
                                                                                                                                                   100
                      10
                      5                                                                                                                            75

                      0                                                                                                                            50
                           2007

                                  2008

                                         2009

                                                2010

                                                        2011

                                                               2012

                                                                      2013

                                                                             2014

                                                                                    2015

                                                                                           2016

                                                                                                  2017

                                                                                                         2018

                                                                                                                2019

                                                                                                                                                         2007

                                                                                                                                                                2008

                                                                                                                                                                       2009

                                                                                                                                                                              2010

                                                                                                                                                                                     2011

                                                                                                                                                                                            2012

                                                                                                                                                                                                   2013

                                                                                                                                                                                                          2014

                                                                                                                                                                                                                 2015

                                                                                                                                                                                                                        2016

                                                                                                                                                                                                                               2017

                                                                                                                                                                                                                                      2018

                                                                                                                                                                                                                                             2019

Sources: NYS Department of Labor, Current Employment Statistics; OSC analysis

                                                                                                                       10
Average Salaries
FIGURE 12
Securities Industry Average Salaries in New York City
                       600
                                           Average Salary          Inflation-Adjusted
                       500
Thousands of Dollars

                       400
                       300
                       200
                       100
                         0
                             2007

                                    2008

                                           2009

                                                  2010

                                                            2011

                                                                      2012

                                                                                  2013

                                                                                                           2014

                                                                                                                                2015

                                                                                                                                                      2016

                                                                                                                                                                           2017

                                                                                                                                                                                                    2018

                                                                                                                                                                                                                         2019
Sources: NYS Department of Labor, Quarterly Census of Employment and Wages; OSC analysis

In 2019, the average salary (including bonuses)                                   high average salary in New York reflects the
in New York City’s securities industry increased                                  concentration of highly compensated employees,
by 2 percent to $406,854 (see Figure 12), the                                     such as chief executive officers, in New York
highest average salary of any major industry in                                   City.
the City. It was almost twice the second-highest
average ($208,877 in the banking industry).                                       The Dodd-Frank Act requires publicly traded
Other industries with high average salaries                                       companies to report the ratio of the salary of their
include data processing ($198,866), investment                                    chief executive officer to the median salary of all
funds ($197,487) and company management                                           employees. According to 2019 data, the CEOs
($196,726).                                                                       of finance companies listed on the S&P 500 and
                                                                                  headquartered in New York State earned an
The average salary in the securities industry was                                 average of 216 times more than the median for
nearly five times (4.9) higher than the average                                   all company employees. This was much higher
in the rest of the private sector ($82,938; see                                   than the national average of 179 times more.
Figure 13).4 While the pay gap has narrowed
slightly since 2007 (when it peaked at six times                                  FIGURE 13
higher), it is much wider than in 1981, when the                                  Ratio of Average Salaries in the Cityʼs Securities
average salary in the securities industry was                                     Industry to the Rest of the Private Sector
twice the average in the rest of the private sector.                                          7
                                                                                              6
The average salary in the securities industry in                                              5
                                                                                  Pay Ratio

New York State was $390,019 in 2019, almost                                                   4
70 percent more than the average in the rest of                                               3
the nation ($231,982). Since 2007, the industry’s                                             2
average salary in New York has been higher                                                    1
than in any other state (previously, Connecticut                                              0
                                                                                                  1981
                                                                                                         1983
                                                                                                                1985
                                                                                                                       1987
                                                                                                                              1989
                                                                                                                                     1991
                                                                                                                                            1993
                                                                                                                                                   1995
                                                                                                                                                          1997
                                                                                                                                                                 1999
                                                                                                                                                                        2001
                                                                                                                                                                               2003
                                                                                                                                                                                      2005
                                                                                                                                                                                             2007
                                                                                                                                                                                                    2009
                                                                                                                                                                                                           2011
                                                                                                                                                                                                                  2013
                                                                                                                                                                                                                         2015
                                                                                                                                                                                                                                2017
                                                                                                                                                                                                                                       2019

had the highest average salary). The industry’s
                                                                                  Sources: NYS Department of Labor, Quarterly Census of
4 1981–1999 data is based on the Standard Industry                                Employment and Wages; OSC analysis
Classification. Data from 2000 onward is based on the North
American Industry Classification.

                                                                             11
In 2019 (the latest year for which data are             The counties surrounding the City also had
available), 27 percent of industry employees            relatively high average salaries for the industry.
who worked in the City had salaries of more than        In Westchester County, the average salary
$250,000, compared with 9 percent in the rest of        ($260,020) was among the highest of all
the nation.                                             industries in the county, despite a nearly 6
                                                        percent decline in 2019. The same was true for
In Manhattan, where 99 percent of New York              Long Island, where the average grew by more
City’s securities jobs are located, the average         than 2 percent, reaching $386,520 in 2019. Long
salary was $410,905 in 2019. In comparison, the         Island’s high average reflects the presence of
industry’s average salary in the outer boroughs         hedge-fund firms in Suffolk County. The county
was $123,227.                                           has an average industry salary of $621,368, the
                                                        highest of any county in the nation.

                                                   12
Work Force Characteristics
In 2019 (the latest year for which data are                Almost three-fifths of industry employees
available), 59 percent of the employees in New             were White, 22 percent were Asian American,
York City’s securities industry resided in the             9 percent were Hispanic and 7 percent were
City (see Figure 14). Commuters represented                African American. Immigrants (primarily from
41 percent of industry employees, the highest              Asia and Europe) made up over one-third
share among any major industry. One-fifth came             (35 percent) of the employees, a higher share
from New Jersey, 8 percent came from Long                  than in 2008 (29 percent), but lower than
Island and 5 percent came from Connecticut,                the immigrant share of all City employment
followed by Westchester County at 4 percent.               (40 percent).

FIGURE 14                                                  Two-thirds of the employees in the industry
Place of Residence                                         were men, a share that has remained relatively
Employees in New York Cityʼs Securities Industry           constant over the past decade. While 53 percent
                                                           of employees had earned a bachelor’s degree,
            Other                                          37 percent had an advanced degree (almost
             2%
                                                           twice the citywide share), up from 34 percent
 Rest of New                          New York City        in 2008. Employees in tech occupations made
 York State                               59%
     2%                                                    up 12 percent of the workers in the securities
                                                           industry.
  Long Island
      8%                                                   Besides direct employees, the securities industry
                                                           also enters into contracts with individuals (e.g.,
   Westchester
     County                                                financial advisors or sales agents). These self-
                                 New Jersey
       4%                           20%                    employed workers accounted for only a small
          Connecticut                                      share of the work force (less than 5 percent) in
              5%                                           2019. Compared with industry employees, self-
                                                           employed workers were less likely to earn more
Sources: U.S. Census Bureau; OSC analysis                  than $250,000. A larger share of these workers
While almost a quarter (22 percent) of City                lived in the City and a smaller share were
residents employed in the industry earned more             immigrants, and they were less likely to have
than $250,000, over half of the commuters from             advanced degrees.
Connecticut and Westchester earned more than
$250,000 (52 and 55 percent, respectively).
Commuters accounted for 48 percent of the
wages paid by the industry in New York City.

                                                      13
Economic Contribution
FIGURE 15
Securities Industry as Share of Gross State Product for Top Ten States, 2019
                          10%
 Share of Gross Product

                          8%

                          6%

                          4%

                          2%

                          0%
                                New York

                                           Connecticut

                                                         Ma ssachusetts

                                                                          Delaware

                                                                                     New Hampshire

                                                                                                          Rhode Island

                                                                                                                         Illinois

                                                                                                                                    New Jersey

                                                                                                                                                 Misso uri

                                                                                                                                                             California
Sources: U.S. Bureau of Economic Analysis; OSC analysis

In 2018, the securities industry was responsible                                                     The high incomes earned by many industry
for more than 17 percent of all economic activity                                                    employees create economic activity in other
in the City, according to the New York City Office                                                   employment sectors. Using IMPLAN, an
of Management and Budget. While this share                                                           economic modeling software, OSC estimates
was lower than the industry’s prerecession share                                                     that 1 in 10 jobs in New York City and 1 in 15
(25 percent), it was higher than in any other                                                        jobs in New York State are associated with the
industry.                                                                                            securities industry. OSC also estimates that each
                                                                                                     job gained or lost in the industry leads to the
The securities industry makes up a large share                                                       creation or loss of three additional jobs in other
of the State’s economy. In total, the securities                                                     industries in the State.
industry in 2019 accounted for 5.9 percent of the
State’s economy, according to the U.S. Bureau of
Economic Analysis (see Figure 15). This is down
from a peak of 8.2 percent in 2006, but remains
(since 1997) well above other states. In 2019,
the states with the next-largest shares were
Connecticut (4.4 percent) and Massachusetts
(3.2 percent). All other states’ financial sectors
make up less than 3 percent of their economies
(with the majority at less than 1 percent)

                                                                                      14
The securities industry is a major source of tax                                                                                                     New York State
revenue for the State and the City. Firms pay
business taxes on their profits, and employees                                                                                                       New York State depends on Wall Street tax
pay personal income taxes on their salaries and                                                                                                      revenues even more than the City, because
bonuses. Nonwage income derived from the                                                                                                             the State relies more heavily on revenue from
industry’s activities, such as capital gains, also                                                                                                   personal income taxes and does not levy a
generate personal income tax revenue.                                                                                                                general real property tax. As a result, the industry
                                                                                                                                                     accounted for an estimated 18 percent of total
                                                                                                                                                     tax collections in State Fiscal Year (SFY) 2019-
New York City                                                                                                                                        20 (see Figure 16).
OSC estimates that tax collections attributable
                                                                                                                                                     OSC estimates that tax payments attributable to
to the industry decreased by 5 percent to
                                                                                                                                                     the securities industry in SFY 2019-20 increased
$3.9 billion in City Fiscal Year (CFY) 2020
                                                                                                                                                     by 15 percent to $15.1 billion. The difference
(see Figure 16), which ended June 30, 2020,
                                                                                                                                                     between the State’s and the City’s trends is
reflecting a decline in jobs and capital gains that
                                                                                                                                                     attributable to timing differences between the
offset higher profits.5 The industry accounted for
                                                                                                                                                     City and State fiscal years and to taxpayers
an estimated 6 percent of City tax collections in
                                                                                                                                                     delaying payments from the previous fiscal year
CFY 2020, down from 7 percent in the prior year
                                                                                                                                                     to SFY 2019-20 in response to federal tax law
and the lowest level since 2004, as the City’s
                                                                                                                                                     changes.
economy has become more diversified.

FIGURE 16
Securities Industry-Related Tax Payments
                                                      New York City                                                                                                                                           New York State
                                    Tax Payments (left axis)                       Share (right axis)                                                                                        Tax Payments (l eft axis)                               Share (right axis)
                      5                                                                                        15                                                             16                                                                                                   28

                                                                                                                                                                                                                                                                                        Percentage of Tax Revenue
                                                                                                                    Percentage of Tax Revenue

                                                                                                                                                                              14                                                                                                   24
                      4                                                                                        12
                                                                                                                                                     Bil l ions of Doll ars
Billions of Dollars

                                                                                                                                                                              12                                                                                                   20
                      3                                                                                        9                                                              10
                                                                                                                                                                                                                                                                                   16
                                                                                                                                                                              8
                                                                                                                                                                                                                                                                                   12
                      2                                                                                        6                                                              6
                                                                                                                                                                                                                                                                                   8
                                                                                                                                                                              4
                      1                                                                                        3                                                                                                                                                                   4
                                                                                                                                                                              2
                                                                                                                                                                              0                                                                                                    0
                      0                                                                                        0
                                                                                                                                                                                   97-98

                                                                                                                                                                                           99-00

                                                                                                                                                                                                   01-02

                                                                                                                                                                                                           03-04

                                                                                                                                                                                                                   05-06

                                                                                                                                                                                                                           07-08

                                                                                                                                                                                                                                   09-10

                                                                                                                                                                                                                                           11-12

                                                                                                                                                                                                                                                   13-14

                                                                                                                                                                                                                                                           15-16

                                                                                                                                                                                                                                                                   17-18

                                                                                                                                                                                                                                                                           19-20
                          1998

                                 2000

                                        2002

                                               2004

                                                       2006

                                                              2008

                                                                     2010

                                                                            2012

                                                                                   2014

                                                                                          2016

                                                                                                 2018

                                                                                                        2020

                                                        City Fiscal Year                                                                                                                                           State Fiscal Year

Sources: NYS Department of Labor, Current Employment Statistics; OSC analysis

5 These estimates exclude revenue from real property taxes, real
  estate transaction taxes and sales taxes because OSC is unable
  to identify the securities industry’s share of those tax payments.

                                                                                                                                                15
Contact
Office of the New York State Comptroller
110 State Street
Albany, New York 12236
(518) 474-4044
www.osc.state.ny.us

Prepared by the Office of the State Deputy Comptroller for the City of New York

Like us on Facebook at facebook.com/nyscomptroller
Follow us on Twitter @nyscomptroller
You can also read