Derived telemetry-based electrocardiograms in the intensive care unit: insights from a COVID-19 epicenter - Authorea

Page created by Frank Sanchez
 
CONTINUE READING
Derived telemetry-based electrocardiograms in the intensive care unit: insights from a COVID-19 epicenter - Authorea
Posted on Authorea 10 Jun 2020 — The copyright holder is the author/funder. All rights reserved. No reuse without permission. — https://doi.org/10.22541/au.159181121.14843689 — This a preprint and has not been peer reviewed. Data may be preliminary.

                                                                                                                                                                                                                                                            Derived telemetry-based electrocardiograms in the intensive care
                                                                                                                                                                                                                                                            unit: insights from a COVID-19 epicenter
                                                                                                                                                                                                                                                            Ellie Coromilas1 , Daniel Pugliese1 , Stephanie Kochav1 , Hirad Yarmohammadi1 , Elaine
                                                                                                                                                                                                                                                            Wan2 , and Jose Dizon1
                                                                                                                                                                                                                                                            1
                                                                                                                                                                                                                                                                Columbia University
                                                                                                                                                                                                                                                            2
                                                                                                                                                                                                                                                                Columbia University Medical Center

                                                                                                                                                                                                                                                            June 10, 2020

                                                                                                                                                                                                                                                            Abstract
                                                                                                                                                                                                                                                            Introduction: Severely ill inpatients with SARS-CoV-2 infection, Coronavirus Disease 2019 (COVID-19) require close electro-
                                                                                                                                                                                                                                                            cardiographic (ECG) monitoring due to frequent cardiac involvement of the disease and cardiovascular side effects of therapies.
                                                                                                                                                                                                                                                            This study aimed to compare ECG parameters measured from conventional 12-lead ECGs to those from a telemetry-generated
                                                                                                                                                                                                                                                            7-lead or single lead ECG to determine if the latter may be an alternative for screening and monitoring patients, particularly
                                                                                                                                                                                                                                                            during a pandemic. Methods and Results: We identified 33 patients with respiratory failure due to COVID-19 undergoing
                                                                                                                                                                                                                                                            telemetry monitoring in the intensive care unit. Each received a 12-lead ECG utilizing standard lead placement. A concurrent
                                                                                                                                                                                                                                                            7-lead ECG and single lead (lead II) tracing were obtained using the central telemetry system. Each ECG was interpreted
                                                                                                                                                                                                                                                            and intervals manually measured by 2 cardiologists with disagreements adjudicated by a third. Compared to the 12-lead ECG
                                                                                                                                                                                                                                                            measurement, the 7-lead ECG underestimated the corrected QT by on average 13.45±32.05 msec, and the single lead ECG
                                                                                                                                                                                                                                                            underestimated corrected QT by 19.62±33.19 msec (Bazett, p < 0.05). Bland Altman analysis also demonstrated evidence
                                                                                                                                                                                                                                                            of a positive bias, suggesting that the telemetry-derived tracings underestimated the QT interval. The presence of T wave
                                                                                                                                                                                                                                                            abnormalities and ST segment changes were overestimated by the telemetry-derived tracings as compared to standard ECGs.
                                                                                                                                                                                                                                                            Conclusion: Though telemetry-derived ECGs may be useful in screening patients for significant ECG abnormalities, they likely
                                                                                                                                                                                                                                                            do not represent a reliable replacement of the standard 12-lead ECG in the routine diagnosis and management of critically ill
                                                                                                                                                                                                                                                            patients.

                                                                                                                                                                                                                                                            Introduction
                                                                                                                                                                                                                                                            Infection due to Severe Acute Respiratory Syndrome Coronavirus-2 (SARS-CoV-2) has infected over 5 mil-
                                                                                                                                                                                                                                                            lion people worldwide, resulting in over 300,000 deaths.1 The illness caused by SARS-CoV-2, Coronavirus
                                                                                                                                                                                                                                                            Disease 2019 (COVID-19) predominantly affects the respiratory system, however increasing data suggest
                                                                                                                                                                                                                                                            that cardiovascular involvement is common and associated with poor outcomes.2 Additionally, commonly
                                                                                                                                                                                                                                                            used therapies to treat COVID-19 may have unintended cardiovascular side effects such as cardiac arrhyth-
                                                                                                                                                                                                                                                            mias. Early in the pandemic, the treatment regimen of hydroxychloroquine and azithromycin had been
                                                                                                                                                                                                                                                            widely-adopted based on early studies suggesting improved clinical outcomes and viral clearance.3-5 Both of
                                                                                                                                                                                                                                                            these medications are known to prolong the QT interval, leading to concerns regarding an elevated risk of
                                                                                                                                                                                                                                                            arrhythmia, especially in patients with baseline electrocardiographic (ECG) abnormalities.6
                                                                                                                                                                                                                                                            Given the cardiac implications of both the infection, associated therapies, and underlying comorbid cardiovas-
                                                                                                                                                                                                                                                            cular conditions, many patients in the ICU require assessment and continued monitoring of ECG parameters
                                                                                                                                                                                                                                                            such as QT interval, ST segment changes, and QRS morphology, typically using a standard 12-lead ECG.
                                                                                                                                                                                                                                                            However, concerns regarding healthcare provider exposure to COVID-19 and limited availability of personal
                                                                                                                                                                                                                                                            protective equipment have led providers to seek alternative means to safely monitor patients while limiting

                                                                                                                                                                                                                                                                                                                          1
Derived telemetry-based electrocardiograms in the intensive care unit: insights from a COVID-19 epicenter - Authorea
the amount of time and number of caregivers entering a room. Current telemetry systems have the ability
                                                                                                                                                                                                                                                            to produce a multi-lead ECG that is mathematically derived utilizing fewer electrodes than the conventional
Posted on Authorea 10 Jun 2020 — The copyright holder is the author/funder. All rights reserved. No reuse without permission. — https://doi.org/10.22541/au.159181121.14843689 — This a preprint and has not been peer reviewed. Data may be preliminary.

                                                                                                                                                                                                                                                            12-lead ECG. It is unclear if derived technology may offer a safe and accurate means to assess and monitor
                                                                                                                                                                                                                                                            patients for ECG abnormalities or interval ECG changes while minimizing provider exposure to COVID-19.
                                                                                                                                                                                                                                                            This study aims to compare ECG parameters measured from conventional 12-lead ECG to those derived from
                                                                                                                                                                                                                                                            a telemetry-generated 7-lead or single lead tracing to determine if the latter may be a reasonable alternative
                                                                                                                                                                                                                                                            for screening and monitoring patients, particularly during a pandemic.
                                                                                                                                                                                                                                                            Methods
                                                                                                                                                                                                                                                            We identified individuals with respiratory failure due to COVID-19 infection who were undergoing telemetry
                                                                                                                                                                                                                                                            monitoring in the ICU and were planned to undergo evaluation with a 12-lead ECG. Subjects were included
                                                                                                                                                                                                                                                            in the study if they had 12-lead and 7-lead ECGs obtained within a single 24-hour period and confirmed
                                                                                                                                                                                                                                                            positive SARS-CoV-2 RT-PCR nasal swab. The study was approved by the Institutional Review Board at
                                                                                                                                                                                                                                                            Columbia University Irving Medical Center.
                                                                                                                                                                                                                                                            Each subject received a 12-lead ECG at standard (25mm/sec) speed and normal voltage, utilizing standard
                                                                                                                                                                                                                                                            lead placement (GE MAC 5500, GE Medical Systems, Milwaukee, WI). A 10 second 7-lead ECG and single
                                                                                                                                                                                                                                                            lead (lead II) tracing were also obtained from the central telemetry system (Philips Intellivue, Koninklijke
                                                                                                                                                                                                                                                            Philips Electronics, Netherlands). This system uses the EASI System that derives up to 7 leads from 5
                                                                                                                                                                                                                                                            electrodes positioned on the torso, including all 3 limb leads, 3 augmented leads, and 1 precordial lead
                                                                                                                                                                                                                                                            (typically lead V1).7
                                                                                                                                                                                                                                                            Each 12-lead standard ECG, 7-lead telemetry-derived ECG, and Lead II tracing was interpreted and
                                                                                                                                                                                                                                                            manually-measured by 2 independent cardiologists. Disagreements in reads were adjudicated by an inde-
                                                                                                                                                                                                                                                            pendent third reader. The qualitative assessment or quantitative measurement that was agreed upon by at
                                                                                                                                                                                                                                                            least 2 of the cardiologists was recorded as the final interpretation. Diagnoses evaluated included underlying
                                                                                                                                                                                                                                                            rhythm, QRS axis, cardiac intervals (RR interval, PR interval, QRS interval, and QT interval), conduction
                                                                                                                                                                                                                                                            abnormalities, the presence of T wave or ST segment abnormalities, and the presence of low voltage com-
                                                                                                                                                                                                                                                            plexes. Automated measurements by the ECG computer system for rate and common intervals were also
                                                                                                                                                                                                                                                            recorded. The QT interval was measured in 3 consecutive cycles on leads II, III, and the precordial leads (V5,
                                                                                                                                                                                                                                                            V6 when available) with the maximal interval taken. The end of the T wave was defined as the tangent from
                                                                                                                                                                                                                                                            the steepest last limb of the T wave to its intersection with the baseline. For irregular rhythms, a weighted
                                                                                                                                                                                                                                                            average RR interval was calculated.8 QT interval correction was calculated using commonly-used formulae:
                                                                                                                                                                                                                                                            Bazett, Fridericia, Framingham, and Hodges. QT dispersion was calculated as the difference between the
                                                                                                                                                                                                                                                            longest and shortest measured QT intervals on available leads. Significant ST segment changes were conside-
                                                                                                                                                                                                                                                            red to be more than 1mm of elevation or depression. Low voltage was considered any ECG where the QRS
                                                                                                                                                                                                                                                            was less than 5mm in all of the limb leads or 10mm in the precordial leads. Clinical information was obtained
                                                                                                                                                                                                                                                            from the electronic medical record including demographics, comorbid conditions, laboratory parameters, and
                                                                                                                                                                                                                                                            pertinent therapies.
                                                                                                                                                                                                                                                            Statistical analysis was performed using SAS version 9.4 (SAS Institute Inc., Cary, NC, USA). For continuous
                                                                                                                                                                                                                                                            variables, means and standard deviations were calculated. For categorical variables, frequency and percentage
                                                                                                                                                                                                                                                            were calculated. The differences in QT duration between the 12-lead ECG and both the derived 7-lead
                                                                                                                                                                                                                                                            ECG and single-lead telemetry were calculated using students t-test. Pearson’s correlation coefficients were
                                                                                                                                                                                                                                                            calculated between ECG measurement methods and scatter plots were generated. Bland-Altman analyses
                                                                                                                                                                                                                                                            were performed to evaluate agreement between measurement methods.9
                                                                                                                                                                                                                                                            Results
                                                                                                                                                                                                                                                            Thirty-three subjects were identified and included in the analysis. Patient demographics, medical history,
                                                                                                                                                                                                                                                            laboratory data and clinical features are provided in Table 1. Overall, the population was 42.4% female
                                                                                                                                                                                                                                                            with a mean age of 60.1 ± 14.1 years. Obesity and other cardiovascular comorbidities were common (e.g.
                                                                                                                                                                                                                                                            47.1% were obese with BMI>30, 63.6% had hypertension, 48.5% diabetes mellitus, and 12.1% had coronary

                                                                                                                                                                                                                                                                                                                  2
artery disease). The study population was critically ill with all subjects receiving mechanical ventilation,
                                                                                                                                                                                                                                                            approximately 66% receiving renal replacement therapy, and nearly 75% requiring vasopressors. The majority
Posted on Authorea 10 Jun 2020 — The copyright holder is the author/funder. All rights reserved. No reuse without permission. — https://doi.org/10.22541/au.159181121.14843689 — This a preprint and has not been peer reviewed. Data may be preliminary.

                                                                                                                                                                                                                                                            of patients were treated with hydroxychloroquine (78.8%) and azithromycin (81.8%).
                                                                                                                                                                                                                                                            The median amount of time between obtaining the 12-lead ECG and telemetry-derived ECG was 53 minutes
                                                                                                                                                                                                                                                            (range 3 minutes to 13 hours and 16 minutes). ECG parameters measured from each ECG method are
                                                                                                                                                                                                                                                            reported inTable 2 . The mean uncorrected QT interval in milliseconds (msec) for the group as a whole
                                                                                                                                                                                                                                                            was 398.6 ± 64.8, 401.2 ± 66.1, 388.2 ± 64.6 and 382.1 ± 60.7 by computer measurement on 12-lead,
                                                                                                                                                                                                                                                            manual measurement on 12-lead, 7-lead derived ECG, and telemetry lead II, respectively. Similarly, the
                                                                                                                                                                                                                                                            mean corrected QT interval by Bazett formula in msec was 474.2 ± 39.4, 467.5 ± 50.9, 454.1 ± 49.4 and
                                                                                                                                                                                                                                                            447.9 ± 47.3 by computer measurement on 12-lead, manual measurement on 12-lead, 7-lead derived ECG,
                                                                                                                                                                                                                                                            and telemetry lead II, respectively. These measurements for the entire group were statistically similar.Table
                                                                                                                                                                                                                                                            3 shows the mean individual differences in QT measurements between the manual 12-lead ECG and both
                                                                                                                                                                                                                                                            the 7-lead derived ECG and single-lead telemetry. The mean difference in measured QT was significantly
                                                                                                                                                                                                                                                            shorter on both the 7-lead and single lead derived ECGs compared with the 12-lead ECG (p value for all
                                                                                                                                                                                                                                                            comparisons
population. Though there was a strong linear correlation between the QT interval as measured on the different
                                                                                                                                                                                                                                                            tracings, the correlation was less robust when using the single-lead tracing. The method of using Pearson
Posted on Authorea 10 Jun 2020 — The copyright holder is the author/funder. All rights reserved. No reuse without permission. — https://doi.org/10.22541/au.159181121.14843689 — This a preprint and has not been peer reviewed. Data may be preliminary.

                                                                                                                                                                                                                                                            correlation only measures the magnitude of a relation between variables, and not the agreement between
                                                                                                                                                                                                                                                            two methods. Accordingly, one would expect a high magnitude of correlation when making measurements
                                                                                                                                                                                                                                                            of the same QT intervals. The Bland-Altman method of agreement plots is an established method for
                                                                                                                                                                                                                                                            quantifying agreement between two quantitative measurements. When we evaluated the agreement between
                                                                                                                                                                                                                                                            measurements of the QT intervals on a standard 12-lead ECG and telemetry-derived tracings, a positive bias
                                                                                                                                                                                                                                                            was found, suggesting that the telemetry tracings tend to underestimate the “true” QT interval, as defined
                                                                                                                                                                                                                                                            by the manually-measured QT on a standard 12-lead ECG. This finding was also demonstrated when we
                                                                                                                                                                                                                                                            averaged the individual differences between the corrected QT intervals on derived leads and the manual 12
                                                                                                                                                                                                                                                            lead measurement, with an underestimation of QT interval by both derived measurements and a significantly
                                                                                                                                                                                                                                                            lower value by the single lead method. We observed differences in measurements often between 25 and 50
                                                                                                                                                                                                                                                            msec, and up to 110 msec when using the single lead tracing.
                                                                                                                                                                                                                                                            There was significantly decreased QT dispersion when using the telemetry derived 7-lead ECG, which is
                                                                                                                                                                                                                                                            likely explained by fewer leads available for measurement. This finding may account for the tendency to
                                                                                                                                                                                                                                                            underestimate the QT interval when using the telemetry-derived ECGs, and is consistent with other studies
                                                                                                                                                                                                                                                            that have attempted to identify alternative means to monitor patients during the COVID pandemic. When
                                                                                                                                                                                                                                                            comparing the use of a handheld ECG device to a standard 12-lead ECG to assess QT intervals, Cheung, et
                                                                                                                                                                                                                                                            al. concluded that while QT was similar when the device was used across multiple positions, interpretation
                                                                                                                                                                                                                                                            of a single lead consistently led to underestimation of the QT interval.10
                                                                                                                                                                                                                                                            Expert guidance has suggested that the risk of treatment with hydroxychloroquine and azithromycin may
                                                                                                                                                                                                                                                            outweigh the benefit in patients with a QT interval longer than 500msec.11 Given a mean baseline QTc
                                                                                                                                                                                                                                                            interval of 467msec, variance in the measured QT interval of the magnitude suggested in our cohort may
                                                                                                                                                                                                                                                            lead to inappropriate treatment with QT-prolonging medications.
                                                                                                                                                                                                                                                            Other studies have suggested that mobile cardiac outpatient telemetry may be used for QT and arrhythmia
                                                                                                                                                                                                                                                            monitoring during the COVID pandemic.12, 13 However, these studies did not compare data to the standard
                                                                                                                                                                                                                                                            12-lead ECG, and our findings are consistent with a prior study comparing QTc measurements using single
                                                                                                                                                                                                                                                            lead portable ECG devices and 12-lead ECG.14 A multi-lead tracing may allow for increased diagnostic
                                                                                                                                                                                                                                                            accuracy. Prior comparisons of telemetry-derived ECGs and 12-lead ECGs also found moderate correlation
                                                                                                                                                                                                                                                            between QTc measurements using these modalities, though had conflicting conclusions as to whether or
                                                                                                                                                                                                                                                            not the telemetry-derived ECGs offered an acceptable alternative to the standard ECG.15, 16 None of these
                                                                                                                                                                                                                                                            comparisons assessed the ability of these alternative ECG monitors to assess other ECG parameters such as
                                                                                                                                                                                                                                                            morphology or ST segment changes.
                                                                                                                                                                                                                                                            In our analysis, there was acceptable agreement in diagnoses among the different ECG modalities, though
                                                                                                                                                                                                                                                            with some notable limitations. Although in general there was agreement in the QRS axis, 3 (9.09%) subjects
                                                                                                                                                                                                                                                            with normal axis were incorrectly identified as having a rightward or northwest axis using the 7-lead derived
                                                                                                                                                                                                                                                            ECG. This may be attributable to inconsistent telemetry electrode placement leading to systematic error in
                                                                                                                                                                                                                                                            the mathematical derivation.
                                                                                                                                                                                                                                                            There was a suggestion of decreased sensitivity for identifying low voltage QRS complexes on the 7-lead
                                                                                                                                                                                                                                                            and single lead ECGs, which may be due to the lack of precordial leads for interpretation. Conversely, a
                                                                                                                                                                                                                                                            larger number of subjects were identified as having T wave inversion or ST segment changes on the 7-lead or
                                                                                                                                                                                                                                                            single-lead ECG than on the standard 12-lead ECG. This finding is not consistent with prior comparisons
                                                                                                                                                                                                                                                            of the ESAI configuration with a standard 12-lead ECG, which found comparable incidence and location of
                                                                                                                                                                                                                                                            ST segment changes in the setting of acute MI.17
                                                                                                                                                                                                                                                            Our findings suggest that single lead tracings are quite limited and may not be an adequate replacement for
                                                                                                                                                                                                                                                            traditional ECG monitoring given the inability to define axis or morphology, a high likelihood of underesti-
                                                                                                                                                                                                                                                            mating the QT interval, and overestimation of ST segment changes. Although utilizing a 7-lead tracing may
                                                                                                                                                                                                                                                            allow additional accuracy, there were still significant limitations in interval measurement and the identifica-

                                                                                                                                                                                                                                                                                                                  4
tion of morphologic changes. We did not evaluate serial changes on telemetry derived ECGs, however our
                                                                                                                                                                                                                                                            results call into question whether changes in QT intervals can be reliably monitored with telemetry-derived
Posted on Authorea 10 Jun 2020 — The copyright holder is the author/funder. All rights reserved. No reuse without permission. — https://doi.org/10.22541/au.159181121.14843689 — This a preprint and has not been peer reviewed. Data may be preliminary.

                                                                                                                                                                                                                                                            ECGs. Based on our results, it appears prudent that a baseline 12-lead ECG should be performed, as well
                                                                                                                                                                                                                                                            as a new 12-lead after any dose change of QT prolonging drug or significant clinical event.
                                                                                                                                                                                                                                                            Our study has several strengths in its methodology. We rigorously evaluated the ECG measurements by ha-
                                                                                                                                                                                                                                                            ving two independent readers with disagreements adjudicated by a third reader. This study was performed
                                                                                                                                                                                                                                                            in a real-world setting; we included consecutive admissions to two cardiac care units and did not exclude any
                                                                                                                                                                                                                                                            12-lead ECGs or telemetry ECGs if they were readable. Our statistical approach used multiple validated me-
                                                                                                                                                                                                                                                            thods for assessing the agreement between our measurements, including use of the Bland-Altman agreement
                                                                                                                                                                                                                                                            plots to quantify and visualize differences between pairs of measurements. While this study was motivated
                                                                                                                                                                                                                                                            by a novel use of the ICU telemetry system during the time of a pandemic, it has broader implications for the
                                                                                                                                                                                                                                                            use of the telemetry system as a replacement for routine electrocardiograms in a wide array of cardiovascular
                                                                                                                                                                                                                                                            and acute care conditions.
                                                                                                                                                                                                                                                            There are several limitations to this study. Though attempts were made to collect ECG and telemetry strips
                                                                                                                                                                                                                                                            at close intervals, not all of the tracings were performed simultaneously, which may lead to minor differences
                                                                                                                                                                                                                                                            in morphology and intervals among ECG and telemetry strips. Additionally, variation in telemetry electrode
                                                                                                                                                                                                                                                            placement may lead to error in the mathematical formulas used to derive the telemetry ECG, and correct
                                                                                                                                                                                                                                                            electrode placement could not be verified although ICU staff are well trained in correct lead placement.
                                                                                                                                                                                                                                                            Finally, the current study only assesses for differences between ECG parameters at one point in time. We
                                                                                                                                                                                                                                                            did not assess serial ECGs in the same patient, thus our results cannot be extrapolated to the utilization of
                                                                                                                                                                                                                                                            telemetry-derived ECGs to monitor for changes in intervals or morphology.
                                                                                                                                                                                                                                                            Conclusion
                                                                                                                                                                                                                                                            The present study suggests that the use of telemetry-derived ECGs may lead to underestimation of the
                                                                                                                                                                                                                                                            true QT interval and presence of low voltage QRS, while overestimating the presence of T wave and ST
                                                                                                                                                                                                                                                            segment abnormalities. While telemetry-derived ECGs may be useful in screening patients for significant
                                                                                                                                                                                                                                                            ECG abnormalities, they likely do not represent a reliable replacement for the standard 12-lead ECG in the
                                                                                                                                                                                                                                                            routine diagnosis and management of critically ill patients.
                                                                                                                                                                                                                                                            References:
                                                                                                                                                                                                                                                            1. Coronavirus Disease 2019 (COVID-19) Situation Report 124. 2020; https://www.who.int/docs/default-
                                                                                                                                                                                                                                                            source/coronaviruse/situation-reports/20200523-covid-19-sitrep-124.pdf?sfvrsn=9626d639 2, Accessed May
                                                                                                                                                                                                                                                            24, 2020.
                                                                                                                                                                                                                                                            2. Driggin E, Madhavan MV, Bikdeli B, Chuich T, Laracy J, Bondi-Zoccai G, Brown TS, Nigoghossian C,
                                                                                                                                                                                                                                                            Zidar DA, Haythe J, Brodie D, Beckman JA, Kirtane AJ, Stone GW, Krumholz HM and Parikh SA. Car-
                                                                                                                                                                                                                                                            diovascular Considerations for Patients, Health Care Workers, and Health Systems During the Coronavirus
                                                                                                                                                                                                                                                            Disease 2019 (COVID-19) Pandemic. J Am Coll Cardiol . 2020.
                                                                                                                                                                                                                                                            3. Colson P, Rolain JM, Lagier JC, Brouqui P and Raoult D. Chloroquine and hydroxychloroquine as
                                                                                                                                                                                                                                                            available weapons to fight COVID-19. Int J Antimicrob Agents . 2020:105932.
                                                                                                                                                                                                                                                            4. Gao J, Tian Z and Yang X. Breakthrough: Chloroquine phosphate has shown apparent efficacy in treatment
                                                                                                                                                                                                                                                            of COVID-19 associated pneumonia in clinical studies. Biosci Trends . 2020;14:72-73.
                                                                                                                                                                                                                                                            5. Gautret P, Lagier JC, Parola P, Hoang VT, Meddeb L, Mailhe M, Doudier B, Courjon J, Giordanengo V,
                                                                                                                                                                                                                                                            Vieira VE, Dupont HT, Honore S, Colson P, Chabriere E, La Scola B, Rolain JM, Brouqui P and Raoult D.
                                                                                                                                                                                                                                                            Hydroxychloroquine and azithromycin as a treatment of COVID-19: results of an open-label non-randomized
                                                                                                                                                                                                                                                            clinical trial. Int J Antimicrob Agents . 2020:105949.
                                                                                                                                                                                                                                                            6. Szekely Y LY, Shrkihe BA, Bruck H, Oster HS, Viskin S. Chloroquine-induced torsade de pointes in a
                                                                                                                                                                                                                                                            COVID-19 patient.Heart Rhythm . 2020.

                                                                                                                                                                                                                                                                                                                  5
7. Dower GE, Yakush A, Nazzal SB, Jutzy RV and Ruiz CE. Deriving the 12-lead electrocardiogram from
                                                                                                                                                                                                                                                            four (EASI) electrodes. J Electrocardiol . 1988;21 Suppl:S182-7.
Posted on Authorea 10 Jun 2020 — The copyright holder is the author/funder. All rights reserved. No reuse without permission. — https://doi.org/10.22541/au.159181121.14843689 — This a preprint and has not been peer reviewed. Data may be preliminary.

                                                                                                                                                                                                                                                            8. Ehlert FA, Goldberger JJ, Rosenthal JE and Kadish AH. Relation between QT and RR intervals during
                                                                                                                                                                                                                                                            exercise testing in atrial fibrillation. Am J Cardiol . 1992;70:332-8.
                                                                                                                                                                                                                                                            9. Bland JM and Altman DG. Statistical methods for assessing agreement between two methods of clinical
                                                                                                                                                                                                                                                            measurement. Lancet . 1986;1:307-10.
                                                                                                                                                                                                                                                            10. Cheung CC DB, Gibbs K, Laksma ZW, Krahn AD. Multi-lead QT Screening is Necessary for QT
                                                                                                                                                                                                                                                            measurement: Implications for Management of Patients in the COVID-19 Era. JACC Clin Electrophysiol .
                                                                                                                                                                                                                                                            2020.
                                                                                                                                                                                                                                                            11. HRS COVID-19 Task Force Update: April 7, 2020. 2020.
                                                                                                                                                                                                                                                            12. Chang D, Saleh M, Gabriels J, Ismail H, Goldner B, Willner J, Beldner S, Mitra R, John R and Epstein
                                                                                                                                                                                                                                                            LM. Inpatient Use of Ambulatory Telemetry Monitors for COVID-19 Patients Treated with Hydroxychloro-
                                                                                                                                                                                                                                                            quine and/or Azithromycin. J Am Coll Cardiol . 2020.
                                                                                                                                                                                                                                                            13. Gabriels J, Saleh M, Chang D and Epstein LM. Inpatient use of mobile continuous telemetry for COVID-
                                                                                                                                                                                                                                                            19 patients treated with hydroxychloroquine and azithromycin. HeartRhythm Case Rep . 2020.
                                                                                                                                                                                                                                                            14. Bekker CL, Noordergraaf F, Teerenstra S, Pop G and van den Bemt BJF. Diagnostic accuracy of a single-
                                                                                                                                                                                                                                                            lead portable ECG device for measuring QTc prolongation. Ann Noninvasive Electrocardiol . 2020;25:e12683.
                                                                                                                                                                                                                                                            15. Janssen GH, Rijkenberg S and van der Voort PH. Validation of continuous QTc measurement in critically
                                                                                                                                                                                                                                                            ill patients. J Electrocardiol . 2016;49:81-6.
                                                                                                                                                                                                                                                            16. Chenoweth JA, Hougham AM, Colby DK, Ford JB, Sandhu J, Albertson TE and Sutter ME. Monitoring
                                                                                                                                                                                                                                                            the corrected QT in the acute care setting: A comparison of the 12lead ECG and bedside monitor. Am J
                                                                                                                                                                                                                                                            Emerg Med . 2018;36:777-779.
                                                                                                                                                                                                                                                            17. Drew BJ, Adams MG, Pelter MM and Wung SF. ST segment monitoring with a derived 12-lead electro-
                                                                                                                                                                                                                                                            cardiogram is superior to routine cardiac care unit monitoring. Am J Crit Care . 1996;5:198-206.
                                                                                                                                                                                                                                                            Table 1. Subject Characteristics

                                                                                                                                                                                                                                                                                    Demographics
                                                                                                                                                                                                                                                                                    Age, years (mean ± SD)                60.09 ± 14.05
                                                                                                                                                                                                                                                                                    Female Sex, N (%)                     14 (42.42%)
                                                                                                                                                                                                                                                                                    BMI (mean ± SD)                       29.97 ± 7.00
                                                                                                                                                                                                                                                                                    Comorbidities
                                                                                                                                                                                                                                                                                    Hypertension, N (%)                   21 (63.64%)
                                                                                                                                                                                                                                                                                    Hyperlipidemia, N (%)                 14 (42.42%)
                                                                                                                                                                                                                                                                                    Diabetes, N (%)                       16 (48.48%)
                                                                                                                                                                                                                                                                                    COPD/Asthma, N (%)                    5 (15.15%)
                                                                                                                                                                                                                                                                                    Chronic Kidney Disease, N (%)         10 (30.30%)
                                                                                                                                                                                                                                                                                    Coronary Artery Disease, N (%)        4 (12.12%)
                                                                                                                                                                                                                                                                                    Congestive Heart Failure , N (%)      7 (21.21%)
                                                                                                                                                                                                                                                                                    Laboratory Values
                                                                                                                                                                                                                                                                                    WBC Count (cells/uL)                  13.65 ± 11.22
                                                                                                                                                                                                                                                                                    Creatinine (mg/dL)                    3.27 ± 2.47
                                                                                                                                                                                                                                                                                    Ferritin (ng/mL)                      1992.24 ± 1807.34
                                                                                                                                                                                                                                                                                    C-Reactive Protein (mg/L)             202.16 ± 101.37
                                                                                                                                                                                                                                                                                    ESR (mm/hr)                           84.30 ± 28.29
                                                                                                                                                                                                                                                                                    D-dimer (ug/mL)                       8.26 ± 6.67
                                                                                                                                                                                                                                                                                    Lactate Dehydrogenase (U/L)           715.30 ± 869.22

                                                                                                                                                                                                                                                                                                               6
High Sensitivity Troponin-T (ng/L)      116.47 ± 158.19
                                                                                                                                                                                                                                                                                     Clinical Features
Posted on Authorea 10 Jun 2020 — The copyright holder is the author/funder. All rights reserved. No reuse without permission. — https://doi.org/10.22541/au.159181121.14843689 — This a preprint and has not been peer reviewed. Data may be preliminary.

                                                                                                                                                                                                                                                                                     Mechanical Ventilation, N (%)           33 (100.00%)
                                                                                                                                                                                                                                                                                     Renal Replacement Therapy, N (%)        11 (33.33%)
                                                                                                                                                                                                                                                                                     Vasopressor Requirement, N (%)          24 (72.73%)
                                                                                                                                                                                                                                                                                     Anti-arrhythmic use, N (%)              3 (9.09%)
                                                                                                                                                                                                                                                                                     Anticoagulation use, N (%)              8 (24.24%)
                                                                                                                                                                                                                                                                                     Hydroxychloroquine use, N (%)           26 (78.79%)
                                                                                                                                                                                                                                                                                     Azithromycin use, N (%)                 27 (81.82%)

                                                                                                                                                                                                                                                            Table 2. Results of Measurements

                                                                                                                                                                                                                                                                                              12-lead ECG Manual Measurement                12-lead ECG Computer Measurement             7
                                                                                                                                                                                                                                                            Rate (beats/min)                  85.49 ±22.35                                  86.03 ± 22.72                                8
                                                                                                                                                                                                                                                            RR (msec)                         756.30 ± 231.27                                                                            7
                                                                                                                                                                                                                                                            QRS duration (msec)               95.45 ± 21.08                                 93.76 ± 21.12                                9
                                                                                                                                                                                                                                                            PR duration (msec)                166.45 ± 26.02                                158.40 ± 33.44                               1
                                                                                                                                                                                                                                                            QT interval (msec)                401.21 ± 66.09                                398.60 ± 64.80                               3
                                                                                                                                                                                                                                                            Dispersion of QT (msec)           37.88 ± 16.73                                                                              2
                                                                                                                                                                                                                                                            QTc (Bazett) (msec)               467.49 ± 50.91                                464.15 ± 39.42                               4
                                                                                                                                                                                                                                                            QTc (Fredericia) (msec)           442.82 ± 47.88                                                                             4
                                                                                                                                                                                                                                                            QTc (Hodges) (msec)               445.82 ± 48.52                                                                             4
                                                                                                                                                                                                                                                            QTc (Framingham) (msec)           438.74 ± 44.01                                                                             4

                                                                                                                                                                                                                                                            Table 3. Mean Differences in Manual QT and QTc Measurements

                                                                                                                                                                                                                                                                                                   Mean Difference between 12-lead ECG and 7-lead ECG               Mean Difference
                                                                                                                                                                                                                                                            Δ Υνςορρεςτεδ ΧΤ (μσες)                13.03   ±   31.87*                                               19.09   ±   33.67*
                                                                                                                                                                                                                                                            QTc (Bazett) (msec)                    13.45   ±   32.05*                                               19.62   ±   33.19*
                                                                                                                                                                                                                                                            Δ ΧΤς (Φρεδεριςια) (μσες)              13.02   ±   29.37*                                               19.22   ±   30.85*
                                                                                                                                                                                                                                                            Δ ΧΤς (Ηοδγες) (μσες)                  13.08   ±   26.97*                                               18.44   ±   28.40*
                                                                                                                                                                                                                                                            Δ ΧΤς (Φραμινγηαμ) (μσες)              10.73   ±   26.51*                                               16.74   ±   27.66*

                                                                                                                                                                                                                                                            * = p-value
Left bundle branch block, N (%)           1 (3.03%)         1 (3.03%)      –
                                                                                                                                                                                                                                                                Intraventricular Conduction
Posted on Authorea 10 Jun 2020 — The copyright holder is the author/funder. All rights reserved. No reuse without permission. — https://doi.org/10.22541/au.159181121.14843689 — This a preprint and has not been peer reviewed. Data may be preliminary.

                                                                                                                                                                                                                                                                Delay, N (%)                              2 (6.06%)         1 (3.03%)      4   (12.12%)
                                                                                                                                                                                                                                                                T Wave Inversion, N (%)                   11 (33.33%)       14 (42.42%)    9   (27.27%)
                                                                                                                                                                                                                                                                ST Elevation, N (%)                       0 (0.00%)         5 (15.15%)     2   (6.06%)
                                                                                                                                                                                                                                                                ST Depression, N (%)                      1 (3.03%)         4 (12.12%)     1   (3.03%)
                                                                                                                                                                                                                                                                Low Voltage QRS, N (%)                    7 (21.21%)        2 (6.06%)      1   (3.03%)

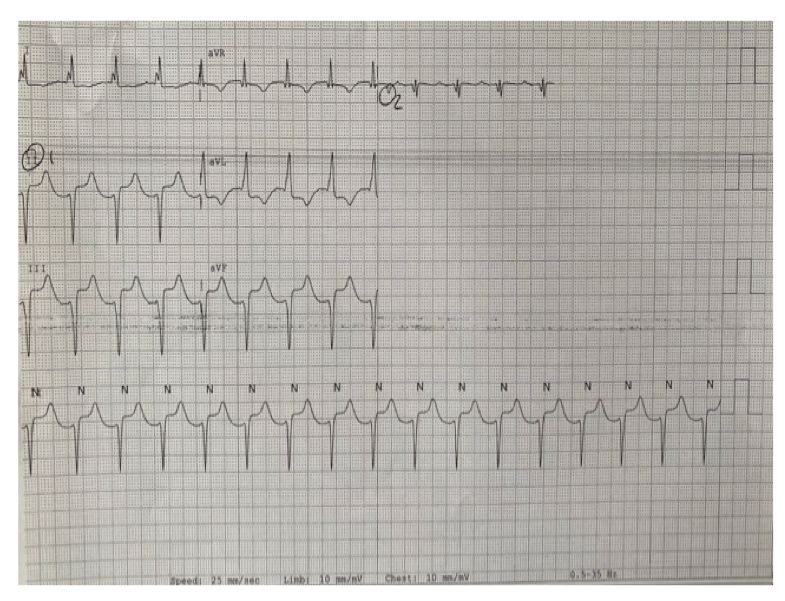
                                                                                                                                                                                                                                                            Figure 1. Examples of 12-Lead and 7-Lead ECG Tracings
                                                                                                                                                                                                                                                            Figure 1A represents a 12-lead ECG, with evidence of intraventricular conduction delay (IVCD) but no
                                                                                                                                                                                                                                                            significant ST segment changes; Figure 1B represents the 7-lead ECG of the same patient, however without
                                                                                                                                                                                                                                                            significant IVCD ad with 2-3mm ST segment elevation in the inferior leads and 1-2mm ST segment depression
                                                                                                                                                                                                                                                            in leads I and aVL.
                                                                                                                                                                                                                                                            Figure 1A

                                                                                                                                                                                                                                                            Figure 1B

                                                                                                                                                                                                                                                                                                               8
Posted on Authorea 10 Jun 2020 — The copyright holder is the author/funder. All rights reserved. No reuse without permission. — https://doi.org/10.22541/au.159181121.14843689 — This a preprint and has not been peer reviewed. Data may be preliminary.

                                                                                                                                                                                                                                                            Figure 2: Scatter plot with 95% prediction ellipse showing linear correlation between 12-lead ECG QT
                                                                                                                                                                                                                                                            measurement and telemetry QT measurement. Figure 2A Correlation between computer-measured QTc
                                                                                                                                                                                                                                                            (Bazett) and manually-measured QTc (Bazett) on 12-lead ECG;
                                                                                                                                                                                                                                                            Figure 2B Correlation between manually-measured QTc on 12-lead ECG and 7-lead derived ECG; Figure
                                                                                                                                                                                                                                                            2C Correlation between manually-measured QTc on 12-lead ECG and lead II telemetry.
                                                                                                                                                                                                                                                            Figure 2A

                                                                                                                                                                                                                                                            Figure 2B

                                                                                                                                                                                                                                                                                                             9
Posted on Authorea 10 Jun 2020 — The copyright holder is the author/funder. All rights reserved. No reuse without permission. — https://doi.org/10.22541/au.159181121.14843689 — This a preprint and has not been peer reviewed. Data may be preliminary.

                                                                                                                                                                                                                                                            Figure 2C

                                                                                                                                                                                                                                                            Figure 3. Bland-Altman plot demonstrating differences in between 12-lead QT measurement and teleme-
                                                                                                                                                                                                                                                            try QT measurement; Figure 3A. Bland-Altman Plot for differences in manually-measured corrected QT
                                                                                                                                                                                                                                                            (Bazett) on 12-lead ECG vs. 7-lead derived ECG.Figure 3B. Bland-Altman plot for differences in manually-
                                                                                                                                                                                                                                                            measured corrected QT (Bazett) on 12-lead ECG vs. Lead II Telemetry. In both plots, the solid blue line
                                                                                                                                                                                                                                                            represents no bias. Solid red line represents mean bias between all measurements. Dashed red line represents
                                                                                                                                                                                                                                                            ± 2 standard deviations from the mean. Dashed purple line represents ± 3 standard deviations from the
                                                                                                                                                                                                                                                            mean.
                                                                                                                                                                                                                                                            Figure 3A.

                                                                                                                                                                                                                                                                                                                10
Posted on Authorea 10 Jun 2020 — The copyright holder is the author/funder. All rights reserved. No reuse without permission. — https://doi.org/10.22541/au.159181121.14843689 — This a preprint and has not been peer reviewed. Data may be preliminary.

                                                                                                                                                                  Figure 3B.

                                                                                                                                          SUPPLEMENTAL MATERIAL

11
                                    computer-measured QT and manually-measured QT on 12-lead ECG
                                    Supplemental Figure 1A. Scatter Plot with 95% prediction ellipse showing linear correlation between
Posted on Authorea 10 Jun 2020 — The copyright holder is the author/funder. All rights reserved. No reuse without permission. — https://doi.org/10.22541/au.159181121.14843689 — This a preprint and has not been peer reviewed. Data may be preliminary.

                                                                                                                                                                                                                                                            Supplemental Figure 1B. Scatter Plot with 95% prediction ellipse showing linear correlation between
                                                                                                                                                                                                                                                            manually-measured QT on 12-lead ECG and 7-lead derived ECG

                                                                                                                                                                                                                                                            Supplemental Figure 1C. Scatter Plot with 95% prediction ellipse showing linear correlation between
                                                                                                                                                                                                                                                            manually-measured QT on 12-lead ECG and lead II telemetry

                                                                                                                                                                                                                                                                                                            12
Posted on Authorea 10 Jun 2020 — The copyright holder is the author/funder. All rights reserved. No reuse without permission. — https://doi.org/10.22541/au.159181121.14843689 — This a preprint and has not been peer reviewed. Data may be preliminary.

                                                                                                                                                                                                                                                            Supplemental Figure 1D. Scatter Plot with 95% prediction ellipse showing linear correlation between
                                                                                                                                                                                                                                                            manually-measured QTc (Hodges) on 12-lead ECG vs. 7-lead derived ECG.

                                                                                                                                                                                                                                                            Supplemental Figure 1E. Scatter Plot with 95% prediction ellipse showing linear correlation between
                                                                                                                                                                                                                                                            manually-measured QTc (Hodges) on 12-lead ECG and lead II telemetry.

                                                                                                                                                                                                                                                                                                            13
Posted on Authorea 10 Jun 2020 — The copyright holder is the author/funder. All rights reserved. No reuse without permission. — https://doi.org/10.22541/au.159181121.14843689 — This a preprint and has not been peer reviewed. Data may be preliminary.

                                                                                                                                                                                                                                                            Supplemental Figure 1F. Scatter Plot with 95% prediction ellipse showing linear correlation between
                                                                                                                                                                                                                                                            manually-measured QTc (Fredericia) on 12-lead ECG vs. 7-lead derived ECG.

                                                                                                                                                                                                                                                            Supplemental Figure 1G. Scatter Plot with 95% prediction ellipse showing linear correlation between
                                                                                                                                                                                                                                                            manually-measured QTc (Fredericia) on 12-lead ECG vs. lead II telemetry.

                                                                                                                                                                                                                                                                                                            14
Posted on Authorea 10 Jun 2020 — The copyright holder is the author/funder. All rights reserved. No reuse without permission. — https://doi.org/10.22541/au.159181121.14843689 — This a preprint and has not been peer reviewed. Data may be preliminary.

                                                                                                                                                                                                                                                            Supplemental Figure 2A. Bland-Altman plot for uncorrected QT on manually-measured vs. computer
                                                                                                                                                                                                                                                            measured 12-lead ECG. Solid blue line represents no bias. Solid red line represents mean bias between
                                                                                                                                                                                                                                                            all measurements. Dashed red line represents ± 2 standard deviations from the mean. Dashed purple line
                                                                                                                                                                                                                                                            represents ± 3 standard deviations from the mean.

                                                                                                                                                                                                                                                            Supplemental Figure 2B. Bland-Altman Plot for uncorrected QT on manually-measured 12-lead ECG
                                                                                                                                                                                                                                                            vs. 7-lead derived ECG. Solid blue line represents no bias. Solid red line represents mean bias between
                                                                                                                                                                                                                                                            all measurements. Dashed red line represents ± 2 standard deviations from the mean. Dashed purple line
                                                                                                                                                                                                                                                            represents ± 3 standard deviations from the mean.

                                                                                                                                                                                                                                                                                                              15
Posted on Authorea 10 Jun 2020 — The copyright holder is the author/funder. All rights reserved. No reuse without permission. — https://doi.org/10.22541/au.159181121.14843689 — This a preprint and has not been peer reviewed. Data may be preliminary.

                                                                                                                                                                                                                                                            Supplemental Figure 2C. Bland Altman-Plot for uncorrected QT on manually-measured 12-lead ECG
                                                                                                                                                                                                                                                            vs. lead II telemetry. Solid blue line represents no bias. Solid red line represents mean bias between all
                                                                                                                                                                                                                                                            measurements. Dashed red line represents ± 2 standard deviations from the mean. Dashed purple line
                                                                                                                                                                                                                                                            represents ± 3 standard deviations from the mean.

                                                                                                                                                                                                                                                            Supplemental Figure 2D. Bland-Altman Plot for QTc (Bazett) on manually-measured vs. computer
                                                                                                                                                                                                                                                            measured 12-lead ECG. Solid blue line represents no bias. Solid red line represents mean bias between
                                                                                                                                                                                                                                                            all measurements. Dashed red line represents ± 2 standard deviations from the mean. Dashed purple line
                                                                                                                                                                                                                                                            represents ± 3 standard deviations from the mean.

                                                                                                                                                                                                                                                                                                               16
Posted on Authorea 10 Jun 2020 — The copyright holder is the author/funder. All rights reserved. No reuse without permission. — https://doi.org/10.22541/au.159181121.14843689 — This a preprint and has not been peer reviewed. Data may be preliminary.

                                                                                                                                                                                                                                                            Supplemental Figure 2E. Bland-Altman Plot for QTc (Hodges) on manually-measured 12-lead ECG
                                                                                                                                                                                                                                                            vs. 7-lead derived ECG. Solid blue line represents no bias. Solid red line represents mean bias between
                                                                                                                                                                                                                                                            all measurements. Dashed red line represents ± 2 standard deviations from the mean. Dashed purple line
                                                                                                                                                                                                                                                            represents ± 3 standard deviations from the mean.

                                                                                                                                                                                                                                                            Supplemental Figure 2F. Bland-Altman plot for QTc (Hodges) on manually-measured 12-lead ECG
                                                                                                                                                                                                                                                            vs. Lead II telemetry. Solid blue line represents no bias. Solid red line represents mean bias between
                                                                                                                                                                                                                                                            all measurements. Dashed red line represents ± 2 standard deviations from the mean. Dashed purple line
                                                                                                                                                                                                                                                            represents ± 3 standard deviations from the mean.

                                                                                                                                                                                                                                                                                                              17
Posted on Authorea 10 Jun 2020 — The copyright holder is the author/funder. All rights reserved. No reuse without permission. — https://doi.org/10.22541/au.159181121.14843689 — This a preprint and has not been peer reviewed. Data may be preliminary.

                                                                                                                                                                                                                                                            Supplemental Figure 2G. Bland-Altman plot for QTc (Fredericia) on manually-measured 12-lead ECG
                                                                                                                                                                                                                                                            vs. 7-lead derived ECG. Solid blue line represents no bias. Solid red line represents mean bias between
                                                                                                                                                                                                                                                            all measurements. Dashed red line represents ± 2 standard deviations from the mean. Dashed purple line
                                                                                                                                                                                                                                                            represents ± 3 standard deviations from the mean.

                                                                                                                                                                                                                                                            Supplemental Figure 2H. Bland-Altman plot for QTc (Fredericia) on manually-measured 12-lead ECG
                                                                                                                                                                                                                                                            vs. lead II telemetry. Solid blue line represents no bias. Solid red line represents mean bias between all
                                                                                                                                                                                                                                                            measurements. Dashed red line represents ± 2 standard deviations from the mean. Dashed purple line
                                                                                                                                                                                                                                                            represents ± 3 standard deviations from the mean.

                                                                                                                                                                                                                                                                                                               18
Posted on Authorea 10 Jun 2020 — The copyright holder is the author/funder. All rights reserved. No reuse without permission. — https://doi.org/10.22541/au.159181121.14843689 — This a preprint and has not been peer reviewed. Data may be preliminary.

                                                                                                                                                                                                                                                            Supplemental Figure 2I. Bland-Altman plot for QTc (Framingham) on manually-measured 12-lead ECG
                                                                                                                                                                                                                                                            vs. 7-lead derived ECG. Solid blue line represents no bias. Solid red line represents mean bias between
                                                                                                                                                                                                                                                            all measurements. Dashed red line represents ± 2 standard deviations from the mean. Dashed purple line
                                                                                                                                                                                                                                                            represents ± 3 standard deviations from the mean.

                                                                                                                                                                                                                                                            Supplemental Figure 2J. Bland-Altman Plot for manually measured QTc (Framingham) on 12-lead ECG
                                                                                                                                                                                                                                                            vs. lead II telemetry. Solid blue line represents no bias. Solid red line represents mean bias between all
                                                                                                                                                                                                                                                            measurements. Dashed red line represents ± 2 standard deviations from the mean. Dashed purple line
                                                                                                                                                                                                                                                            represents ± 3 standard deviations from the mean.

                                                                                                                                                                                                                                                                                                               19
Posted on Authorea 10 Jun 2020 — The copyright holder is the author/funder. All rights reserved. No reuse without permission. — https://doi.org/10.22541/au.159181121.14843689 — This a preprint and has not been peer reviewed. Data may be preliminary.

20
You can also read