Engaging People's Enthusiasm in 2020 Population Census by Scrapping Social Media - UNECE
←
→
Page content transcription
If your browser does not render page correctly, please read the page content below
CONFERENCE OF EUROPEAN STATISTICIANS
Expert Meeting on the Dissemination and Communication of Statistics                                        Session 1
11-14 October 2021, Online                                                                      06 September 2021

Engaging People’s Enthusiasm in 2020 Population Census by Scrapping
Social Media
Oka Widhyartha Putra (Statistics Indonesia)
oka.widhyartha@bps.go.id

Abstract

The successfulness of Population Census lies on people participation. Hence, the biggest challenges is how to
attract the people to take part actively in the census. BPS-Statistics Indonesia has implemented several
strategies on increasing the people’s enthusiasm to participate the census. According to 2019 Global Digital
Overview by Hootsuite and We are Social, per January 2019, the active social media user in the world has
reached approximately 3,484 billion users or about 45% of world population. In Indonesia alone, the active
social media user is about 150 million users or about 56% population of Indonesia.
To monitor if these strategies are effective, information from several social media sources such as YouTube,
Instagram and Twitter are gathered and analyzed. In collecting data from Instagram, API search post, comment,
profile user, and location provided by Instagram were used. The API then got accessed by using Python with
package request. Data from Twitter were collected using the tools called Twint package in Python. YouTube
video data of 2020 population census were collected through web scrapping by Selenium of Python. From
YouTube, there are 883 videos related to 2020 Population Census from 2014 – 2019. The accumulated total
view is 732.030, 36.274 likes, and 2.441 comments. In the last three months of 2019, the total video increased
quite drastically compared to previous months, showing that socialization attempt was intensified. As for
Instagram web scrapping result from August 1st – December 15th 2019, the accumulated total users whom
posted is 5.162 users, with total like 665.560 likes, and 22.232 comments. It was also known that the most
posting was made in September 2019, which was also National Statistics day. From Twitter web scrapping, 3
694 tweets from 1,737 accounts were accumulated. Therefore, the year 2019 becomes the year with the most
tweets about 2020 population census. From these results, we can see which socialization method that was done
effectively in order to get people’s attention as part of evaluation object. For the future, this is going to be used
in all statistics activities in term of engaging users and investing in statistics.

Engaging People’s Enthusiasm in 2020 Population Census by Scrapping
                               Social Media
    Oka Widhyartha Putra, Nurmitra Sari Purba, Fachruddin Mansyur, Meindra Sabri, Setia Pramana,
                                           Maulana Faris

                                              Statistics Indonesia
                           oka.widhyartha@bps.go.id, maulana.faris@bps.go.id;

Abstract
The successfulness of Population Census lies on people participation. Hence, the biggest challenges is how
to attract the people to take part actively in the census. BPS-Statistics Indonesia has implemented several
strategies on increasing the people’s enthusiasm to participate the census. To monitor if these strategies are
effective, information from several social media sources such as YouTube , Instagram and Twitter are
gathered and analyzed. In collecting data from Instagram, API search post, comment, profile user, and
location provided by Instagram were used. The API then got accessed by using Python with package
request. Data from Twitter were collected using the tools called Twint package in Python. YouTube video
data of 2020 population census were collected through web scrapping by Selenium of Python. From
YouTube , there are 883 videos related to 2020 Population Census from 2014 – 2019. The accumulated
total view is 732.030, 36.274 likes, and 2.441 comments. In the last three months of 2019, the total video
increased quite drastically compared to previous months, showing that socialization attempt was intensified.
As for Instagram web scrapping result from August 1st – December 15th 2019, the accumulated total users
whom posted is 5.162 users, with total like 665.560 likes, and 22.232 comments. It was also known that the
most posting was made in September 2019, which was also National Statistics day. From Twitter web
scrapping, 3 694 tweets from 1,737 accounts were accumulated. Therefore, the year 2019 becomes the year
with the most tweets about 2020 population census. From these results, we can see which socialization
method that was done effectively in order to get people’s attention as part of evaluation object. For the
future, this is going to be used in all statistics activities in term of engaging users and investing in statistics.

Keywords: Big Data, Twitter, Instagram, Census, Indonesia
topics: S1 Digital Age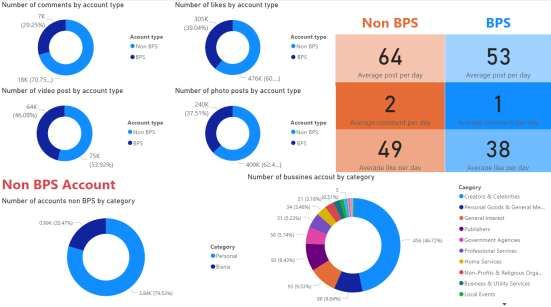
Introduction

      The population census in Indonesia is carried out by BPS every ten years in the year ending
with number 0. The 2020 population census is the seventh population census since Indonesia's
independence. In particular, the purpose of SP2020 is to provide data on the number,
composition, distribution, and characteristics of the Indonesian population (BPS, 2021). For the
success of the population census data collection, the involvement of the entire community in
Indonesia is urgently needed. Therefore, BPS uses various methods to communicate the
upcoming population census activities to the wider community. However, the big question is how
effective the 2020 population socialization conducted by BPS is.

      There are various studies conducted to measure people's interest in a particular product
through social media. Simanjuntak and Pramana (2021) conducted research on sentiment
analysis on Twitter regarding Covid-19 in Indonesia. They found that people on Twitter expressed
more negative sentiments about the government's handling of the Covid-19 pandemic. Neri et al
(2012) on their research described a sentiment analysis study performed on over than 1000
Facebook posts about newscasts, comparing the sentiment for Rai, the Italian public broadcasting
service, towards the emerging and more dynamic private company La7. It maps Sentiment
Analysis on Social Media with observations and measurable data. they found that Monitoring the
social media activities is a good way to measure customers’ loyalty and interests, keeping track
of their sentiment towards brands or products. From all these studies, social media can be used
to see public sentiment and enthusiasm for a product, in this study the product is the population
census. However, there has never been a study on the use of social media to measure public
enthusiasm for the socialization of census activities from the national statistical office.

       This study aims to see the enthusiasm of the community as a result of various socialization
activities for the population census that have been carried out by BPS. This research needs to
be carried out as an evaluation of various socializations carried out by NSO to the community to
welcome the 2020 population census major activity.

Methods

       In this study, we used three social media to monitor how the public hype is about the
Population Census 2020 in Indonesia. One of these social media is Instagram. The point that
makes Instagram different from other social media is that Instagram uses a visual-based strategy
(Hird, 2013) by posting images or videos that can attract people to see it. By seeing this potential,
Statistics Indonesia (BPS) used Instagram as one of the media to publish the Population Census
activities that held in 2020.

        The second social media that we used is YouTube . YouTube is an online platform and
social media for sharing videos owned by Google. YouTube was launched in February 2005 by
Steve Chen, Chad Hurley, and Jawed Karim. It is the second most visited website in US, with
more than one billion monthly users (www.semrush.com, 2021) who collectively watch videos for
more than one billion hours every day (Cristos, 2017). Even the data for May 2019, every minute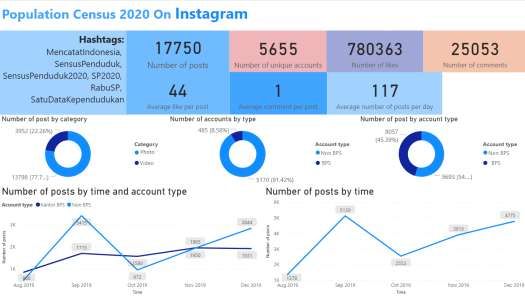
the number of videos uploaded on the site is around 500 hours (James, 2019). YouTube is the
fourth most visited website by the people of Indonesia (www.similarweb.com, January 2019).

       Video is one of the fastest ways to connect with the target or target market and build a good
relationship with them because it is able to provide non-verbal communication. YouTube is the
fastest way and one of the most powerful tools in the realm of social media. YouTube provides
a social interaction mechanism to assess user opinions and views on videos by means of voting,
rating, favorites, sharing and negative comments, etc. This information is useful in studying user
and community behavior.

      Several previous studies used data obtained from YouTube as a reference for the
development of their research. For example, research (Poche, 2017) which analyzes the
comments made by the audience on video coding tutorials for programmers. The purpose of this
research is to help content creators understand the needs and complaints of YouTube users so
that content creators can respond quickly and precisely so that it is hoped that the next learning
video will be effective and efficient. As for research (Daabes, 2018), analyzing Arabic-language
YouTube video content related to the use of herbal medicines for cancer treatment. As a result,
75 videos were viewed 4,770,491 times. The analyzed videos present more than 107 different
natural herbs and plants as a source of treatment for cancer. The study found that the vast
majority of videos (96%) were created by individual content creators who lack scientific evidence
and have no professional connections.

      With so many social interactions on the YouTube site, it is hoped that we can find out the
influence of the 2020 Population Census socialization videos on the YouTube site in the form of
the number of videos and their development, outreach to the public as seen from the number of
times the videos are watched, positive and negative responses seen from the video. likes and
dislikes, and so on. In addition, it can also capture the level of popularity of the BPS YouTube
account or public figures who may play a role in spreading the echo of SP2020 on the YouTube
platform.

      The third social media that we used is twitter. Twitter as microblogging has 140 characters
limited in each tweet (sembodo et al, 2016). Twitter can show what topics are being discussed
on the internet. BPS also uses Twitter as a medium to inform about population census activities.
This research will also capture how much people's intentions are in talking about the 2020
population census on Twitter.

      This research uses the help of certain programming languages such as Python and
various other software. According to the understanding of the Python Software Foundation
(2016), Python is a dynamic, semantic and interpretive programming language. Python has
high-level data structures, dynamic typing and dynamic binding. Python has a simple syntax and
is easy to learn. Python supports modules and packages to encourage program modularity and
code reuse. The Python interpreter and its standard libraries are freely available for all platforms
and can be freely distributed.

      Jupyter Notebook is a popular tool for processing data in python. Jupyter Notebook makes
it possible to integrate code with output in a single document interactively. Although it is often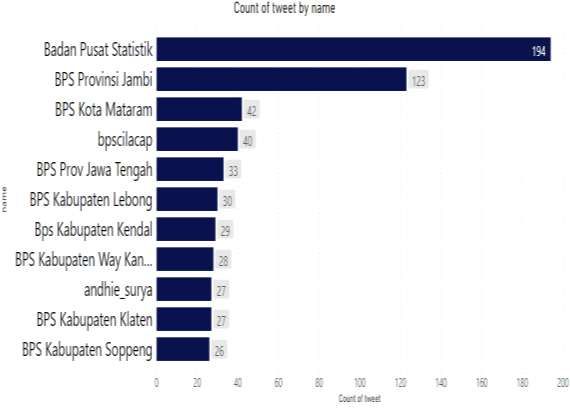
used for Python programming, basically it can also be used to build applications from Julia and
R languages and several other languages using extensions (https://jupyter.org/, 2021).

       Power BI is a Business Intelligence creation application owned by Microsoft that is capable
of displaying data visualizations, allowing making queries, data connections, and reports
(Ronald, 2008). Power BI is easy to use because its user interface is similar to Microsoft Office
applications. Power BI can process data in detail and display it in a more interactive form.
Power BI can be accessed from 3 platforms, namely a desktop platform that can be installed on
a computer or laptop, a web platform that can be accessed via a web browser, and a mobile
platform that can be used on smartphones. Power BI provides both a free and a paid version for
those who want to use it. Power BI can assist enterprise analysts in presenting their reports and
analysis of the company's business flows. Power BI is also able to combine different databases,
files, and web services so that they are able to make changes to data automatically. Power BI is
also able to unify data, both cloud and non-cloud data because Power BI has a gateway that
allows connections to SQLServer databases, Analysis Services models, and other data sources
(Rajagukguk (2008).

MySQL, the most popular open source SQL database management system, is developed,
distributed and supported by MySQL AB. The following are the characteristics of MySQL
(Dubois, 2004):

     -    MySQL is a database management system.
     -    MySQL is a relational database management system.
     -    MySQL software is Open Source.
     -    MySQL Database Server is very fast, reliable and easy to use.
     -    MySQL Server works on client/server or embedded system.
     -    MySQL software is available in large quantities.
The more detail explanation of data acquisition, preprocessing and analysis of each social media
channel is discussed in the following section.

     A. Instagram
1.   Research time
     Data collection and analysis is carried out prior to the Population Census 2020, which is in
the period of publication of activities from August to December 2019.

2.     Tools used in research
     1. Program in Python programming language for data retrieval
     2. Database MySQL
     3. IDE Jupyter notebook
     4. Power BI
3.       Stages of work
         The stages carried out in this research are:

     1. Set search keywords
     2. Collecting data based on the specified keywords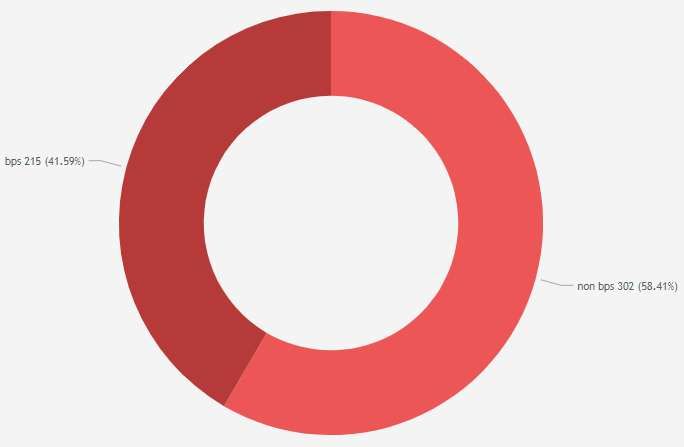
3. Cleaning data
       4. Create data visualization and perform analysis
3.1. Set search keywords
     To get the right content related to the Population Census 2020, we determine keywords
based on hashtags that are often used in publicizing this activity, namely:

       1.   #mencatatindonesia
       2.   #sensuspenduduk
       3.   #sensuspenduduk2020
       4.   #sp2020
       5.   #rabusp
       6.   #satudatakependudukan
3.2. Collecting data based on the specified keywords
     To collect data, several stages are carried out, namely:

1. Observation of possible data collection methods
      Apart from being a smartphone application, Instagram is also available in the form of a web
application that can be accessed at https://www.instagram.com/ . This web version allows us to
more easily collect data using web scraping techniques.

        The following is a link that will display search results based on the keywords we are looking
for:

       1.   #mencatatindonesia: https://www.instagram.com/explore/tags/mencatatindonesia/
       2.   #sensuspenduduk: https://www.instagram.com/explore/tags/sensuspenduduk/
       3.   #sensuspenduduk2020: https://www.instagram.com/explore/tags/sensuspenduduk2020/
       4.   #sp2020: https://www.instagram.com/explore/tags/sp2020/
       5.   #rabusp: https://www.instagram.com/explore/tags/rabusp/
       6.   #satudatakependudukan:
            https://www.instagram.com/explore/tags/satudatakependudukan/
      From each of these links there is an endpoint that can be accessed to get search results in
JSON format. To access this endpoint, simply add ?__a=1 at the end of the link, for example:
https://www.instagram.com/explore/tags/mencatatindonesia/?__a=1 . The endpoint will produce
the following results: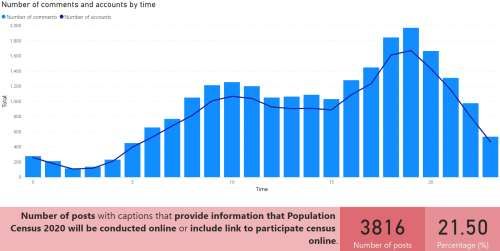
Figure 1. the result
In addition to collecting data from keyword search results, we will also collect information
related to post details such as: details of the user who posted, comments, and the location of the
post. So the endpoint we use is as follows:
Hashtag search: https://www.instagram.com/explore/tags/ /?__a=1
User details: https://www.instagram.com/ /?__a=1
Comments and post locations: https://www.instagram.com/p//?__a=1
Instagram location details:
https://www.instagram.com/graphql/query/?query_id=17865274345132052&id=&first=1
2. Creating a data collection program
For the creation of the data collection program, we used the Python programming
language using the Jupyter Notebook IDE. We use MySQL database for data storage. The
following is the flow of data collection:
figure 2. Flow of Data Collection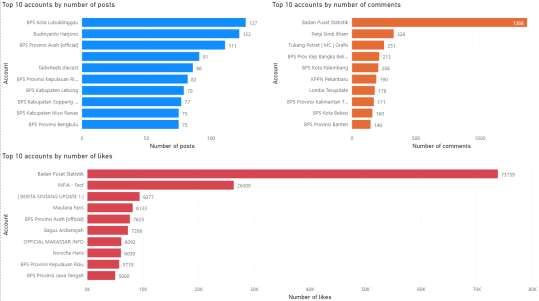
3.3. Cleaning data
      After all data is collected, data cleaning is carried out to remove unwanted data. Following
are the steps for data cleaning:

   1. Removing data that are outside the range of the research period
   2. Removing data posted from outside Indonesia
   3. Removing non-Indonesian data

   B. YouTube
      YouTube video data retrieval is done by web scraping technique using the Python
programming language with the help of Selenium Webdriver. Researchers will take YouTube
video data regarding the 2020 Population Census uploaded until November 2019. To be able to
collect videos, it is first necessary to define what search keywords will be used, then design a
programming workflow to retrieve the data. The keywords used to find YouTube videos regarding
the 2020 Population Census can be seen in Table 1.

                                           Table 1. Keyword List

                                 No     Keyword
                                 1      sensus penduduk 2020
                                 2      #sp2020
                                 3      #sensuspenduduk2020
                                 4      #lombacoversp
                                 5      #mencatatindonesia

      The data that will be extracted from scraping are video URL, video title, account name,
number of subscribers, number of views, date, number of likes, dislikes, and comments, video
description, category, and video duration. For the comments themselves, they were not taken
because they were few in number and the words and sentences used were not in accordance
with standard spelling guidelines so that they would not be effective and efficient in supporting
the research objectives.

      Before being able to proceed to the analysis process, the data that has been obtained from
the scraping results need to be preprocessed. The process carried out is in the form of cleaning
data to issue videos that use words from existing keywords but do not actually refer to the 2020
Population Census activities in Indonesia.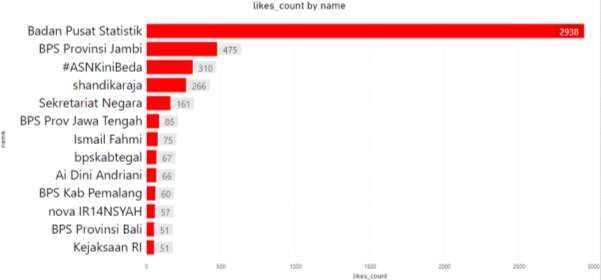
Figure 3. Flow YouTube Data Collection

   C. Twitter

   1. Research Time
   The data taken and analyzed are in the range of 2010 to 2019. The last data taken was in
December 2019.

   2.   Tools
   a.   Python Programming Language
   b.   Power BI
   c.   worditout.com

   3.   Stages of work
   a.   Search keywords
   b.   Collecting data based on the keywords
   c.   Cleaning data
   d.   Create data visualization and Perform analysis
3.1. Search Keywords
         To get tweets about the Population Census, the keywords used are:

    a.   #sp2020
    b.   #MencatatIndonesia
    c.   Sensus penduduk 2020
    d.   #sensuspenduduk2020
    e.   #rabusp

   3.2. Collecting data based on the keywords
         For data collection we used python and a package that can be used for crawling twitter
without an API, this package uses a web scrolling system to get the data
(https://github.com/twintproject/twint). Twint is an advanced Twitter scraping tool written in Python
that allows for scraping Tweets from Twitter profiles without using Twitter's API. Twint utilizes
Twitter's search operators to let you scrape Tweets from specific users, scrape Tweets relating to
certain topics, hashtags & trends, or sort out sensitive information from Tweets like e-mail and
phone numbers. I find this very useful, and you can get really creative with it too. Twint also makes
special queries to Twitter allowing you to also scrape a Twitter user's followers, Tweets a user
has liked, and who they follow without any authentication, API, Selenium, or browser emulation.
(https://github.com/twintproject/twint)

       First, we import all packages that we need to get the data, the packages are shown in
   the picture.

                                         Figure 4. All Packages needed

        After importing all packages, we set variables for all search keywords. Each variable can
   only have one keyword. In each variable it will output as a CSV file and the name we set is
   like a keyword. The following figure shows the syntax.
Figure 5. Set variable
After we got all the data, we need to combine all the CSV files into one file with
syntax like bellow
Figure 6. Combine all CSV3.3. Cleaning data
Automatic cleaning of data is a bit difficult because some of the keywords we used
to get the data were used by other tweets that were not about the Population Census. We
can only check it after we do the visualization. So after visualization, we still do data
cleaning until the data is really clean. What we removed were accounts that tweeted not
about the Census but used the same keywords, accounts that tweeted the Census but
used robots to tweet. The syntax we use to clean up the data is in the image.
Figure 7. Cleaning dataResults
1. Instagram
Based on the cleaned data, we create a visualization in the form of a dashboard using
Power BI.
Figure 8. Instagram Dashboard
In Figure 8 we see there are 17,750 posts related to the Population Census 2020 from August
– December 2019 with an average of 117 posts per day, by category there are more posts in the
form of photos (13,798 posts) than videos (3,952 posts). This post involves 5,655 unique
accounts, which means each account can post 3-4 posts. Engagement from posts can be seen
from the likes and comments obtained, accumulatively posts related to the Population Census
2020 get 780,363 likes and 25,053 comments with an average of 44 likes and 1 comment per
post. The number of likes and comments per post obtained is quite small, meaning that this post
related to the Population Census 2020 does not invite users to provide feedback.
Based on the type of account, there are more non-BPS accounts (5,170 accounts) compared
to BPS accounts (485 accounts), but from the number of posts by account type, posts from the
BPS (8,057 posts) are almost the same as those from non-BPS (9,693 posts). This means that it
is still necessary to increase participants from non-BPS accounts to further disseminate
information related to the Population Census 2020.
Based on the time, there was an increase in the number of posts in September 2019. This
was due to the celebration of National Statistics Day. At that time the number of posts from non-
BPS accounts (3,415 posts) was more than BPS accounts (1,715 posts). This can be a
consideration for doing the same thing at the National Statistics Day activities in promoting the
Population Census 2020 activities.Figure 9. Account Dashboard
From Figure 9, judging from the comparison of the number of likes and comments obtained
between non-BPS accounts and BPS accounts, it was found that non-BPS accounts had higher
engagement. This means that it is necessary to use non-BPS accounts in order to reach a wider
audience. Based on the category, non-BPS accounts are more personal accounts than business
accounts. For business accounts, the category most involved is Creators & Celebrities.
Figure 10. The most active accountsWe can see the most active accounts in Figure 10, the account that has the most engagement
(likes and comments) is the Central BPS account, but this account does not post much. This can
be a suggestion to increase the number of posts on the Central BPS account regarding the
Population Census 2020. There are also news accounts in the 10 users with the highest number
of likes, such as INFIA – Fact, Official Makasar Info and News Sintang Update. This shows that
an account like this has the potential to get high engagement, so it can be a suggestion to
collaborate with similar accounts to disseminate information about the Population Census 2020
Figure 11. Post Distribution Map
Judging from the location of the posts, the distribution of posts related to the Population Census
2020 is almost evenly distributed throughout Indonesia.
Figure 12. Number of comments and accounts by timeIn Figure 11 we can see the spread of the number of comments and accounts by time. Users
start being active at 09.00 AM and then increase from 04.00 PM - 07.00 PM. From these results
it can be suggested to post publications should be done starting at 08.00 AM until before 07.00
PM. Looking at the captions on the posts, we can see that only 22.18% of posts contain
information about Population Census 2020 will be conducted online or include links that can be
used to take part in the Online Population Census. This number is quite small, so it can be a
suggestion to continue to increase the publication of the Online Population Census.
2. YouTube
From the preprocessing results, 883 YouTube videos related to the 2020 Population
Census were uploaded by 517 different accounts. The total number of views of the entire video
is 732,030, the number of likes is 36,274, dislikes are 879, and comments are 2441. When
averaged, the number of views per video is only 829, the number of likes is 41 per video, and
comments are between 2 and 3 per video.
Figure 13. The trend of growth in the number of videos per yearFigure 14. Trends in the growth of the number of videos in 2019
It can be seen in Figure 12, that the trend in the number of videos has increased drastically
from 2018 to 2019. Then, in Figure 13 it can be seen that in the last three months of 2019, there
was an increase in the number of videos more than the previous months. This shows that 2020
Population Census socialization efforts have been intensified in recent months.
Figure 15. The ten accounts with the highest number of subscribersThe ten YouTube accounts with the most subscribers are national and regional news
accounts. The three biggest accounts are BeritaSatu, Work Training, and TANJUNGPINANG TV.
BeritaSatu uploaded 3 videos related to Census, the last time uploading a video was on
September 27, 2019. It's just that the number of views is very small (less than 1800) compared
to the number of subscribers which has reached 3 million. This condition provides information
that the content created is not able to attract public interest to watch it.
Figure 16. Percentage of BPS and non BPS accounts
Figure 17. Percentage of the number of videos by BPS and non BPS account
It can be seen from Figure 16 and Figure 17 that the accounts that upload videos related to
2020 Population Census are from non-BPS but the BPS accounts in total are superior in
uploading videos. The top three BPS accounts that upload the most videos are bpskuningan (43videos), BPS West Sumatra Province (16 videos), and AIS/STIS Anniversary (15 videos) while
the top three non-BPS accounts that upload the most videos related to the Census are: MOCH
ARIF 7272 (11 videos), Work Practice (6 videos), and five other accounts with the same number
(5 videos).
Table 2. Five Videos with the Most Views
Tabel 3. Five Videos with the Most Likes
Tabel 4. Five Videos with the Most Comments
It can be seen that the video entitled "[Official] Theme song Population Census 2020
(SP2020) | Hip hop version | Millennials style" is in the top 5 in all categories, both the most views,
the most likes, and the most comments. This video, published on February 8, 2019 by the BPS
of West Sulawesi Province, tells the condition that people prefer entertaining videos.Figure 18. The top videos that have the most views, likes, and comments
Figure 19. Distribution map of BPS YouTube accounts
By detecting the origin of the province from BPS accounts, it can be seen that BPS is the
most active in publishing videos related to 2020 Population Census is BPS in West Java province
with a total of 112 videos. Of the total 34 provinces in Indonesia, as of November 2021 there are
2 provinces where BPS is not active at all, namely province Yogyakarta and Papua.3. Twitter
Visualization of data is created using Power BI and wordcloud we used this website :
https://worditout.com/. There were 3689 Tweets and 1732 Accounts tweeting about the
Population Census between 2010 and December 2019. Since 2010, people have been talking
about the Population Census, but there are too few of them. Most tweets made in 2019, 3253
tweets.
Figure 20. Number of tweets in years
Figure 21. Count of tweet by name
Accounts that tweet a lot comes from the official BPS accounts. From the picture,
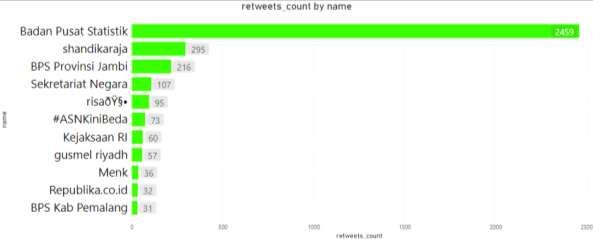
it can be seen that the top ten accounts dominated by official BPS accounts.Figure 22. Like, reply, and retweet by name
The official BPS accounts still gets the most liked, replied, and tweeted. However, the
top ten are now not dominated by official BPS accounts. The account name shandikaraja which
is not in the top ten tweets but gets more responses from people in the form of likes, replies,
and retweets.Figure 23. Like count by name and tweet
Tweets that get the most likes are tweets from the shandikaraja account, which is around
265. We can see the tweet about the give away in the picture.
Figure 24. Shandikaraja Tweet
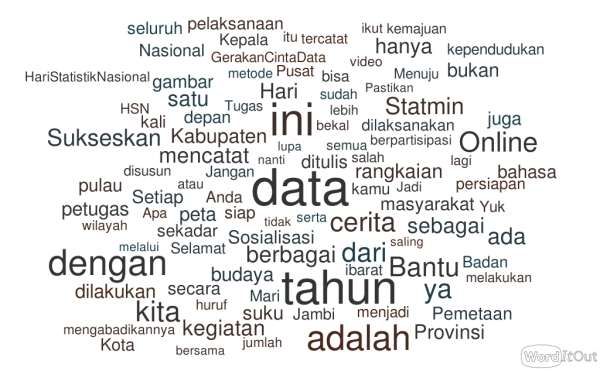
From wordcloud, we get the most word used in the tweet is “data”, “ini” “online”, and
“tahun” that can be mean “this years we collect data with online”.Figure 25. Wordcloud tweets
Conclusion
This research succeeded in capturing the enthusiasm of the community about the 2020 population
census on social media Twitter, Instagram, and YouTube . In general, the information of the 2020
population census spread out throughout the country. This means that the socialization of the population
carried out by BPS has succeeded in making the population census a public discussion on social media.
Although most of social media posts regarding census are posted by the BPS-statistics staffs, there are
also posts from online news, influencers and also other government intuitions.
Reference
BPS. (2021). Berita Resmi Statistik No 7/01/ThXXIV Hasil Sensus Penduduk 2020.
Dabees, Ajayen S. Abu. (2018). Cancer Treatment Using Herbals in Arabic Social Media: Content
Analysis of YouTube Videos. IEEE. DOI: 10.1109/CANCERCARE.2018.8618247
Dubois, Paul. (2004), MySQL Administrator's Guide, MySQL Press.
Goodrow, Cristos (February 27, 2017). "You know what's cool? A billion hours". YouTube .
Retrieved April 19, 2021.
Hird, C. (2013, December). Social media marketing: A best practices analysis of selected
destination magazines. Retrieved from http://digitalcommons.calpoly.edu/rptasp/54/Hootsuite & We are Social. (2019). Digital 2019. https://wearesocial.com/global-digital-report-
2019
Loke Hale, James (May 7, 2019). "More Than 500 Hours Of Content Are Now Being Uploaded
To YouTube Every Minute". TubeFilter. Los Angeles, CA. Retrieved June 10,2019.
Neri, Federico; Aliprandi, Carlo; & Cuadros, Montse. (2012). Sentiment Analysis on Social Media.
Conference Paper. DOI: 10.1109/ASONAM.2012.164
Poche, Elizabeth; Jha, Nishant; Williams, Grant; Staten, Jazmine; Vesper, Miles; Mahmoud,
Anas. (2017). Analyzing User Comments on YouTube Coding Tutorial Videos. IEEE. DOI:
10.1109/ICPC.2017.26
Sembodo, Jaka Eka & Setiawan, Erwin & Baizal, Abdurahman. (2016). Data Crawling Otomatis
pada Twitter. 11-16. 10.21108/INDOSC.2016.111.
Rajagukguk, Ronald. (e-book) "Quick Intro to Microsoft Office PerformancePoint Server
2007".ITb Bandung: MIC. 2008.
Simanjuntak, Tigor Nirman & Pramana, Setia. (2021). Sentiment Analysis on Overseas Tweets
on the Impact of COVID-19 in Indonesia. Indonesian Journal of Statistics and its
Applications. DOI: 10.1109/ASONAM.2012.164
"Top 100: The Most Visited Websites in the US [2021 Top Websites Edition]". www.semrush.com.
Retrieved May 26, 2021. https://www.semrush.com/blog/most-visited-websites/
https://www.similarweb.com/ retrieved January, 2019.
https://jupyter.org/, retrieved September, 2021
https://worditout.com/about, retrieved September, 2021You can also read