Aerial Survey of Magpie Goose numbers in the Top End of the Northern Territory - Moyle River Floodplains to Arnhem Land Floodplains April-May 2018 ...
←
→
Page content transcription
If your browser does not render page correctly, please read the page content below
Aerial Survey of Magpie Goose
       numbers in the Top End of the
       Northern Territory
       Moyle River Floodplains to Arnhem Land Floodplains
       April-May 2018

       Tim Clancy
       Flora and Fauna Division
       Department of Environment and Natural Resources

www.denr.nt.gov.au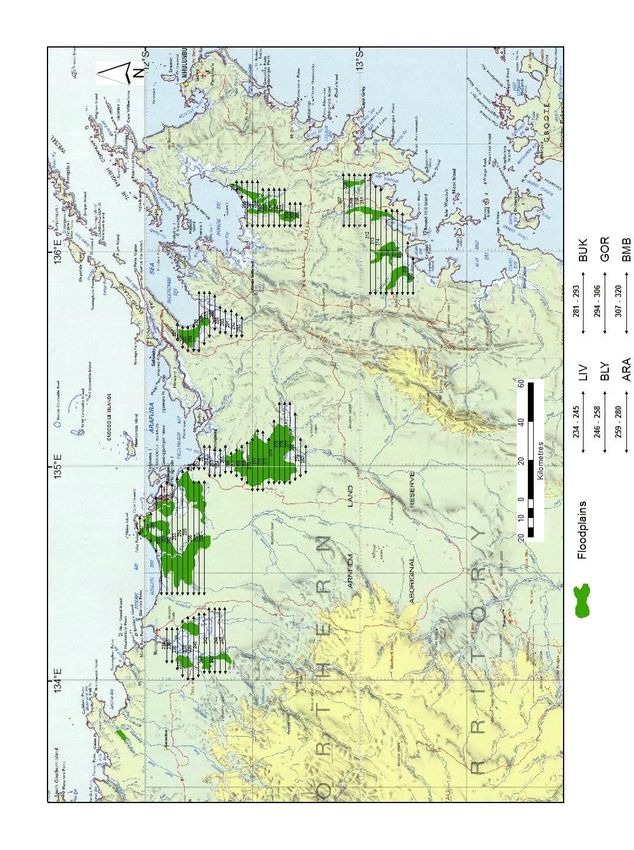
Aerial Survey of Magpie Goose numbers in the Top End of the Northern Territory
Moyle River Floodplains to Arnhem Land Floodplains, April-May 2018

Acknowledgments

This survey was funded by the Northern Territory Government and supported by the Department of
Environment and Natural Resources, Department of Tourism and Culture and the Australian
Government Department of Environment.

Troy Thomas from Heli-muster NT Pty Ltd (survey) and Cameron Pennycuick from Remote
Helicopters (reconnaissance flights) provided professional piloting service.

Skilled observing and data recoding was delivered by Brydie Hill, Carol Palmer, Kate Buckley, Rachel
Groom and Claire Millen from Flora and Fauna Division, Department of Environment and Natural
Resources; Alice Donne, McKay Smith, Ian Hunt and David Jacobson from Wildlife Operations,
Department of Tourism and Culture; Shiona McDonald and Louise Harrison from Kakadu National
Park; and Brian Boyle from Field and Game (NT).

Advice on and support with survey logistics was provided by Keith Saalfeld, Rachel Groom and Jo
Pridham from Flora and Fauna Division, Department of Environment and Natural Resources; and Sally
Heaton and Tracey Duldig from Wildlife Operations, Department of Tourism and Culture.

The Department is grateful to Traditional Owners and pastoralists who allowed the surveys to be
undertaken across their land as well as for direct and indirect support from Commonwealth (Kakadu)
and Northern Territory (NT Parks) park management agencies.

Report layout and content drew heavily on previous years’ reports prepared by Keith Saalfeld and
Rachel Groom. Glenn Edwards and Keith Saalfeld provided critical review that greatly improved this
report.

Enquiries should be made to:
Department of Environment and Natural Resources
Po Box 496, Palmerston NT 0831
Telephone (08) 8995 5099
Email: wildlife.use@nt.gov.au
Web: www.denr.nt.gov.au

ASBN: 978 1 743501 65 8

© Northern Territory of Australia, 2018

Aerial Survey of Magpie Goose numbers in the Top End of the Northern Territory, April-May 2018         ii
Summary

An aerial survey to estimate the Magpie Goose population size and nesting activity was
undertaken from 29th April 2018 to 9th May 2018 across the Top End of the Northern
Territory, from the Moyle River flood plains in the west to the Blue Mud Bay region of
Arnhem Land in the east. A total of 8043 km of survey transect was flown using the standard
methodology applied since 2011, sampling 22,263 square kilometres (over 2 million ha) of
potential habitat at a sampling intensity of 14.4%. Counts for Magpie Goose and Magpie
Goose nests were corrected for a combined perception and visibility bias based on
correction factors derived from Bayliss & Yeomans (1990a & b).

The population estimate for Magpie Goose was 918,200 ± 116,961 (coefficient of variation
12.7%), which is an average density of 40.1 individuals per km2 within the survey region. This
is an increase of 26.7% on the 2017 estimate and equates to an annual rate of increase (r) of
0.237, suggesting the population was growing at a rate towards the top of the range of the
theoretical plausible rm for the species proposed by Brook and Whitehead (2005).

The number of Magpie Goose nests was estimated to be 77,839 ± 14,250 (coefficient of
variation 18.3%) for the surveyed area. This was on a par with nesting levels for 2017 if only
the common surveyed area is considered. This is considered high to very high nesting rates
compared with relative nesting in previous years and is suggestive of a continued rise in
population in 2018/19, if other factors including harvest from hunting are considered to be
moderate to low. Rainfall preceding the survey period was above average across the wet
season consistent with the observed high nesting rate for this year.

Aerial Survey of Magpie Goose numbers in the Top End of the Northern Territory, April-May 2018   1

Introduction

The Magpie Goose, Anseranas semipalmata, is an iconic waterbird species valued for
cultural reasons, as a resource for food, recreational hunting opportunities and as a wildlife
viewing experience supporting nature based tourism in the Top End of the Northern
Territory. Details of the species’ biology, management context and conservation are
provided in Delaney et al. (2009), as well as the future management regime and population
monitoring requirements.

Monitoring of Magpie Goose populations in the Northern Territory by aerial survey has been
carried out since the early 1980s. During the period 1983 to 1993, the annual aerial survey of
Magpie Geese on the Top End floodplains was conducted during or immediately after the
end of the wet season1, so that additional data on nesting activity could be collected.
Between 1994 and 2001 surveys were undertaken during the dry season (see Bayliss &
Yeomans 1990a for characterisation of dry season survey) and the values of each approach
are discussed in Delaney et al. (2009). Between 2000 and 2010 only two major aerial surveys
of Magpie Geese populations in the Top End were undertaken, in 2000 and 2006. Both of
these surveys covered the floodplain areas from the Moyle River in the west to Murganella
in the east, including Kakadu National Park (Delaney et al. 2009).

Following a review of all the monitoring approaches a revised monitoring program was
implemented in 2011 (Saalfeld 2011). Since then, the most important habitat area based on
relative numbers of geese - the Adelaide River floodplain to Murganella Creek floodplain –
has been surveyed on an annual basis (with the exception of 2014). The second most
important area - Moyle River floodplain to Finniss River floodplain - has been surveyed on a
less frequent basis but has generally been surveyed in totality in most years since 2011
(Groom and Saalfeld 2017). The third most important area - Arnhem Land, which typically
contains only 10-15 % of the total NT population - has been surveyed less frequently due to
financial and logistical constraints.

Overall population estimates from aerial surveys since 2011, adjusted to be comparable
among years independent of areas surveyed, are shown in Table 1.

This report provides details of the 2018 aerial survey. Due to the declining population
estimates after 2013 and historically low estimate in 2017, a decision was made to survey
the full extent of Top End Magpie Goose habitat in 2018, including Arnhem Land floodplains.

1 Wet and dry season definition as per BoM http://www.bom.gov.au/climate/glossary/percentages.shtml.

Aerial Survey of Magpie Goose numbers in the Top End of the Northern Territory, April-May 2018         2

Figure 1:         Survey areas for Magpie Goose aerial surveys. Since 2011, Area 1 has been
surveyed annually and 3 on a biannual basis or more frequent basis. Area 2 has been surveyed less
regularly. All areas were surveyed in 2018.

Table 1:   Population and nest estimates from 2011 to 2017 derived from wet season aerial
           surveys. Estimates are adjusted to be comparable among years, independent of areas
           surveyed (Saalfeld 2011-2016, Groom and Saalfeld 2017).

                Year                    Magpie Goose population                Magpie Goose nests
                                               (million)

                2011                              2.4 ± 0.4                      283,000 ± 82,000

                2012                              2.9 ± 0.5                      184,000 ± 36,000

                2013                              2.5 ± 0.4                       13,000 ± 4,000

                2014                              1.3 ± 0.1                       134,000 ± 4,000

                2015                              1.1 ± 0.2                      105,000 ± 13,000

                2016                              1.3 ± 0.1                       40,000 ± 6,000

                2017                             0.72 ± 0.1                       95,000 ± 15,000

Aerial Survey of Magpie Goose numbers in the Top End of the Northern Territory, April-May 2018      3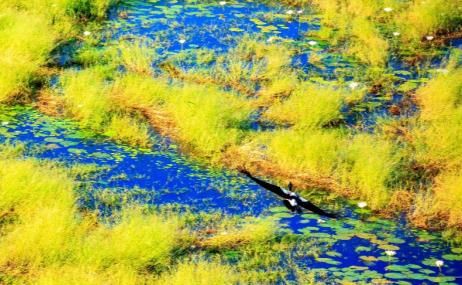
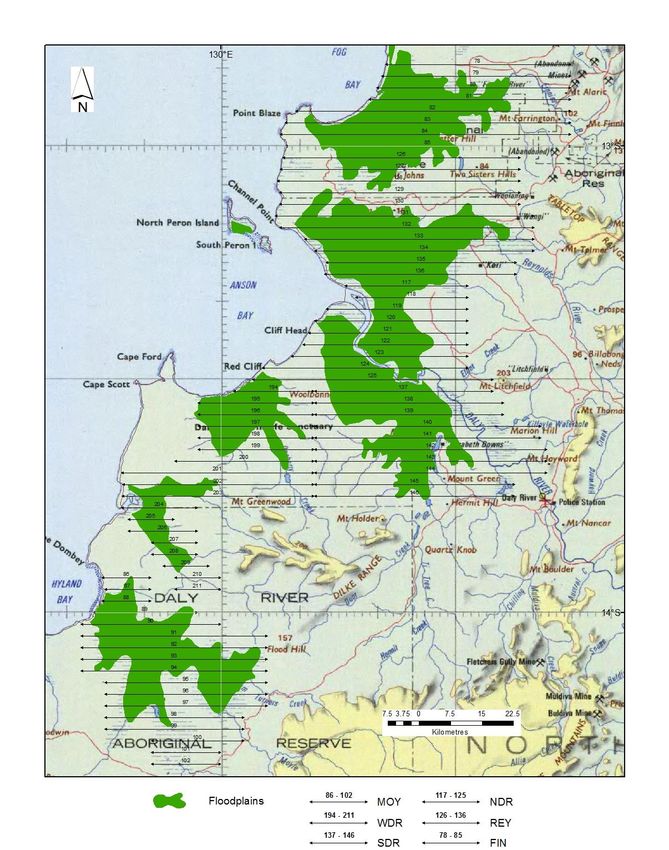
Methods

Survey Area and Design

A reconnaissance flight over wetland areas was undertaken in a Robinson R44 (observers
Rachel Groom, Brydie Hall and Tim Clancy) on April 10, to ascertain progress of the nesting
season. A further flight was undertaken on April 16. Observations guided the final timing of
the main survey and survey block order to maximise, as far as practicable, concurrence with
the peak nesting period.

The Moyle River floodplains to Finniss River floodplains survey area (latitude 11 050'S to
14020'S, longitude 129040’E to 130045’E) includes all major floodplains and wetland habitat
within the region (Figure 2a) and was surveyed between 23 April and 27 April, 2018. This
area was divided into six major survey blocks.

The Adelaide River floodplains to Murganella Creek floodplains survey area (latitude 11040'S
to 13000'S, longitude 131010’E to 133000’E) includes all major floodplains and wetland
habitat within that region (Figure 2b) and was surveyed between 29 April and 4 May, 2018.
This area was divided into nine major survey blocks with the eastern blocks (based from
Jabiru) undertaken first.

The Arnhem Land floodplains survey area (latitude 12000'S to 13018'S, longitude 134010’E to
136021’E) includes all major floodplains and wetland habitat within that region (Figure 2c)
and was surveyed between 6 May and 9 May, 2018. This area was divided into six major
survey blocks. Survey blocks were completed from east (based from Nhulunbuy) to west
(based from Maningrida).

The survey was conducted using a Cessna 206 high-wing aircraft flown at a ground speed of
185 km/h (100 knots) and an altitude of 61 m (200 ft.) above ground level. Altitude was
maintained using a radar altimeter. Where the transect had to traverse open water aircraft
height was adjusted to maintain safe gliding range; in practice this did not impact on survey
areas as such occasions were very rare and did not occur in areas of significant Magpie
Goose habitat. Transect width was demarcated by marker rods attached to the aircraft wing
struts and calibrated (Marsh & Sinclair 1989a) to give a transect width of 200 m on each side
of the aircraft at survey altitude.

Transect lines flown on the survey are shown in Figs 2a, 2b and 2c. All lines were aligned
east-west to perpendicularly traverse the general north-south orientation of the major river
systems, ridges and escarpments of the area. Transects were spaced at an interval of 1.5' of
latitude (2.778 km) to give a survey intensity of 14.4% from the combined port and starboard
transect width of 400 m. Navigation of transects was by Global Positioning System pre-
programmed with all transect waypoints on Samsung Galaxy Tab 2 (7.0) using the
OziExplorer Android GPS mapping software.

During the survey, an opportunity was taken to train a small number of additional observers
to increase the pool of experienced observers that could be used in future. The nature of the
methodology and conditions means that generally observers require 4 – 5 sessions of

Aerial Survey of Magpie Goose numbers in the Top End of the Northern Territory, April-May 2018   4

experience to provide data consistent with experienced observers, and not all people are
suitable due to the issue of motion sickness. For all surveys two experienced observers were
present, along with a trainee or external (non-NTG observer).

Counting Procedure

The survey crew comprised a pilot/navigator, a starboard front seat observer, a port mid
seat observer and a starboard mid seat observer. The pilot and observers could
communicate via aircraft intercom, and the pilot indicated the start and finish of each
transect by calling either 'start transect' or 'finish transect'.

All data entry was via a HP iPaq rx5900 Travel Companion linked to an external antenna
mounted internal to the plane to improve GPS signal reception. Data were entered by
observers using a purpose built Basic program written by K. Saalfeld which allowed for
Species (Magpie Goose, Magpie Goose Nest, Jabiru (Ephippiorhynchus asiaticus), Brolga
(Grus rubicunda), Feral Pig (Sus scrofa), Feral Horse (Equus caballus), and Buffalo (Bubalus
bubalis)) and Number to be recorded. Number sighted and species code were entered by the
observer upon sighting, or in the case of high densities as soon as practicable afterwards,
with each record geocoded on entry.

Post Survey Data Handling and Editing

Data were downloaded daily from each observer’s iPaq to a laptop computer and opened in
Excel. Data were immediately checked for logged errors (signified by code 999 entered by
the observer) as well as any apparent major errors in recording (e.g. transects wrongly coded
by the observers). Files for each observer were merged on a survey block basis and
converted from .csv to .xls format. Simple totals were produced to examine any potential
major discrepancies which could be queried with the relevant observer. When network
access was available all files were backed up to network drives. Simple cross tab, filtering
and macros were used to accumulate data into transect counts in each survey block for the
whole of survey region (each of 3 survey areas) tables for analysis.

Analysis

Because transects were variable in length/area, the Ratio Method (Jolly 1969, Caughley &
Grigg 1981, Marsh and Sinclair 1989) was used to estimate density, population size and their
associated standard errors for the survey area. Input data were the observed numbers of
each species for the port mid-seat and starboard mid-seat or starboard front-seat observers.
Only data from experienced observers were used in the analysis. Estimates were corrected
for perception and visibility bias using the wet season correction factors of Bayliss &
Yeomans (1990a & b); correction factors were 3.28 for Magpie Geese and 2.23 for Magpie
Goose nests.

Aerial Survey of Magpie Goose numbers in the Top End of the Northern Territory, April-May 2018   5
Figure 2a:      Survey blocks and survey transects flown in the Moyle River floodplain to
                Finniss River floodplain survey area

Aerial Survey of Magpie Goose numbers in the Top End of the Northern Territory, April-May 2018   6
Figure 2b: Survey blocks and survey transects flown in the Adelaide River floodplain to
Murganella Creek floodplain survey area.
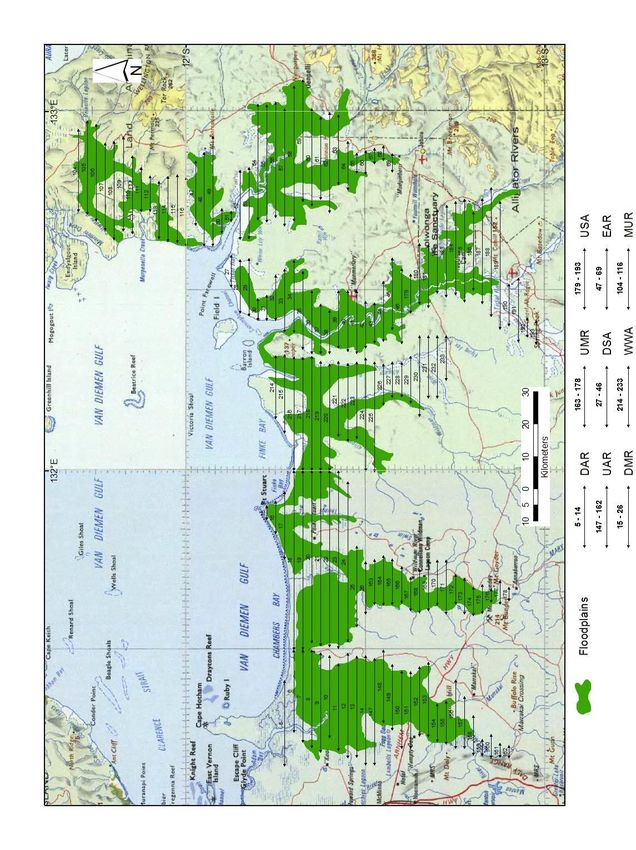
Aerial Survey of Magpie Goose numbers in the Top End of the Northern Territory, April-May 2018 7Figure 2c: Survey blocks and survey transects flown in the Arnhem Land floodplains
survey area.
Aerial Survey of Magpie Goose numbers in the Top End of the Northern Territory, April-May 2018 8Results Survey Block Population and Density Estimates The population estimates, density and precision figures for the three survey areas are presented in Tables 2a, 2b and 2c. As has been the pattern of previous surveys, just over two thirds of the magpie geese were observed in the survey area from west of Adelaide River to Murganella Creek, with a third of these (and almost a quarter of the overall total population) being recorded in one block, East Alligator River. This highlights the extremely clumped population distribution of the species (dispersion index: ratio of mean to variance for Survey Area 1 = 8.8 where ratio ~ 0 = uniform, ~ 1 = random and >> 1 = clumped; Caughley and Sinclair 1994). Similarly, survey area 2 (Arnhem Land, dispersion index = 6.8) and survey area 3 (Moyle to Finniss; dispersion index = 4.0) exhibited highly clumped dispersion patterns. This clumped dispersion patterns lead to coefficient of variation (a measure of precision or the confidence of the individual estimator in question) for individual survey blocks of a moderate to high level; typically 20-40% but for some blocks as high as 90% (Table 2 a,b,c). However, the high sampling intensity means that at a whole of survey block level the estimate is generally acceptable (less than 20% for the higher density survey areas and 33% for Arnhem Land). The overall (three survey areas combined) Magpie Goose population estimate was 918,200 + 116,961, equivalent to an overall density of 40.1 + 5.1 geese/km2, at a precision of 12.7%. For Magpie Goose nests the estimate was 77,839 ± 14,250, an overall density of 3.4 + 0.6 nests/km2, at a precision of 18.3%. For both the goose population estimate and the nest estimate the precision value are at acceptable levels, indicating that the overall population estimates are robust. Nesting rate and rainfall The ratio of nests to total population of Magpie Goose gives a broad indication of the nesting rate for the season. For 2018 the value was 8.5%, although this is likely to be an underestimate for the overall season due to an apparently lower than normal synchrony in nesting, possibly influenced by the “stop start” nature of the 2017/18 wet season. Rainfall recorded in the western (Darwin Airport) and eastern (Groote Eylandt) Top End across the wet season is given in Figure 3 a & b. Overall, the main nesting areas for Magpie Goose received above average rainfall, but this did not extend across the whole of the wet season in the east of the Top End. With respect to the rainfall received across the main nesting habitat areas, the season started very strongly, then there was a relative dry period across December, meaning that the cumulative rainfall fell back in line with long term averages. This was followed by a relatively high rainfall in January associated with a very strong monsoon trough, and average rainfall for February through April, which pushed the season back above the long term average in the central and west Top End (BoM 2018). It is likely this “stop start” pattern across the wet caused some geese to start nesting relatively early, but others to delay (especially in the most northern areas which were still largely inundated at the time the surveys occurred). During the reconnaissance flights, the full gamut of nesting was observed Aerial Survey of Magpie Goose numbers in the Top End of the Northern Territory, April-May 2018 9
from nests just beginning construction, to eggs in nests, through to a small number of areas
where fledgling birds had already arrived. Consequently, the recorded nest numbers and
derived nesting rates may be an underestimate.

Table 2a:       Estimated population, density (in brackets), and precision (coefficient of
variation expressed as a %) for Magpie Goose and nests in the Moyle River floodplain to
Finniss River floodplain survey area. Values are + standard error (incorporating the errors
resulting from sampling).

        Block (area in km2)                  Magpie Goose                   Magpie Goose nests
            Moyle River                     48,976 ± 19,521                     13,567 ± 4,582
              (731)                           (35.6 ± 14.2)                       (9.9 ± 3.3)
                                                 39.9%                              33.8%
          Daly River west                   58,179 ± 23,352                     2,152 ± 1,154
              (1,164)                         (50.0 ± 20.1)                       (1.8 ± 1.0)
                                                 40.1%                              53.6%
         Daly River south                    23,121 ± 8,403                       759 ± 643
             (1,362)                           (17.0 ± 6.2)                       (0.6 ± 0.5)
                                                 36.3%                              84.8%
         Daly River north                   40,798 ± 14,800                      2137 ± 903
              (958)                           (42.6 ± 15.5)                       (2.2 ± 0.9)
                                                 36.3%                              42.3%
          Reynolds River                     29,317 ± 7,943                      2,137 ± 903
             (1,648)                           (17.8 ± 4.8)                       (2.2 ± 0.9)
                                                 27.1%                              42.3%
           Finniss River                     9,545 ± 5,088                        526 ± 320
              (1,233)                          (7.7 ± 4.1)                        (0.4 ± 0.3)
                                                 53.3%                              60.7%
        Total survey area                  209,937 ± 36,125                    21,946 ± 4,975
             (8,186)                         (27.1 ± 4.7)                        (2.8 ± 0.6)
                                                17.2%                              22.7%

Aerial Survey of Magpie Goose numbers in the Top End of the Northern Territory, April-May 2018   10
Table 2b: Estimated population, density (in brackets), and precision (coefficient of
variation expressed as a %) for Magpie Goose and nests in the Adelaide
River floodplain to Murganella Creek floodplain survey area. Values are +
standard error (incorporating the errors resulting from sampling).
Block (area in km2) Magpie Goose Magpie Goose nests
Downstream Adelaide 38,703 ± 17,277 13,102 ± 6,774
River (48.5 ± 21.7) (16.4 ± 8.5)
(798) 44.6% 51.7%
Upstream Adelaide River 31,208 ± 11,854 1,425 ± 526
(719) (43.4 ± 16.5) (2.0 ± 0.7)
38.0% 36.9%
Downstream Mary River 90,276 ± 39,408 8,735 ± 3,687
(1,240) (72.8 ± 31.8) (7.0 ± 3.0)
43.7% 42.2%
Upstream Mary River 9,681 ± 6,765 10,346 ± 8,881
(490) (19.8 ± 13.8) (21.1 ± 18.1)
69.9% 85.8%
Wildman/West Alligator 68,908 ± 34,020 6,505 ± 5,349
River (57.2 ± 28.2) (5.4 ± 4.4)
(1,205) 49.4% 82.2%
Downstream South 82,029 ± 37,547 3,686 ± 1,077
Alligator River (89.7 ± 41.0) (4.0 ± 1.2)
(915) 45.8% 29.2%
Upstream South Alligator 14,032 ± 3,636 1,657 ± 610
River (14.8 ± 3.8) (1.7 ± 0.6)
(950) 25.9% 36.8%
East Alligator River 222,375 ± 77,997 6,071 ± 2,146
(1,404) (158.3 ± 55.5) (4.3 ± 1.5)
35.1% 35.3%
Murganella 61,983 ± 28,131 3,609 ± 2,208
(822) (75.4 ± 34.2) (4.4 ± 2.7)
45.4% 61.9%
Total survey area 619,195 ± 107,205 55,135 ± 13,351
(8,657) (72.5 ± 12.5) (6.5 ± 1.6)
17.3% 24.2%
Aerial Survey of Magpie Goose numbers in the Top End of the Northern Territory, April-May 2018 11Table 2c: Estimated population, density (in brackets), and precision (coefficient of
variation expressed as a %) for Magpie Goose and nests in the Arnhem Land floodplain
survey area. Values are + standard error (incorporating the errors resulting from sampling).
Block (area in km2) Magpie Goose Magpie Goose nests
Liverpool - Tomkinson 68.3 ± 45.2 0±0
River, Maningrida (0.1 ± 0.0) (0 ± 0)
(975) 66.2% -
Blyth - Cadel River 8,588 ± 6,097 46.5 ± 42.3
(1,338) (6.4 ± 4.6) (0.03 ± 0.03)
71.0% 91.0%
Arafura Swamp 64,535 ± 28,081 480 ± 216
(1,362) (33.3 ± 14.5) (0.2 ± 0.1)
43.5% 45.0%
Buckingham Bay 14,146 ± 7,443 186 ± 140
(595) (11.4 ± 6.0) (0.1 ± 0.1)
52.6% 75.4%
Gorrumurru River 1,093 ± 780 46.5 ± 42.5
(2.0 ± 1.5) (0.1 ± 0.1)
71.4% 91.5%
Blue Mud Bay 14,146 ± 7,442 185 ± 140
(11.4 ± 6.0) (0.1 ± 0.1)
52.6% 75.4%
Total survey area 89,068 ± 29,696 759 ± 264.5
(4,594) (13.4 ± 4.5) (0.11 ± 0.04)
33.3% 34.9%
Aerial Survey of Magpie Goose numbers in the Top End of the Northern Territory, April-May 2018 12a) b) Figure 3 Rainfall recorded at a) Darwin and b) Groote Eylandt across the 2017/18 wet season, with comparison to historical records. Data and Figures from bom.gov.au. Aerial Survey of Magpie Goose numbers in the Top End of the Northern Territory, April-May 2018 13
Discussion

Population Size and Dispersion

As has previously been reported, the distribution of magpie geese within the survey area is
highly clumped providing challenges in adequately surveying numbers. However, the high
sampling intensity, coupled with the extensive areas surveyed, delivered population
estimates for each of the three survey blocks with acceptable levels of precision.

The population estimate for Magpie Goose in the Top End was 918,200 ± 116,961 (mean ±
standard error), and represents a conservative estimate of the species population in the
Northern Territory, recognising that some birds may occur outside the survey area at the
time of survey.

The Adelaide River to Murganella Creek survey region contained the majority of geese (two
thirds of the total population) with over a third of the survey region density (and nearly one
quarter of the total birds) occurring in the East Alligator River Survey Block. This survey block
represents some 140,000 ha (approximately 6 %) of the 2.3 M ha total survey area.

This is a similar pattern to most, but not all recent years, with 2011 and 2017 not exhibiting
such a significant congregation in this area. The area is clearly of major importance to the
overall population of the species, although the same pattern is not evident from the nesting
data where five other survey blocks (four in Area 1 and one in Area 3) had higher nesting
densities.

The precision of the estimate was reasonably good and we can be 95% certain that the
population lies between 688,956 and 1,147,444. A coefficient of variation of under 15% for
the overall survey area compares favourably with aerial counts of waterbirds in eastern
Australia (e.g. Kingsford 2001; coefficients of variation of 18-60%) and is comparable with
previous years surveys where the coefficient of variation have been in the range of 8-18 %
(see Table 1).

A comparison of the changes in magpie goose population from 2017 to 2018 is provided in
Table 3. The population estimate represents a 26.7 % increase on the 2017 count, which was
the lowest that had been recorded since broad scale aerial surveys commenced in the early
80’s.

The year to year increase equates to an annual rate of increase (r) of 0.237. This value is
towards the top of the range of the theoretical plausible rm for the species proposed by
Brook and Whitehead (2005; between 0.11 and 0.28), suggesting the population was
growing at close to its maximum rate. This is also consistent with the relatively high nesting
rate that was observed in 2017 (Groom and Saalfeld 2017).

Magpie Goose nests were estimated to be 77,839 ± 14,250 (coefficient of variation 18.3%)
for the surveyed area, which is similar with nesting levels for 2017. This can considered high
to very high nesting compared with relative nesting in previous years and is suggestive of a
continued rise in population in 2018/19 if other factors including harvest from hunting are

Aerial Survey of Magpie Goose numbers in the Top End of the Northern Territory, April-May 2018   14
considered to be moderate to low. Rainfall preceding the survey period was above average
across the wet season consistent with achieving a high nesting rate for this season (Figure 3).
It is notable that there was very little nesting recorded in the Arnhem Land survey area.

Table 3:         Comparison of Top End Magpie Goose population and nest estimates from
                 2017 and 2018 by Survey Area.

        Survey Area                               2017                                2018
 Goose Numbers (± SE)
 Adelaide River to                           411,989 ± 57,477                   619,195 ± 107,205
 Murganella Creek
 Moyle River to Finniss River                231,555 ± 40,0074                  209,937 ± 36,125

 Arnhem Land                                 Estimate 80,956                    89,068 ± 29,696

 Overall                                     724, 500 ± 78,750                  918,200 ± 116,961

 Nests (± SE)

 Adelaide River to                           63,978 ± 12,826                    55,135 ± 13,351
 Murganella Creek
 Moyle River to Finniss River                20,846 ± 3,653                     21,946 ± 4,975

 Arnhem Land                                 Estimate 9,676                     759 ± 265

 Overall                                     94,500 ± 14,605                    77,839 ± 14,250

Population trends and outlook

Magpie Goose population estimates have been highly variable over the 35 years that the
population has been formally monitored (Figure 4), and the population underwent a marked
decline from a historically high estimate in 2012 to a historical low in 2017. Care must be
taken in making any direct comparisons between years prior to the standardisation of survey
methodology in 2011. The population has been trending downwards since 2012 with steep
declines in abundance in 2014 and 2017, both following a year with very poor nesting. A
broad comparison of population change and the previous year’s nesting rate provides some
evidence of a concordance of high and low nesting with rises and declines in subsequent
population (Table 4). This is in agreement with previous studies which have concluded a
relationship between Magpie Goose numbers and rainfall (e.g. Bayliss 1989, Bayliss and
Yeomans 1990a, Whitehead and Saalfeld 2000). The high nesting rate observed this year
suggests the population should continue to increase or, at worst, remain stable.

From a management perspective, the monitoring results indicate that, whilst there has been
a significant increase in the population since 2017, the total population remains low relative
to levels recorded over the past four decades. This suggest caution should be applied in

Aerial Survey of Magpie Goose numbers in the Top End of the Northern Territory, April-May 2018      15
dealing with potential impacts of the various direct and indirect mortality agents, if the
population is to meet its full productive capacity. The current Management Program for the
Magpie Goose (Anseranas semipalmata) in the Northern Territory of Australia, 2009-2014)
specifies the objectives of maintaining permits for pest mitigation to < 1% of the population
level in any given year, and for hunting pressure (both indigenous and non-indigenous) to be
kept below 10% over 3 years and not exceeding a maximum of 14% in any given year. The
results from this year’s survey will inform management decisions to be made for the
upcoming 2018/19 period.
4000 2000
Goose Population Estimate - Wet
Season End 1800
Nests
1600
3000
1400
1200
Nests 000's
Goose 000's
2000 1000
800
600
1000
400
200
0 0
1983
1985
1987
1989
1991
1993
1995
1997
1999
2001
2003
2005
2007
2009
2011
2013
2015
2017
Year
Figure 6: Magpie Goose population and nest estimates for the period 1983 to 2018,
derived from aerial survey data at the end of the wet season. Note that
goose numbers (left axis) and nest numbers (right axis) are on different scales.
Aerial Survey of Magpie Goose numbers in the Top End of the Northern Territory, April-May 2018 16Table 4: Comparison of Top End Magpie Goose population trends and previous years
nesting success from 2011 and 2018, and predicted trend in 2019. [A] Nest
count relative to overall goose population; [B] Change in estimated population size
from previous year; [C] Index of nesting rate: < 5 % = Low (L), 5-10% = Moderate (M),
10-20%= High (H),>20% = Very high (VH); [D] Index of nesting success projected
forward 1 year; [E] Observed and predicted population trend relative to nesting
success index, > 10 % population change = Increase (I), - 10%-+10% Stable (S); -10% -
-40% = Decrease (D); > - 40% change = Big Decrease (BD).
[D]
[B] Year to Nesting
[A] Year [C] Success [E]
Nesting Population Nesting Previous Population
Year Proportion Change Success Year Trend
2011 12% VH
2012 6% 21% M VH I
2013 1% -14% L M D
2014 10% -48% H L BD
2015 9% -8% H H S
2016 3% 8% L H S
2017 13% -44% VH L BD
2018 10% 25% H VH I
2019 H S-I (projected)
Aerial Survey of Magpie Goose numbers in the Top End of the Northern Territory, April-May 2018 17References
Bayliss, P (1989). Population Dynamics of Magpie Geese in Relation to Rainfall and Density:
Implications for Harvest Models in a Fluctuating Environment. Journal of Applied
Ecology. 26(3), 913-924
Bayliss, P., and K.M. Yeomans (1990a). Seasonal distribution and abundance of magpie
geese, Anseranas semipalmata Latham, in the Northern Territory, and their relation
to habitat, 1983-86. Aust. Wildl. Res., 17, 15-38.
Bayliss, P., and K.M. Yeomans (1990b). Using Low-level Aerial Photography to Correct Bias
in Aerial Survey Estimates of Magpie Goose and Whistling Duck Density in the
Northern Territory. Aust. Wildl. Res., 17, 1-10.
BoM (2018). Seasonal Climate Summary for Northern Territory. May 1, 2018. Bureau of
Meteorology, Australian Government. - Product code IDCKGCC2R0
http://www.bom.gov.au/climate/current/season/nt/summary.shtml.
Delaney R., Fukuda Y. and K. Saalfeld. (2009). Management Program for the Magpie Goose
(Anseranas semipalmata) in the Northern Territory of Australia, 2009–2014.
Northern Territory Department of Natural Resources, Environment, the Arts and
Sport, Darwin.
Caughley, G., and G.C. Grigg (1981). Surveys of the distribution and density of kangaroos in
the pastoral zone in South Australia, and their bearing on the feasibility of aerial
survey in large and remote areas. Aust. Wildl. Res., 8, 1-11.
Caughley, G., and Sinclair, A.R.E. (1994). Wildlife ecology and management. Blackwell
Science Cambridge, MA.
Jolly, G.M. (1969). Sampling methods for aerial census of wildlife populations. E. Afr. agric.
For. J., 34, 46-49.
Marsh, H., and D.F. Sinclair (1989). An experimental evaluation of dugong and sea turtle
aerial survey techniques. Aust. Wildl. Res., 16, 639-50.
Saalfeld, W.K. (1990). Aerial survey of Magpie Goose populations and nesting in the Top end
of the Northern Territory - Wet Season 1990. Technical Report Number 50,
Conservation Commission of the Northern Territory.
Saalfeld, W.K. (2011). Aerial Survey of Magpie Geese in the Darwin to Kakadu region of the
‘Top End’, Northern Territory. 31st May, 2011 to 5th June, 2011. A report to the
Department of Natural Resources, Environment, the Arts and Sport.
Saalfeld, W.K. (2012). Aerial Survey of Magpie Geese in the Moyle River floodplain to Finniss
River floodplain region of the ‘Top End’, Northern Territory. 8th May, 2012 to 14th
May, 2012. A report to the Department of Natural Resources, Environment, the Arts
and Sport.
Saalfeld, W.K. (2013). Aerial Survey of Magpie Geese in the Adelaide River floodplain to
Murganella floodplain region of the ‘Top End’, Northern Territory. 18th April, 2013 to
24th April, 2013.
Saalfeld, W.K. (2014). Aerial Survey of Magpie Geese in the ‘Top End’, Northern Territory.
Moyle River floodplains to Murganella Creek floodplains. 31st March 2014 to 4th April
Aerial Survey of Magpie Goose numbers in the Top End of the Northern Territory, April-May 2018 182014 and 13th May 2014 to 19th May 2014. A report to the Department of Land
Resource Management, Darwin, Northern Territory.
Saalfeld, W.K. (2015). Aerial Survey of Magpie Geese in the ‘Top End’, Northern Territory.
Moyle River floodplains to Murganella Creek floodplains. 5st May 2015 to 16th May
2015. Flora and Fauna Division, Department of Land Resource Management,
Palmerston, Northern Territory.
Saalfeld, W.K. (2016). Aerial Survey of Magpie Geese in the ‘Top End’, Northern Territory.
Moyle River floodplains to Murganella Creek floodplains. 3rd May 2016 to 22nd May
2016. A report to the Department of Land Resource Management, Darwin, Northern
Territory.
Groom, R. and Saalfeld, W.K. (2017). Aerial Survey of Magpie Geese in the ‘Top End’,
Northern Territory. Moyle River floodplains to Murganella Creek floodplains. April 24
– May 6 2017. A report to the Department of Environment and Natural Resources,
Palmerson, Northern Territory.
Whitehead, P. J. and Saalfeld, K. (2000) Nesting phenology of magpie Geese (Anseranas
semipalmata) in monsoonal northern Australia: responses to antecedent rainfall. J.
Zoo. 251, 495-508.
Aerial Survey of Magpie Goose numbers in the Top End of the Northern Territory, April-May 2018 19You can also read