Phase Two of the Integrative Monsoon Frontal Rainfall Experiment (IMFRE-II) over the Middle and Lower Reaches of the Yangtze River in 2020
←
→
Page content transcription
If your browser does not render page correctly, please read the page content below
ADVANCES IN ATMOSPHERIC SCIENCES, VOL. 38, MARCH 2021, 346–356

• News & Views •

                         Phase Two of the Integrative Monsoon Frontal Rainfall
                          Experiment (IMFRE-II) over the Middle and Lower
                                 Reaches of the Yangtze River in 2020
                                     Chunguang CUI1, Xiquan DONG*2, Bin WANG1, and Hao YANG1

                      1Hubei   Key Laboratory for Heavy Rain Monitoring and Warning Research, Institute of Heavy Rain,
                                             China Meteorological Administration, Wuhan 430205, China
               2Department     of Hydrology and Atmospheric Sciences, University of Arizona, Tucson, Arizona 85721-0011, USA

                               (Received 10 August 2020; revised 24 September 2020; accepted 30 September 2020)

                                                                           ABSTRACT
              Phase Two of the Integrative Monsoon Frontal Rainfall Experiment (IMFRE-II) was conducted over the middle and
        lower reaches of the Yangtze River during the period 16 June to 19 July 2020. This paper provides a brief overview of the
        IMFRE-II field campaign, including the multiple ground-based remote sensors, aircraft probes, and their corresponding
        measurements during the 2020 mei-yu period, as well as how to use these numerous datasets to answer scientific questions.
        The highlights of IMFRE-II are: (1) to the best of our knowledge, IMFRE-II is the first field campaign in China to use
        ground-based, airborne, and spaceborne platforms to conduct comprehensive observations over the middle and lower
        reaches of the Yangtze River; and (2) seven aircraft flights were successfully carried out, and the spectra of ice particles,
        cloud droplets, and raindrops at different altitudes were obtained. These in-situ measurements will provide a “cloud truth”
        to validate the ground-based and satellite-retrieved cloud and precipitation properties and quantitatively estimate their
        retrieval uncertainties. They are also crucial for the development of a warm (and/or cold) rain conceptual model in order to
        better understand the cloud-to-rain conversion and accretion processes in mei-yu precipitation events. Through an
        integrative analysis of ground-based, aircraft, and satellite observations and model simulations, we can significantly
        improve our cloud and precipitation retrieval algorithms, investigate the microphysical properties of cloud and
        precipitation, understand in-depth the formation and dissipation mechanisms of mei-yu frontal systems, and improve cloud
        microphysics parameterization schemes and model simulations.
        Key words: 2020 mei-yu frontal systems, IMFRE-II and its highlights, Comprehensive observations from ground-
        based, airborne and spaceborne platforms
        Citation: Cui, C. G., X. Q. Dong, B. Wang, and H. Yang, 2021: Phase Two of the Integrative Monsoon Frontal Rainfall
        Experiment (IMFRE-II) over the middle and lower reaches of the Yangtze River in 2020. Adv. Atmos. Sci., 38(3), 346−356,
        https://doi.org/10.1007/s00376-020-0262-9.

1.     Brief summary of IMFRE-II
     Phase Two of the Integrative Monsoon Frontal Rainfall Experiment (IMFRE-II) was conducted over the middle and
lower reaches of the Yangtze River during the period 16 June to 19 July 2020. During IMFRE-II, ten heavy rainfall events
occurred and were observed by seven ground-based observational systems, the Shanxi KingAir (KA350) aircraft, and
Fengyun and global precipitation measurement (GPM) satellites. The primary goal of IMFRE-II is to investigate the spati-
otemporal evolution of mei-yu frontal systems, such as their horizontal and vertical distributions, from west to east over the
middle and lower reaches of the Yangtze River through comprehensive observations from ground-based and spaceborne pass-
ive and active remote sensors, and aircraft in-situ measurements, as well as model simulations.
     IMFRE-II was motivated by IMFRE-I, which was conducted from 10 June to 10 July 2018 over the middle reaches of
the Yangtze River and organized by the Wuhan Institute of Heavy Rain (IHR). IMFRE-I maximized the use of our observa-
tional capacity enabled by a suite of ground-based remote sensing instruments, most notably the IHR Mesoscale Heavy Rain-

* Corresponding author: Xiquan DONG
  Email: xdong@arizona.edu

© Institute of Atmospheric Physics/Chinese Academy of Sciences, and Science Press and Springer-Verlag GmbH Germany, part of Springer Nature 2021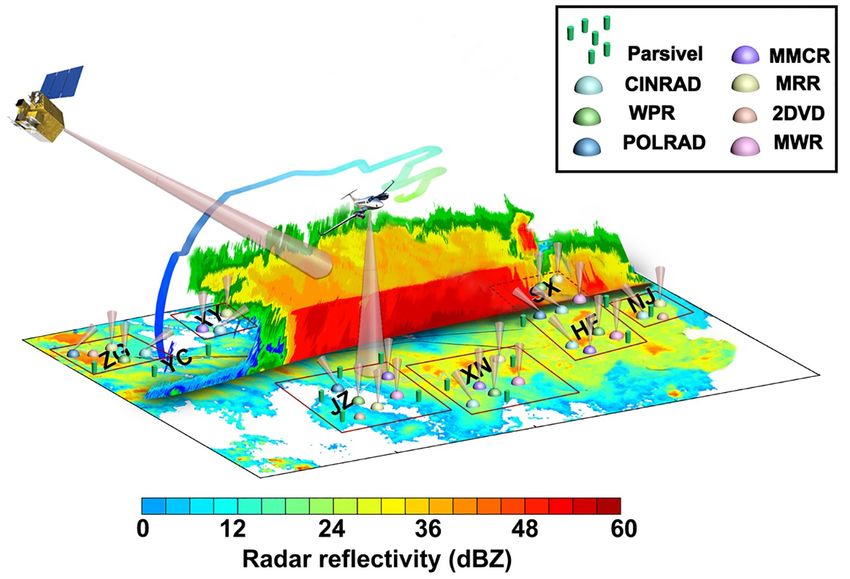
MARCH 2021                                                    CUI ET AL.                                                      347

fall Observing System (MHROS), including different wavelengths of radars, microwave radiometers, and disdrometers.
The KA350 aircraft participating in the campaign is equipped with Ka-band cloud radar and different probes. The compre-
hensive datasets from both the MHROS and aircraft instruments are combined with available satellite observations and
model simulations to answer the three scientific questions proposed in IMFRE-I.
     The 2020 mei-yu season was an extreme one—its rainfall intensity and coverage broke records. The heavy precipita-
tion events during the 2020 mei-yu season can be briefly summarized by the following three characteristics.
1.1. Stronger rainfall intensity and larger areal coverage over a longer period
     The 2020 mei-yu season over the Yangtze River basin (Hubei) started on 8 June and ended on 21 July, which is eight
days earlier and 11 days later than its climatological mean start date (16 June) and end date (10 July), respectively. The
2020 mei-yu season lasted for 44 days, which is 19 days longer than the climatological mean, and ranks as the eighth
longest mei-yu season since 1951. During the 2020 mei-yu season, the rainfall centers were primarily located over the
middle and lower reaches of the Yangtze River. Some regions, such as southern Chongqing, eastern Hubei, northern Hunan,
northwestern Jiangxi, central and southern Anhui, central and southern Jiangsu, and northern Zhejiang, received more than
600 mm rainfall, which is 50% higher than normal years. The accumulated rainfall amounts along the Yangtze River were
twice as much as or even more than their climatological means. Total rainfall amounts in the southern and central-eastern
parts of Hubei Province and the central and southern parts of Anhui Province exceeded 1000 mm (Fig. 1). The major rain-
belt was located in the Yangtze River−Huaihe River valley in early June, shifted southward from middle and late June to
early July, and maintained steadily along the Yangtze River and over its northern part. In mid-July, the rainbelt was primar-
ily located over the Yangtze River with slight meridional fluctuation.
     Statistical results of precipitation observed at 735 national weather stations in the Yangtze River basin show that the accu-
mulated precipitation amount during the 2020 mei-yu season exceeded 200 mm over the entire basin (except for a few areas
in the middle and upper reaches of the Jinsha River). The regional average precipitation amount during the 2020 mei-yu sea-
son over the middle and lower reaches of the Yangtze River was 435.1 mm, which is the largest one since 1961. The second
largest precipitation amount is 382.7 mm in 2016. Note that the 60-yr average precipitation amount during the same period
is 263.1 mm. The average number of heavy rainfall days in 2020 was 2.3 days/station, the highest one during the same
period since 1961.
1.2.    More precipitation events with extremely heavy rainfall
       During the 2020 mei-yu season, the Yangtze River basin experienced a total of ten precipitation events, mostly along

                  Fig. 1. Spatial distributions of (a) the 2020 mei-yu cumulative precipitation (units: mm) and (b) the
                  precipitation anomaly (units: %) against the climatological mean during the period 8 June to 20 July
                  2020 in the Yangtze River basin.
348                                     FIELD EXPERIMENT FOR MEI-YU FRONTAL SYSTEM                                      VOLUME 38

or near the Yangtze River. Table 1 lists the time periods and regions of these ten precipitation events, as well as their
highest rainfall for each event, where quite a few regions experienced repeatable heavy precipitation events. Short-term tor-
rential rainstorms frequently occurred during the 2020 mei-yu season. For example, on 6 July 2020, 3-h cumulative rainfall
of 178.5 mm during 0000−0300 LST (LST=UTC+8) and 24-h cumulative rainfall of 502 mm were observed at Jingzhou,
Hubei Province; 6-h cumulative rainfall of 309.4 mm during 0000−0600 LST and 24-h cumulative rainfall of 436 mm were
observed at Wuhan, Hubei Province; and 24-h cumulative rainfall of 993.9 mm occurred at Huanggang, Hubei Province.
The accumulated rainfall amounts at these three stations all broke their historical records since the establishment of these sta-
tions. In addition, several extreme weather events occurred during the 2020 mei-yu season. For example, EF2 tornadoes
struck Yangzhou, Jiangsu Province at 1400 LST 12 June and Jingmen in Hubei Province at 1900 LST 27 June.
     These extreme heavy rainfall events have caused severe damage to property, threatened human lives, and disrupted
daily life with urban and rural flooding, mountain torrents, landslides, and other geological disasters in many places. For
instance, the national college entrance exam in Shexian of Anhui Province was delayed due to severe flooding. At 0000
LST 12 July, the water level of Poyang Lake reached 22.53 m, exceeding the 1998 water level and breaking the historical
record since the availability of hydrological observations.
1.3.    Anomalous large-scale synoptic and dynamic patterns
     The anomalous large-scale synoptic and dynamic patterns are one of the main factors that led to the extremely heavy rain-
fall events during the 2020 mei-yu season. The western Pacific subtropical high (WPSH) ridge line was located 10° west of
its normal position and was stronger than normal years, as illustrated in Figs. 2a and b. The southwesterlies in the middle
and lower troposphere (i.e., the low-level jet, LLJ) were much stronger than in normal years over the southern part of the
Yangtze River (Figs. 2a and b). Significant convergences of both wind direction and wind speed developed over the middle
and lower reaches of the Yangtze River. Huge amounts of water vapor were transported by the LLJ from the southwest to
the northeast on the west side of the WPSH and converged with the dry and cold air masses transported from the north over
the middle and lower reaches of the Yangtze River. The strong convergence of water vapor flux in this region provided anom-
alously high moisture content (Figs. 2c and d) and eventually resulted in extremely severe rainstorms during the 2020 mei-
yu period.

2.      Scientific and technical objectives of IMFRE-II
      Mei-yu frontal precipitation is a result of interactions between multi-scale convective systems, such as meso-β-scale
(20−200 km) and meso-γ-scale (2−20 km) convective systems. Conventional observations cannot provide the detailed spa-
tial and temporal variations of these multi-scale convective systems, as well as their cloud structures and microphysical pro-
cesses and properties. Therefore, it is necessary to use newly developed instruments and remote sensors (ground- and satel-
lite-based), as well as aircraft, to provide reliable observations of cloud and precipitation processes and properties at differ-
ent stages of mei-yu frontal systems and different altitudes in clouds. Only through an integrative analysis of the comprehens-
ive observations from different platforms can we obtain reliable macro- and microphysical properties of clouds and precipita-
tion along the mei-yu frontal systems, as well as their associated thermodynamic and dynamic variables. These comprehens-
ive datasets will pave the way for us to investigate the formation and dissipation processes and mechanisms of mei-yu
frontal systems. These datasets are also crucial for us in modifying the current existing microphysics schemes and possibly

Table 1. Brief summary of the 10 precipitation events during the 2020 mei-yu period in the Yangtze River basin.

                                                                                                       Maximum precipitation and
Order        Period                                  Heavy rainfall area                                    occurrence site
  1        8−11 June    Wujiang River, Dongting Lake, Poyang Lake, Hanjiang River                     Sile, Hunan, 252.1 mm
  2       11−14 June    Both banks of the top and lower reaches of the Yangtze River                  Gao Jiana, Hunan, 353 mm
  3       15−18 June    Jianglingjiang River, Wujiang River, and the lower reaches of the Yangtze     Changping, Sichuan, 333 mm
                           River
  4       20−25 June    Hanjiang River, Wujiang River, Poyang Lake and the lower reaches of the       Shendu, Hunan, 403.5 mm
                           Yangtze River
  5       26−30 June    The top and lower reaches of the Yangtze River                                Huaban, Sichuan, 906.1 mm
  6        1−4 July     The top and lower reaches of Jinsha River, Wujiang River, Poyang Lake and     Yutang, Jiangxi, 311.2 mm
                           the top reaches of Yangtze River
  7          4−8 July   The top and lower reaches of the Yangtze River                                Bahe, Hubei, 993.9 mm
  8         9−12 July   Jialing River, Wujiang River Basin, Dongting Lake, Poyang Lake                Yonghe, Jiangxi, 480.9 mm
  9        14−17 July   The upper and lower reaches of the Yangtze River                              Hong Chiba, Chongqing,
                                                                                                        441.9 mm
 10        17−19 July   The top and lower reaches of the Yangtze River                                Sungang, Anhui, 414.8 mm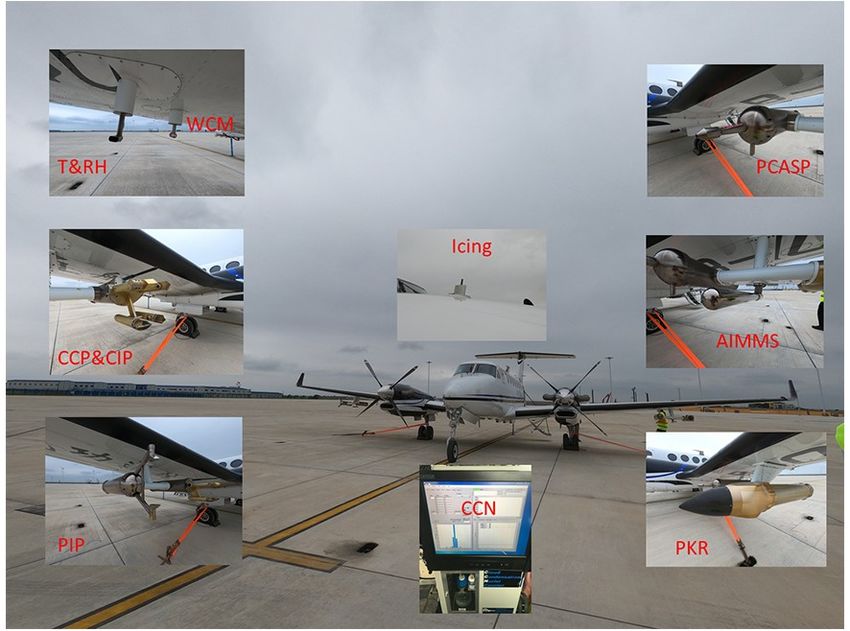
MARCH 2021                                CUI ET AL.                                  349

             Fig. 2. (a) 500-hPa mean geopotential height (GH, contours), 850-hPa
             mean winds (vectors) and (c) integrated moisture flux (vectors and
             shading) derived from NCEP reanalysis during the 2020 mei-yu season
             (8 June to 20 July 2020) and (b, d) their anomalies (relative to the
             climatological mean for the period 1981−2010; shaded). The contours in
             (c) are the averaged GH for the period 1981−2010. The blue box in (a)
             is the IMFRE-II field region.
350                                    FIELD EXPERIMENT FOR MEI-YU FRONTAL SYSTEM                                       VOLUME 38

develop new ones that are suitable for simulating the mei-yu rain events along the Yangtze River and improve the accuracy
of model forecasts.
     Through comprehensive observations and numerical modeling simulations, we aim to achieve the following scientific
goals during the IMFRE-II field campaign: (1) investigate the dynamic and thermodynamic structures of the mesoscale sys-
tems embedded in the mei-yu frontal system and explore the hydrometeor and microphysical characteristics of cloud
clusters conducive to rainstorms; (2) reveal the roles of the moisture transported from the southwest and environmental condi-
tions on the formation and development of clouds and precipitation; (3) through comparing the similarities and differences
of the mei-yu frontal systems between the middle and lower reaches of the Yangtze River, we will eventually build a concep-
tual model in order to better characterize the formation mechanisms and spatiotemporal evolution of mei-yu frontal sys-
tems over the middle and lower reaches of the Yangtze River.
     Based on IMFRE-I and -II, as well as follow-up field campaigns, we will also address the following three key tech-
nical issues: (1) how to spatially and temporarily match different observations from ground-based and spaceborne remote
sensors and aircraft probes and how to quantitatively estimate ground-based and satellite observations and retrievals using air-
craft in-situ measurements; (2) how to use the aircraft measured spectra of ice particles, cloud droplets, and raindrops at dif-
ferent altitudes of clouds to develop a warm (and/or cold) rain conceptual model in order to better understand the cloud-to-
rain conversion and accretion processes in mei-yu precipitation events; (3) how to quantitatively evaluate the applicability
of various cloud microphysics schemes to mei-yu frontal systems using these comprehensive datasets.

3.     Design and layout of the IMFRE-II field campaign

3.1.    Experimental area
     IMFRE-II was organized by the Wuhan Institute of Heavy Rainfall, China Meteorological Administration, with joint
efforts from the University of Arizona, Georgia Institute of Technology, University of Science and Technology of China,
Nanjing University, Jiangsu Meteorological Bureau, Anhui Institute of Meteorological Sciences, Shanxi Weather Modifica-
tion Office, and Hubei Meteorological Bureau. There are seven surface sites in the middle and lower reaches of the Yangtze
River and their locations are shown in Figs. 3 and 4. Four surface sites are located in the middle reaches of the Yangtze
River (Zone I in Fig. 4) and the other three sites are located in the lower reaches (Zone II in Fig. 4). The ground-based
remote sensors and instruments at each surface site, and the aircraft probes, are introduced as follows.
3.2.    Ground-based observational system
     The ground-based observations include those obtained from MHROS, with additional observations from traditional
weather radars, regular soundings, and surface meteorological variables located at the four surface sites in Hubei Province
(Zone I in Fig. 4). IHR MHROS consists of mobile X-POL precipitation radars, millimeter wavelength cloud radars, fixed
S-band dual-polarimetric precipitation radars, micro-rain radars, GNSS/MET network, microwave radiometers, radiosonde
soundings, wind profiler radars, and Parsivel and 2DVD disdrometers. The other three surface sites in Zone II have similar
instruments as IHR MHROS, but not all. The surface remote sensors and instruments at each site used in this study are lis-
ted in Table 2.
3.3.    Aircraft probes and flight plan
     The KA350 aircraft participating in the IMFRE-II field campaign is equipped with the following sensors: cloud particle
probe (CDP), cloud imaging probe (CIP), and precipitation imaging probe (PIP) for measuring cloud and precipitation
droplet size distributions; PCASP and CCN-200 for measuring aerosol properties and cloud condensation nuclei; Ka-band
cloud radar for measuring cloud and light precipitation with a total of 17 flight hours during IMFRE-II (Table 3). The air-
craft was based out of the Yichang Three Gorges International Airport (denoted by the yellow triangle in Fig. 4), which is
104 km away from the Jingzhou surface site. The flight area is a grid box of 10 km × 10 km centered at the Jingzhou sur-
face site (site 3 and yellow rectangular area in Fig. 4). Figure 5 illustrates some probes and cloud radar aboard the KA350 air-
craft.
     The KA350 aircraft flew primarily in horizontal flight patterns at different altitudes with one to two vertical flights. Spe-
cifically, after taking off, the aircraft ascended to the cloud top or a maximum height of 7300 m and then circled around
over the targeted area. It maintained a steady, horizontal flight pattern at the highest altitude and then descended 300 m for
another horizontal circular flight. The aircraft repeatedly passed through the clouds at different altitudes until it reached a min-
imum altitude of 1500 m and then climbed up to 7300 m.

4.     Highlights of IMFRE-II
       IMFRE-II was conducted over the middle and lower reaches of the Yangtze River during the period 16 June to 19 July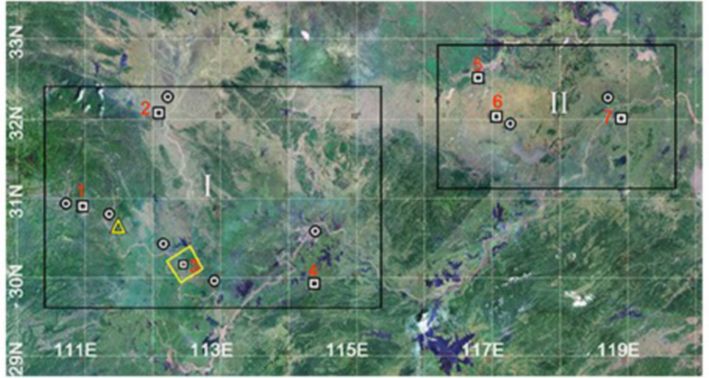
MARCH 2021 CUI ET AL. 351
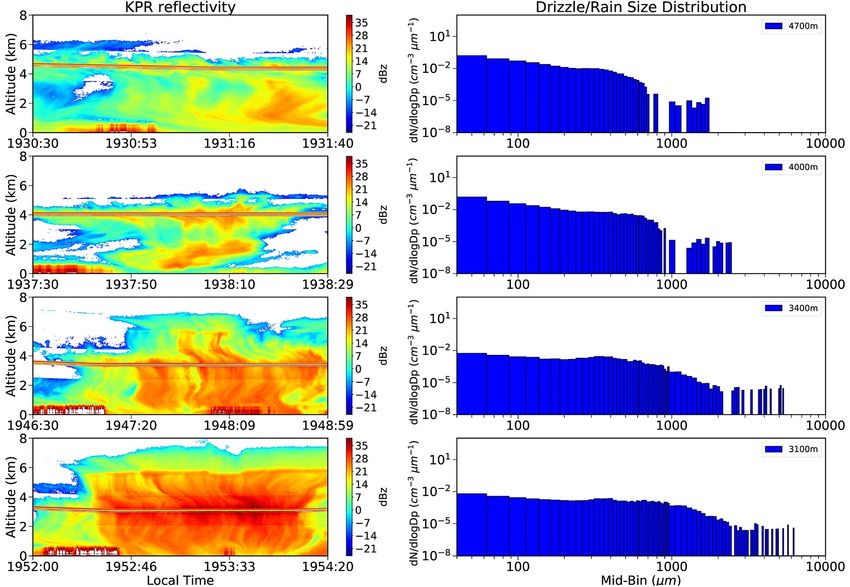
Fig. 3. Schematic diagram showing seven surface sites, satellite and aircraft observations
during the IMFRE-Ⅱ field campaign during the period June−July 2020 over the middle and
lower reaches of the Yangtze River. The abbreviations represent the names of the seven
surface as follows: ZG, Zigui; XY, Xiangyang; JZ, Jingzhou; XN, Xianning; SX, Shouxian;
HF, Hefei; NJ, Nanjing. In addition, YC denotes Yichang airport, where the aircraft takes off
and lands.
Fig. 4. Layout of the surface sites and the airport during IMFRE-Ⅱ over the middle and
lower reaches of the Yangtze River. The squares indicate the locations of the seven surface
sites, with the numbers 1−7 representing Zigui, Xiangyang, Jingzhou, Xianning, Shouxian,
Hefei, and Jiangning, respectively. The circular marks indicate the locations of precipitation
weather radars, the yellow triangle represents Yichang airport, and the yellow rectangle
indicates the flight area (over the Jingzhou surface site). The numbers I and II represent
observing target areas in the middle and lower reaches of the Yangtze River, respectively.
2020. During IMFRE-II, 10 mei-yu frontal systems were observed by different platforms, including both ground-based and
spaceborne active and passive remote sensors, KA350 probes, and onboard cloud radar. A large amount of remote sensing
observations and in-situ measurements related to heavy rainfall processes and properties during the mei-yu period were
obtained. Some highlights from IMFRE-II are presented as follows:
(1) To the best of our knowledge, IMFRE-II is the first field campaign in China to use ground-based, airborne, and space-
borne platforms to obtain comprehensive observations over the middle and lower reaches of the Yangtze River. Seven
ground-based observational systems, such as MHROS, with the addition of traditional weather radars, regular soundings,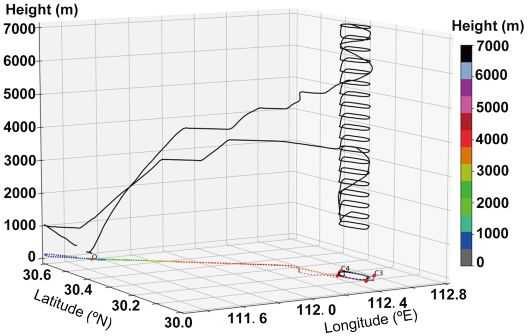
Table 2. List of surface sites and their corresponding sensors and instruments used in IMFRE-II.

                                                                                                                                                                                        352
                     Geographic
  Location           coordinates             Instrument                      Observed variables                  Operation mode          Range                   Resolution
 Zigui         110°42′39″E,            X-band dual-           Z, V, W, ZDR, ΦDP, ρHV                             Volume scan       150 km               Radial: 150 m
               30°51′48″N,             polarization radar                                                                                               Temporal: 6 min
               altitude: 1807 m        2-D video              Raindrop spectrum, falling speed,                  High-speed        100 × 100 mm         Horizontal: 0.19 mm
                                       disdrometer            shape, rain intensity, etc.                        camera                                 Vertical: 0.2 mm (< 10 m s−1)
                                                                                                                 observation                            Temporal: 1 min
                                       Micro-rain radar    Profiles of raindrop spectrum, terminal               Zenith pointing   0−24 km              Vertical: 100 m
                                                           velocity, intensity, etc.                                                                    Temporal:1 min
 Xiangyang     112°4′48′′E, 32°N,      Laser ceilometer    Cloud base height                                     Zenith pointing   0−12 km              Vertical: 15 m
               altitude: 163.4 m       Ka-band cloud radar Z, V, W, LDR                                          Zenith pointing   0.03−15 km           Vertical: 30 m
                                                                                                                                                        Temporal: 5 s
                                       Micro-rain radar       Profiles of raindrop spectrum, terminal            Zenith pointing   0−3 km               Vertical: 100 m
                                                              velocity, intensity, etc.                                                                 Temporal: 1 min
 Jingzhou      112°26′23″E,            Microwave              Cloud LWP and PWV.                                 Zenith pointing   0−10 km              Temporal: 2 min
               30°06′39″N,             radiometer
               altitude: 25 m          Micro-rain radar       Profiles of raindrop spectrum, terminal            Zenith pointing   0−6 km               Vertical: 50 m
                                                              velocity, intensity, etc.                                                                 Temporal: 1 min
                                       Lidar                  Wind profile, turbulence intensity, aerosol        Zenith pointing   0−6 km               Vertical: 30 m
                                                              backscattering intensity, extinction                                                      Temporal:10 s
                                                              coefficient, cloud base height, PBL height
                                       Tropospheric wind      Profiles of horizontal wind speed and direction,   Zenith pointing   0−14 km              Vertical: 120−480 m
                                       profiler radar         vertical wind velocity, Cn2                                                               Temporal: 6 min
                                       2-D video              Raindrop spectrum, falling speed, shape, rain      High-speed        100 × 100 mm         Horizontal: 0.19 mm
                                       disdrometer            intensity, etc.                                    camera                                 Vertical: 0.2 mm (< 10 m s−1)
                                                                                                                 observation                            Temporal: 1 min
                                       Ka-band cloud radar Z, V, W, LDR                                          Zenith pointing   0.01−20 km           Vertical: 10 m
                                                                                                                                                        Temporal: 5 s
                                       Jingzhou S-band        Z, V, W, ZDR, ΦDP, ρHV                             Volume scan       230 km               Radial: 150 m
                                       dual-polarization                                                                                                Temporal: 6 min
                                                                                                                                                                                        FIELD EXPERIMENT FOR MEI-YU FRONTAL SYSTEM

                                       radar
                                       Jianli X-band dual-    Z, V, W, ZDR, ΦDP, ρHV                             Volume scan       150 km               Radial: 75 m
                                       polarization radar                                                                                               Temporal: 6 min
 Xianning      114.3°E, 29.8°N,        Microwave              Cloud LWP and PWV                                  Zenith pointing   0−10 km              Temporal: 2 min
               altitude: 86 m          radiometer
                                       Ka-band cloud radar    Z, V, W, LDR                                       Zenith pointing   0.01−20 km           Vertical: 10 m
                                                                                                                                                        Temporal: 5 s
                                       Micro-rain radar       Profiles of raindrop spectrum,                     Zenith pointing   0−3 km               Vertical: 100 m
                                                              terminal velocity, intensity                                                              Temporal: 1 min
                                       Disdrometer            Raindrop spectrum, falling speed,                  High resolution   Ground observation   Temporal: 1 min
                                                              intensity, etc.                                    observation
                                       Tropospheric wind      Profiles of horizontal wind speed and direction,   Zenith pointing   0−16 km              Vertical: 120−480 m
                                       profiler radar         vertical wind velocity, Cn2                                                               Temporal: 6 min
                                       Laser ceilometer       Cloud base height                                  Zenith pointing   0−15 km
                                                                                                                                                                                        VOLUME 38
Table 2. (Continued.)
Geographic
Location coordinates Instrument Observed variables Operation mode Range Resolution
MARCH 2021
Shouxian 116°47′15′′E, Microwave Cloud LWP and PWV Zenith pointing 0−10 km Temporal: 2 min
32°26′9′′N, radiometer
altitude: 25.7 m Tropospheric wind Profiles of horizontal wind speed Zenith pointing 0−6 km Vertical: 120−480 m
profiler radar and direction, vertical wind Temporal: 6 min
velocity, Cn2
C-band radar Z, V, W, LDR Zenith pointing 0−15 km Vertical: 30 m
Temporal: 3 s
X-band dual- Z, V, W, ZDR, ΦDP, ρHV VOL 0−24 km Temporal: 1 min
polarization radar
Micro-rain radar Profiles of raindrop spectrum, terminal Zenith pointing 0−3.1 km Vertical: 100 m
velocity, intensity, etc. Temporal: 1 min
Hefei 117°03′26′′E Microwave Cloud LWP and PWV Zenith pointing 0−10 km Temporal: 3 min
31°57′20′′N, radiometer
altitude: 49.8 m Boundary layer wind Profiles of horizontal wind speed and Zenith pointing Above 60 m−6 km Vertical: 50−200 m
profiler radar direction, vertical wind velocity, Cn2 Temporal: 6 min
Disdrometer Raindrop spectrum, rain intensity Zenith pointing 0.001− 1200 mm h−1 1 min
Ka-band cloud radar Z, V, W, LDR Zenith pointing 0−20 km 6 s, 30 m
Aerosol/water vapor Water vapor mixing ratio Zenith pointing >2 km (in daytime) 7.5−300 m
lidar >10 km (at night) 1−30 min
Jiangning 118°53′58″E, 2-D video Raindrop spectrum, shape, rain intensity High-speed 100 × 100 mm Horizontal: 0.19 mm
31°55′54″N, disdrometer camera Vertical: 0.2 mm (< 10 m s−1)
altitude: 39 m observation Temporal: 1 min
CUI ET AL.
Micro-rain radar Profiles of raindrop spectrum, terminal High-speed 0−3 km Vertical: 100 m
velocity, intensity, etc. camera Temporal: 1 min
observation
Note: that Z = reflectivity factor; V = Doppler radial velocity; W = Doppler spectrum width; ZDR = differential reflectivity; ΦDP = differential phase shift; ρHV = correlation coefficient; LDR = linear depolarization
ratio; Cn2 = structure constant of atmospheric refractive index; LWP = liquid water path; PWV = precipitable water vapor; PBL = planetary boundary layer.
353354 FIELD EXPERIMENT FOR MEI-YU FRONTAL SYSTEM VOLUME 38
Table 3. KingAir probes and Ka-band cloud radar.
Name Detecting range (μm) Number of channels Cloud parameters
CDP (cloud particle probe) 2−50 30 Cloud droplets, ice crystals
CIP (cloud imaging probe) 12.5−1562.5 62 Large cloud droplets, snow and ice crystals
PIP (precipitation imaging probe) 50−6250 62 Precipitation particles, sleet, snow and ice crystals
PCASP 0.095−3.1 30 Aerosols
CCN-100 0.25−10.25 20 Cloud condensation nuclei
AIMMS Temperature, pressure, humidity, winds, etc.
KPR (Ka-band cloud radar) −35 to 35 dBZ Cloud, light precipitation
WCM (total water content) 10−4 to 10 g m−3 Clouds and precipitation
Fig. 5. Photos of the Shanxi KingAir aircraft probes and onboard Ka-band cloud radar (PKR).
and surface meteorological variables, were used to collect data related to heavy rainfall processes during the mei-yu period.
These ground-based observations combined with Fengyun and GPM satellite observations can provide the horizontal and ver-
tical distributions of rainfall processes and properties, which are crucial in studying the spatiotemporal evolution of mei-yu
frontal systems from west to east over the middle and lower reaches of the Yangtze River. The microphysical properties of
cloud and precipitation were observed and retrieved from the active and passive ground-based remote sensors and instru-
ments, including different wavelengths of radars, microwave radiometers, and Parsivel and 2DVD disdrometers.
(2) Seven aircraft flights were successfully carried out with a total of 17 hours and the spectra of ice particles, cloud
droplets, and raindrops at different altitudes were obtained. Of the seven flights, two were in moderate rain, two were in
light rain, and three flew through cloudy and clear-sky conditions. As illustrated in Fig. 6 and listed in Table 4, the KA350 air-
craft flew from ~1500 m to 7300 m and collected the spectra of ice particles, cloud droplets, and raindrops in clouds at differ-
ent altitudes. Figure 7 shows an example of Ka-band cloud radar reflectivity onboard the KA350 aircraft and their associ-
ated cloud and rain drop size distributions (DSDs) at different altitudes on 21 June 2020 during IMFRE-II. The vertical distri-
butions of radar reflectivity and DSDs have demonstrated a typical warm rain process in a mei-yu precipitation event.
Cloud droplets normally grow with height through the condensational process in updrafts and become rain-sized drops
through the collision−coalescence and autoconversion processes near the cloud top. These raindrops fall from near theMARCH 2021 CUI ET AL. 355
Fig. 6. A sample of the aircraft flight track on 18 June 2020 over the
Jingzhou surface site.
Table 4. Summary of the aircraft flights during IMPFRE-II.
Measurement Minimum flight Maximum flight Freezing level
Order Date period (LST) altitude (m) altitude (m) altitude (m) Weather
1 18 June 1040−1240 1499 7335 5420 Rainy
2 21 June 1845−1955 3075 7318 5782 Rainy
3 28 June 1510−1705 1463 6326 5668 Rainy
4 1 July 0940−1140 1511 7326 5426 Cloudy
5 2 July 1825−2025 1480 7308 5355 Clear sky
6 4 July 1050−1205 4723 7339 5382 Rainy
7 4 July 1640−1758 1492 7331 5638 Clear sky
Fig. 7. Left-hand column: Ka-band (35.64 GHz) cloud radar reflectivity onboard the KingAir aircraft during four time
periods at different altitudes with a descending mode on 21 June 2020 over the Jingzhou surface site during IMFRE-II.
Right-hand column: The corresponding cloud and rain drop size distributions (DSDs) from the merged product of CDP
(2−50 μm), CIP (25−1550 μm) and PIP (100−6200 μm) during the four times and altitudes.356 FIELD EXPERIMENT FOR MEI-YU FRONTAL SYSTEM VOLUME 38
cloud top where the gravitational force exceeds the buoyancy force and grow further by collecting cloud droplets and small
raindrops through the collision−coalescence process. As raindrops fall, the spectra of the DSD become wider and the accre-
tion process becomes increasingly important, and eventually some of the raindrops become larger raindrops down to the sur-
face. These in-situ measurements, as well as the onboard cloud radar measurements, will provide a “cloud truth” to validate
the ground-based and satellite retrieved cloud and precipitation properties, and quantitatively estimate their retrieval uncertain-
ties. These integrative datasets provide a solid basis for the development of a warm (and/or cold) rain conceptual model in
order to better understand the cloud-to-rain conversion and accretion processes in mei-yu precipitation events.
Acknowledgements. The IMFRE-II field campaign was primarily supported by the National Natural Science Foundation of China
(Grant Nos. 41620104009 and 91637211), the Key Program for International S&T Cooperation Projects of China (Grant No.
2016YFE0109400), and the National Key R&D Program of China (Grant No. 2018YFC1507200).You can also read