Grain sorghum water use with skip-row configuration in the Central Great Plains of the USA
←
→
Page content transcription
If your browser does not render page correctly, please read the page content below
African Journal of Agricultural Research Vol. 6(23), pp. 5328-5338, 19 October 2011
Available online at http://www.academicjournals.org/AJAR
ISSN 1991-637X ©2011 Academic Journals

Full Length Research Paper

Grain sorghum water use with skip-row configuration in
          the Central Great Plains of the USA
Akwasi A. Abunyewa1*, Richard B. Ferguson2, Charles S. Wortmann2, Drew J. Lyon3, Stephen
                       C. Mason2, Suat Irmak4 and Robert N. Klein5
                     1
                       CSIR-Savanna Agricultural Research Institute, P. O. Box TL52, Tamale, Ghana.
                     2
                       Department of Agronomy and Horticulture, University of Nebraska-Lincoln, USA.
                     3
                      Panhandle Research and Extension Center, University of Nebraska-Lincoln, USA.
                  4
                   Department of Biological Systems Engineering, University of Nebraska-Lincoln, USA.
                   5
                    West Central Research and Extension Center, University of Nebraska-Lincoln, USA.
                                                       Accepted 22 July, 2011

    Grain sorghum (Sorghum bicolor (L.) Moench) is commonly produced under conditions where soil
    water deficits frequently occur. Research was conducted at ten (10) site-years from 2005 to 2007 across
    Nebraska where annual mean precipitation ranges from 350 to 900 mm year-1 to determine the effect of
    row configuration and plant population on soil water distribution, water extraction patterns, crop water
    use, and water use efficiency (WUE). Three row configurations including all rows planted (s0), alternate
    rows planted (s1), and two rows planted alternated and two rows skipped (s2) were evaluated in a
    complete factorial with two populations. Soil water content was measured to 1200 mm depth biweekly
    with a neutron moisture meter. Total growing-season precipitation varied from 239 to 452 mm. Stored
    soil water at physiological maturity with the skip-row configurations were 10 to 35 mm greater than s0
    across site-years. Water use efficiency was higher with skip-row configurations at site-years with mean
    growing-season precipitation < 2 mm day-1, and lower at site-years with mean growing-season daily
    precipitation > 2.5 mm. Skip-row planting conserves water for the reproductive stages and enhances
    WUE and yield when water deficits are relatively severe.

    Key words: Crop water use, soil water distribution, sorghum, skip-row, water use efficiency.

INTRODUCTION

In semiarid regions, plant-available water is often the             Schlegel, 2006). Water supply at reproductive growth
most limiting factor for crop growth and yield potential in         stages of grain sorghum has more impact on total grain
dry land agriculture. Grain sorghum is known for its                yield than at the vegetative or ripening stages (Ockerby
drought tolerance and is well adapted to semiarid dry               et al., 2001; Maman et al., 2003). Water stress during
land conditions (Jones and Johnson, 1983; Shackel and               boot and flower stages can reduce grain yield by 85%
Hall, 1984; Pennisi, 2009). Unger and Baumhardt (1999)              (Craufurd et al., 1993). Sorghum is planted in the
reported that grain sorghum yield increased by 139% in              semiarid central Great Plains in mid-to-late spring when
the southern Great Plains between 1939 and 1997 and                 soil water is usually adequate for good emergence and
attributed 93% of this increase primarily to increased soil         vegetative growth. Sorghum has the capacity to till, but
water content at planting. Water deficit during the early           the number and grain yield of tillers depends on several
reproductive and grain filling stages of growth; however, it        factors including hybrid, row spacing, row configuration,
is a common cause of low grain yield and inefficient water          plant population, and water availability (Berenguer and
use in the Great Plains (Nielsen et al., 2005; Stone and            Faci, 2001; Lafarge et al., 2002; Conley et al., 2005;
                                                                    Maman et al., 2003; Bandaru et al., 2006). As a result,
                                                                    the WUE varies in response to these factors.
                                                                      In this study, we defined the WUE as the ratio of grain
*Corresponding author. E-mail: akwasi_abunyewa@yahoo.com.           yield to water consumed instead of the definition by
Tel: +233-245-930040.                                               Sinclair et al. (1984) that relates the total biomass to
Abunyewa et al. 5329
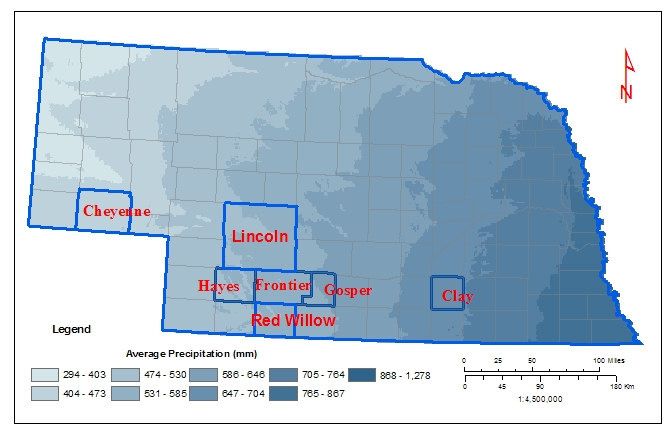
Figure 1. Map of Nebraska, USA showing Counties where the study was carried out.
water consumed. In this respect, WUE can be low when row spacing with high seeding rates and planting in
water is used for growth of tillers that do not produce clumps with three to six plants per hill reduced tiller
grain. Due to the limited and erratic nature of growing- formation, dry matter yield, and early water use with the
season precipitation on the Great Plains, several benefit of saving soil water in the skipped area for use by
cropping systems have been developed to improve WUE. plants during flowering and grain fill stages (Thomas et
Nielsen et al. (2005) reviewed several dry land cropping al., 1980; Bandaru et al., 2006).
systems including no tillage, reduced tillage, conventional Grain sorghum production strategies that can improve
tillage, furrow diking (basin tillage), reduced fallow period, plant-available water at reproductive growth stages may
cropping sequence, cropping intensity, crop varieties, improve the ratio of grain yield to crop water use (WUE).
residue management practices, and continuous cropping Routley et al. (2003) has shown that sorghum roots grow
systems with respect to WUE in the Great Plains. They in all directions at rates of 15 to 40 mm day-1, depending
concluded that continuous cropping under dry land on the growth stage. If the mean rate of root growth is 25
conditions in the semiarid Great Plains was risky due to mm day-1, this would imply that narrow-spaced sorghum
limited and erratic precipitation and high potential will reach and exhaust all the available water early in the
evapotranspiration. growing period if there was no replenishment by rainfall.
A review of several studies conducted in the Great Conceivably, under low rainfall wider-spaced sorghum
Plains by Sojka et al. (1988) showed a contrasting effect would use water stored in the inter-row soil regions to
of row spacing on water use efficiency of sorghum. Skip- meet its needs during the reproductive stage and hence
row planting has been shown to conserve soil water for sustain high yields under dry conditions. The objectives
later use by the crop to improve water use and grain yield of this study were to evaluate the effects of row
(McLean et al., 2003; Routley et al., 2003). In central configuration and plant population on soil water
Queensland, Australia, Collins et al. (2006) reported that availability, distribution and extraction patterns, crop
skip-row planting had equal or higher grain yield than water use, and water use efficiency of grain sorghum in
conventional planting where mean yield potential of grain the central Great Plains.
-1
sorghum was less than 3 mg ha . Planting in 1.5- and 2-
m wide rows prevented total crop failure and out-
performed conventional planting with 1-m row spacing in MATERIALS AND METHODS
dry years (Routley et al., 2003; Whish et al., 2005).
Site characteristics
Bandaru et al. (2006) reported that planting grain
sorghum in clumps in water stressed environments Field studies were conducted at 10 site-years across Nebraska
increased grain yield in the southern Great Plains. Wide (Figure 1) from 2005 through 2007. All fields were non-irrigated,5330 Afr. J. Agric. Res.
Table 1. Soil series and taxonomic classes information for experimental sites in Nebraska, USA.
Site, soil and agronomic data Clay Gosper Frontier Hayes Red willow Lincoln Cheyenne
40o34’ N; 98o08 40o28’ N; 99o53 40o40’ N; 100o29 40o30’ N; 101o01W; 40o23’ N 100o58’ 41o05’ N; 100o75’ 41o12’ N; 103o01’
Location and elevation
W; 543.3 m W; 732 m W; 829 m 922.0 m W; 792 m W; 922 m W; 1317 m
Holdrege & Keith Holdrege silt
Soil series Crete silt loam Holdrege silt loam Hall silt loam Kuma silt loam Duroc loam
silt loam loam
Fine-silty, mixed, Fine-silty, mixed, Fine-silty, mixed,
Fine, smectitic, Fine-silty, mixed, Fine-silty, mixed, Fine-silty, mixed,
superactive, superactive, mesic superactive,
Taxonomic class mesic Pachic superactive, mesic superactive, mesic superactive, mesic
mesic Pachic Typic/Aridic mesic Typic
Arguistolls Typic Argiustolls Pachic Arguistolls Pachic Haplustolls
Arguistolls Argiustolls Argiustolls
Table 2. Agronomic information for experimental sites in Nebraska, USA.
Site, soil and
Clay Gosper Frontier Hayes Red willow Lincoln Cheyenne
agronomic data
o o o o o o o o o o o
41 12’ N; 103o01’
o
Location and 40 34’ N; 98 08 W; 40 28’ N; 99 53 40 40’ N; 100 29 40 30’ N; 40 23’ N 100 58’ 41 05’ N; 100 75’
o
elevation 543.3 m W; 732 m W; 829 m 101 01W; 922.0 m W; 792 m W; 922 m W; 1317 m
Previous crop Corn Corn Corn Corn Corn Corn Wheat
No. of trials 3 1 1 1 1 1 2
Plant population 75,000; 150,000 50,000; 100,000 50,000; 100,000 50,000; 100,000 50,000; 100,000 50,000; 100,000 50,000; 100,000
24 May, 2005; 7 June, 1 June 1, 2007 1 June, 2006; 5
Plant date 16 May, 2006; 23 May, 2006; 24 May, 2006; 24 May, 2007;
2006; 6 June, 2007; June, 2007;
14 Oct., 2005; 25 Oct., 2 Oct., 2007; 17 Oct., 2006;
Harvest date 31 Oct., 2006; 31 Oct., 2006; 1 Nov., 2006; 2 Oct., 2007;
2006; 10 Oct., 2007; 3 Oct., 2007;
no-till with corn (Zea mays L.) residue from the previous using a 76-cm row spacing, and two skip-row configure- 28 was planted at the remaining site-years. At Clay
season at all sites except Cheyenne County where the tions: alternate rows planted, or single skip configuration County, plants were thinned 21 days after emergence to
crop residue was wheat (Triticum aestivum L. emend. (s1), and two rows planted alternated with two skipped obtain 7.5 and 15.0 plants m-2 (75,000 and 150,000 plants
Thell). Soil type varied with site (Table 1). Three planting rows, or double skip configuration (s2). Plot size was 54.7 ha-1, respectively).
configurations and two plant populations were evaluated in m2. Medium (relative maturity of 110 days) maturing grain At the remaining sites plant population was thinned 21
a complete factorial treatment arrangement in a sorghum cv. Dekalb 42-20 (Monsanto, St. Louis, MO, USA) days after emergence to 5.0 and 10.0 plants m-2 (50,000
randomized complete block experimental design with four was planted at the Clay County site, a relatively high and 100,000 plants ha-1, respectively) (Table 2). Plant
replications at all site-years. The row configurations rainfall site with annual mean precipitation of 734 mm, and population remained constant across all row configu-
included all rows planted, or conventional planting (s0) early (relative maturity of 105 days) maturing Dekalb 29- rations, resulting in a higher within-row plant density inAbunyewa et al. 5331
skip-row treatments. Fertilizer application was based on the regression curves.
University of Nebraska-Lincoln recommendation for the crop and
soil nutrient content before planting at each site (Ferguson, 2000).
Gosper, Frontier, Hayes and Red Willow County sites were on
RESULTS AND DISCUSSION
cooperating producer’s fields while Clay, Lincoln and Cheyenne
County sites were located on research stations. Pre-emergence
herbicides were soil-applied to control weeds. Plots were machine- Growing-season precipitation and reference (Alfalfa)
harvested and grain yield determined from 18.2 m2 in the center of evapotranspiration
each plot. Yields were standardized at 135 g kg-1 water content.
In 2005, the lowest growing-season precipitation period
Soil water content
at the Clay County site occurred between 20 and 60 days
after planting (DAP). Weekly precipitation accounted for
To monitor the use of soil water of each row configuration during less than 19% of the weekly reference evapotranspiration
the growing season, neutron probe access tubes were installed at a (ETR.). Total growing-season precipitation in 2006 and
single point in the center of the skipped area of s1 and s2 2007 was 87 and 100%, respectively, of the 50-year
configurations (76 and 114 cm from row, respectively) and midway average precipitation (Figure 2). The total growing-
between two rows of the s0 configuration (38 cm from row).
season precipitation in 2006 was 308, 346, 376, and 244
Volumetric soil water content was measured beginning form three
weeks after planting at two to three week intervals until mm at the Frontier, Hayes, Gosper and Cheyenne
physiological maturity using a neutron probe (Troxler 4301, Troxler County sites, respectively, representing 86, 100, 100, and
Electronic Labs, Research Triangle Park, NC, USA) at depths of 82% of the 50-year average growing-season precipitation
300, 600, 900 and 1200 mm. Detailed description of neutron probe (Figure 2). Most of the 2006 growing-season precipitation
calibration and soil water content measurement are presented in at Gosper County occurred later than 70 DAP.
Abunyewa et al. (2010). Permanent wilting point and field capacity
values at various study sites and depths were estimated using the
Precipitation rarely met weekly ETR (Figure 2). Water
Saxton Equation solution for soil water characteristics (Saxton et stress during critical growth stages in the Great Plains is
al., 1986). the primary yield limiting factor (Maman et al., 2003;
For calculation of crop water use, total growing season water was Nielsen et al., 2005). Reduced growing-season precipi-
estimated by adding total growing season precipitation (June to tation, low plant-available stored soil water, and extremes
September) to the initial total profile water. Growing-season of temperature during reproductive growth stages can
precipitation, long-term (50-year) average growing-season
precipitation, and reference (alfalfa) evapotranspiration (ETR) data
reduce pollination, increase flower abortion, and reduce
were also collected from nearby automated weather data network kernel weight and grain yield (Berenguer and Faci, 2001).
sites (www.hprcc.unl.edu/services/). Automated weather data Using weather and grain yield data from 1992 to 2005,
network sites were located 0.05 to 0.2 km from the study site at the Staggenborg et al. (2008) reported a positive correlation
Clay, Lincoln and Cheyenne County sites, and 0.1 to 2 km from the between sorghum grain yield and growing-season
study for the remaining sites.
precipitation in the central Great Plains.
Crop water use and water use efficiency
Soil water distribution and extraction pattern
Crop water use (CWU) was estimated following Routley et al.
(2003) and Maman et al. (2003): Since SWC was measured at a single point midway
between rows of s0 and in the center of inter-row area,
CWU = Wi – Wf + P – R – D (1) this may only partially represent total profile soil water of
each row configuration. With the assumption that soil
where Wi and Wf are the initial and final soil water storage (mm), P
is the growing season precipitation (mm), R is runoff (mm) and D is water below and near rows will be similarly extracted for
deep percolation (mm). all planting configurations, availability of the more distant
With several site-years, there was no significant treatment effect soil water in the skipped area may reduce risk of crop
on SWC measured at 1200 mm depth, and individual values of failure and improve overall WUE. Across all site-years,
rainfall events were generally low, hence deep percolation and row configuration effects on total SWC were marginal
runoff components were considered negligible in CWU calculations.
Water use efficiency at physiological maturity was calculated as:
(except Frontier County site) at 42 DAP (Figure 3) due to
a short dry spell experienced during the early stages of
WUE = grain yield / CWU at physiological maturity. the growing season. Row configuration effects were
greater at 75 DAP, when SWC with skip-row was higher
than with s0 at all sites except Gosper and Hayes County
Data analysis (Figure 3). In 2007, differences in profile total SWC
between skip-row and s0 planting were observed only at
All data were analyzed using the MIXED procedure of SAS (SAS
the Clay County site at 75 DAP and the Cheyenne
Institute, 2007). Fisher’s protected LSD test was used to separate
treatment means at P < 0.05. Regression analysis was conducted County site at 120 DAP (Figure 4). The Cheyenne
using SigmaPlot v.10 (Systat Software, Inc 2006) to determine the County site in 2007 had lower growing-season
relationship between grain yield and crop water use across site- precipitation compared to 2006 but more pre-season
year. The t-test was used to test for the equality of slope of precipitation and higher profile total SWC throughout the5332 Afr. J. Agric. Res.
100 100
Clay Co. 2005 Clay Co. 2006 PPT (mm)
80 80
ETR (mm)
60 60
40 40
20 20
0 0
0 20 40 60 80 100 120 140 20 40 60 80 100 120 140
100 100
Hayes Co. 2006 Frontier Co. 2006
80 80
60
60
40
40
20
20
0
0 20 40 60 80 100 120 140
0 20 40 60 80 100 120 140
100 100
80 Gosper Co. 2006 80 Cheyenne Co. 2006
60 60
Precipitation and evapotranspiration (mm)
40 40
20 20
0 0
0 20 40 60 80 100 120 140 20 40 60 80 100 120 140
100 100
Clay Co. 2007 80 Red Willow Co. 2007
80
60 60
40 40
20
20
0
0
0 20 40 60 80 100 120 140
20 40 60 80 100 120 140
100 100
Lincoln Co. 2007 Cheyenne Co. 2007
80 80
60 60
40 40
20 20
0 0
0 20 40 60 80 100 120 140 0 20 40 60 80 100 120 140
Days after planting Days after planting
Figure 2. Growing-season precipitation (bar) and reference (Alfalfa) evapotranspiration (ETR, line) at different
sites from 2005 to 2007 in Nebraska. No ETR values were recorded for Hayes and Gosper County sites by the
Nebraska Automatic Weather Data Network.
2007 growing season. precipitation and/or dry spells, soil water was extracted
Generally, sites with well distributed growing season from deeper depth across the profile. Since grain
precipitation, soil water extraction was mainly limited to sorghum has the capacity to till, lower plant populations
the top soil. While sites with less growing season were compensated for by having similar number ofAbunyewa et al. 5333
Figure 3. Water content of the soil profile with three row configurations for six site-years in Nebraska in 2005
and 2006 at 42, 75 and 120 days after planting (DAP). s0 = conventional planting with all rows planted, s1 =
alternate rows planted, s2 = two rows planted alternated with two rows skipped. FC = field capacity, PWP =
permanent wilting point. X-bars = LSD0.05. If X-bars are not present, there are no significant differences among
treatments.
panicles m-2 compared with the high population, concern in skip-row planting but residue cover in the
subjecting both populations to similar soil water demand inter-row area and no-tillage minimizes evaporative loss
(Larson and Vanderlip, 1994; Conley et al., 2005; of stored soil water for the benefit of crop use (Routley et
Bandaru et al., 2006). Evaporation can be a major al., 2006).5334 Afr. J. Agric. Res.
Figure 4. Soil water content in the soil profile under three row configurations at 40, 75 and 120 days after planting
(DAP) at four site-years in Nebraska in 2007. s0 = conventional planting with all rows planted, s1 = alternate rows
planted, s2 = two rows planted alternated with two rows skipped. FC = field capacity, PWP = permanent wilting
point. X-bars = LSD0.05. If X-bars are not present, there are no significant differences among treatments.
Grain yield yield are summarized here. Grain yield was greater with
s0 at the Clay County site in all three years compared
Grain yield results are reported in detail by Abunyewa et with skip-row planting (Figure 5). This agrees with other
al. (2010) and the effects of row configuration on grain findings that yield potential can be reduced in highAbunyewa et al. 5335
14
2005 and 2006
12
LSD = 1.13
10
8
6
4
2
Grain yield (Mg ha-1)
0
Clay05 Clay06 Gosper Frontier Hayes Cheyenne
14
2007
12
LSD = 1.13 s0
s1
10 s2
8
6
4
2
0
Clay Red Willow Lincoln Cheyenne
Counties
Figure 5. Effects of row configuration on grain sorghum yield from 2005 to 2007 in Nebraska. s0 =
conventional planting with all rows planted, s1 = alternate rows planted, s2 = two rows planted
alternated with two rows skipped. Y-bars = LSD0.05 appropriate for the site.
yielding environments when using wider rows due to the At the Gosper, Lincoln and Red Willow County sites,
inability of the plants to efficiently utilize available re- considered moderate rainfall locations, grain yield with
sources (Holland and McNamara, 1982). With adequate skip-row planting was equal to s0 (Figure 5). Water
SWC due to higher growing-season rainfall at Clay availability at critical growth stages is often more
County in all three years and at all sites in 2007, uniform important than total precipitation (Lafarge et al., 2002)
stands and narrow spacing produced greater grain yield and water deficits at flowering and grain fill stages can
compared with skip-row configuration. severely reduce grain sorghum yield (Maman et al., 2003,5336 Afr. J. Agric. Res.
500 500
A 2005 and 2006 B 2007
450 lsd = 14.13
450
lsd = 14.13
s0
400 s1 400
s2
350 350
Crop water use (mm)
300 300
250 250
200 200
150 150
100 100
50 50
0 0
Clay05 Clay06 Hayes06 Cheyenne06
Gosper06 Frontier06 Hayes06Cheyenne06 Clay07 RedWillow07 Lincoln07 Cheyenne07
33 33
C 2005 and 2006 D 2007
30 30 lsd = 2.17
Water Use Efficiency (kg ha mm )
-1
27 27
lsd = 2.17
24 24
-1
21 21
18 18
15 15
12 12
9 9
6 6
3 3
0 0
Clay05 Clay06 Hayes06 Cheyenne06
Gosper06 Frontier06 Hayes06Cheyenne06 Clay07 RedWillow07 Lincoln07 Cheyenne07
County County
Figure 6. Effect of three row configurations on crop water use (A and B) and water use efficiency (C and D)
of grain sorghum at physiological maturity across Nebraska. s0 = conventional planting with all rows
planted, s1 = alternate rows planted, s2 = two rows planted alternated with two rows skipped. Y-bars =
LSD0.05 within site-year.
2004). With high growing-season precipitation in 2007, McNamara, 1982; Routley et al., 2003; Collins et al.,
grain yield with s0 was generally higher than with s2 at all 2006).
sites. At the Hayes and Frontier County sites in 2006,
skip-row configurations produced 5 to 123% (0.3 to 1.4
mg ha-1) higher grain yield than s0, with a trend for higher Crop water use and water use efficiency at
grain yield with skip row configuration at Cheyenne physiological maturity
County in 2006 (Figure 5). These results confirm findings
of other studies that showed the grain yield advantage of Crop water use ranged from a site mean of 242 mm at
skip-row planting of grain sorghum over conventional the Cheyenne County site in 2007 to 458 mm at the Red
planting, under water deficit conditions (Holland and Willow County site in 2007 (Figure 6). At anthesis, CWUAbunyewa et al. 5337
40
s0
35 Ys0 = 0.09*cwu - 8.67, R2 = 0.93 s0
s1
Total dry matter yield (Mg ha-1)
s1
30 s2
s2
2
Ys1 = 0.07*cwu - 5.9, R = 0.84
25
20
15
2
Ys2 = 0.06*cwu - 3.13, R = 0.66
10
5
200 250 300 350 400 450 500
Crop Water Use, CWU (mm)
Figure 7. Relationship between crop water use (CWU) and total crop yield at physiological maturity with three row
configurations across 10 site-years in Nebraska from 2005 to 2007. s0 = conventional planting with all rows planted,
s1 = alternate rows planted, s2 = two rows planted alternated with two rows skipped.
was higher with s0 than with skip-row planting for all site- WUE was higher with s0 in all years compared with skip-
years. However, as the season and water depletion row planting. Water use efficiency was similar for s1
progressed, CWU with skip-row planting increased with compared with s2 for all site-years except Cheyenne
use of the plant-available water in the inter-row area and County in 2006 and Clay County in 2007. Improvement in
was not different from s0 planting at physiological WUE in water deficit environments with skip-row
maturity except at the Frontier and Hayes County sites configuration can be attributed to the increased
(Figure 6). The difference in CWU at physiological availability of soil water in the inter-row area at
maturity was s0 > s1 > s2 at Frontier County and s1 > s0 reproductive stages, which was subsequently utilized to
= s2 at the Hayes County site. Maximum grain yield did increase grain yield.
not correspond with maximum CWU across site-years as The linear relationship between CWU and total dry
CWU was dependent on rainfall events and other matter yield (stover plus grain) at harvest was steeper
weather factors of the site. Routley et al. (2003) observed with s0 compared with skip-row planting (Figure 7). At
higher CWU of grain sorghum with s0, compared with lower CWU, differences in total dry yield with s0
skip-row planting at anthesis, but there were no compared with skip-row planting were not apparent, but
differences in CWU between s0, s1 and s2 at maturity. as CWU increased, the rate of dry matter yield increased
Row configuration x plant population interactions did significantly with s0 planting. At site with higher CWU,
not significantly influence WUE at any of the 10 site- wider spacing skip-row configuration is likely to under-
years. Water use efficiency with s0 across site-years utilize solar radiation and soil nutrients compared with s0.
ranged from 3.6 at the Hayes County site to 27.9 kg ha-1 The weak linear relationship for s2 suggests that plant-
mm-1 at the Clay County site in 2005 (Figure 6). With available water was not limited to crop growth at site-
skip-row configurations, WUE ranged from 6.4 at Hayes years with greater precipitation. Using data of research
-1 -1
to 20.7 kg ha mm at Cheyenne County with s1 in 2007, conducted in the central Great Plains from 1973 to 2004,
-1 -1
and from 7.0 at Gosper to 20.9 kg ha mm at Clay Stone and Schlegel (2006) observed a linear association
County with s2 in 2005. Water use efficiency was highest between sorghum grain yield and soil water supply (soil
with the s1 and s2 compared with the s0 configuration at water at emergence plus growing-season precipitation).
site-years with mean growing-season precipitation < 2 Thus, skip-row configurations can be expected to result in
mm day-1 (low rainfall site-years) and lower at site-years lower yields than conventional planting if the growing
where the mean growing-season precipitation was > 2.5 season CWU is more than 300 mm. However, distribution
-1
mm day (high rainfall site-years). At the Clay County site, of in-season precipitation, vapor pressure deficit, solar5338 Afr. J. Agric. Res.
radiation, and wind speed will have significant influences Jones OR, Johnson WC (1983). Cropping practices: Southern Great
Plains. In HE, Willis WO (eds.) Dryland agriculture. Dregne, pp. 365-
on total yield (Maman et al., 2003; Olufayo et al., 1996).
385. Agron. Monograph 23. ASA, CSSA, and SSSA, Madison, WI.\
Lafarge TA, Broad IJ, Hammer GL (2002). Tillering in sorghum over a
wide range of population densities: Identification of a common
Conclusions hierarchy for the emergence, leaf area development and fertility. Ann.
Bot., 90: 87-98.
Larson EJ, Vanderlip RL (1994). Grain sorghum yield response to non
The initial SWC and the amount and distribution of uniform stand reductions. Agron. J., 86: 475-477.
growing-season precipitation affected CWU and WUE of Maman N, Lyon DJ, Mason SC, Galusha TD, Higgins R (2003). Pearl
grain sorghum across site-years. There was less CWU millet and grain sorghum yield response to water supply in Nebraska.
Agron. J., 95: 1618-1624.
with skip-row compared to s0 planting during vegetative
Maman N, Mason SC, Lyon DJ Dhungana P (2004). Yield components
stages with more water availability for reproductive of pearl millet and grain sorghum across environments in the central
growth with skip-row treatment. This saved water was Great Plains. Crop Sci., 44: 2138-2145.
efficiently converted to grain yield only where soil water McLean G, Whish J, Routley RA, Broad I, Hammer G (2003). The effect
of row configuration on yield reliability in grain sorghum: II. Yield,
deficits were severe. At moderate soil water deficit, grain
water use efficiency and soil water extraction. Proc. of 11th Aust.
yield and WUE with skip-row and s0 configurations were Agron. Conf. Geelong, Victoria. 2–6 Feb. 2003. Available at
similar. Skip-row planting of sorghum grain is www.regional.org.au/au/ asa/2003/c/9/routley.htm. Date accessed 25
recommended where severe growing season soil water November 2006. Australian Society of Agronomy. Gosford, Australia.
deficits are likely to occur, as in western Nebraska. Nielsen DC, Unger PW, Miller PR (2005). Efficient water use in dryland
cropping systems in the Great Plains. Agron. J. 97:364-372.
Ockerby SE, Midmore DJ, Yule DF (2001). Leaf modification delays
panicle initiation and anthesis in grain sorghum. Aust. J. Agric. Res.,
ACKNOWLEDGEMENTS 52: 127-135.
Olufayo A, Baldy C, Ruelle P (1996). Sorghum yield, water use and
canopy temperatures under different levels of irrigation. Agric. Water
We acknowledge the technical assistance provided by Manage., 30: 77-90.
Mark Strnad, Glen Slater, James Peterson, and Robert Pennisi E (2009). How sorghum withstands heat and drought. Science,
Higgins in this research. This study was conducted with 323: 573.
partial financial support from the U.S. Agency for Routley R, Lynch B, Conway M (2006). The effect of sorghum row
spacing on fallow cover distribution and soil water accumulation.
International Development to the International Sorghum Proc. 13th Agron. Conf. 2006. 10-14 September 2006, Perth,
and Millet Collaborative Research Support Program Western Australia. Available online at:
under the terms of Grant No. LAG-G-00-96-900009-00 www.regional.org.au/au/asa/2006/ Date accessed Oct. 20, 2008.
and a partial financial support from Scholarship Routley R, Broad I, McLean G, Whish J, Hammer G (2003). The effect
of row configuration on yield reliability in grain sorghum: 1. Yield,
Secretariat, Government of the Republic of Ghana. water use efficiency and soil water extraction. Proc. 11th Aust. Agron.
Conf. Geelong, Victoria. 2–6 Feb. 2003. Available at
www.regional.org.au/au/ asa/2003/c/9/routley.htm Date accessed 25
REFERENCES Nov. 2006. Australia Society of Agronomy. Gosford, Australia.
SAS Institute (2007). SAS 9.1. Software for Windows 2007. SAS
Abunyewa AA, Ferguson RB, Wortmann CS, Lyon DJ, Mason SC, Klein Institute, Cary, NC.
RN (2010). Skip-row and plant population effects on sorghum grain Saxton KE, Rawls WJ, Romberger JS, Papendick RI (1986). Estimating
yield. Agron. J., 102: 296-302. generalized soil-water characteristics from texture. Soil Sci. Soc. Am.
Bandaru V, Stewart BA, Baumhardt RL, Ambati S, Robinson CA, J., 50: 1031-1036
Schlegel A (2006). Growing dryland grain sorghum in clumps to Shackel KA, Hall AE (1984). Effect of intercropping on the water
reduce vegetative growth and increase yield. Agron. J., 98: 1109- relations of sorghum and cowpea. Field Crops Res., 8: 381-387.
1120. Sinclair TR, Tanner CB, Bennet JM (1984). Water use efficiency in crop
Berenguer MJ, Faci JM (2001). Sorghum (Sorghum bicolor L. Moench) production. Biol. Sci., 34: 36-40.
yield compensation processes under different plant densities and Sojka RE, Karlen DL, Sadler EJ (1988). Planting geometries and the
variable water supply. Eur. J. Agron., 15: 43-55. efficient use of water and nutrients. In Hargrove WL (ed.) Cropping
Collins R, Buck S, Reid D, Spackman G (2006). Manipulating row Strategies for Efficient Use of Water and Nitrogen. ASA Special
spacing to improve yield reliability of grain sorghum in central Publication, Madison, WI, 51: 43-68.
th
Queensland. Proceedings of 13 Australian Agronomy Conference. Staggenborg SA, Dhuyvetter KC, Gordon WB (2008). Grain sorghum
Aust. Soc. Agron. September 10 –14, 2006. Perth, Western Australia. and corn comparison: Yield, economic, and environmental
Conley SP, Stevens WG, Dunn DD (2005). Grain sorghum response to responses. Agron. J., 100: 1600-1604.
row spacing, plant density, and planter skips. Plant Management Stone LR, Schlegel AJ (2006). Yield-water supply relationships of grain
Network. July 2005. 8 pp. Available at sorghum and winter wheat. Agron. J., 98: 1359-1366.
http://www.plantmanagementnetwork.org/update/archive/01-06.htm Systat Software (2006). SigmaPlot 10.0. Software for Windows 2006.
(verified 18 Oct., 2006). Systat Software, Inc. San Jose, CA.
Craufurd PQ, Flower DJ, Peacock JM (1993). The effect of heat and Thomas GA, French AV, Ladewig JH, Lather CJ (1980). Row spacing
drought stress on sorghum (Sorghum bicolor).1. Panicle development and population density effects on yield of grain sorghum in Central
and leaf appearance. Exp. Agric., 29: 61-76. Queensland. Queensland J. Agric. Anl. Sci., 37: 66-67.
Ferguson RB (2000). Grain and silage sorghum, pp. 97-103. In Unger PW, Baumhardt RL (1999). Factors related to dryland sorghum
Ferguson RB (ed.) Nutrient management For agronomic crops in yield increases: 1939 through 1997. Agron. J., 91: 870-875.
Nebraska. Cooperative Extension EC 01–155-S. Univ. of Nebraska, Whish J, Butler GG, Castor M, Cawthray S, Broad I, Carberry P,
Lincoln, p. 156 Hammer G, McLean G, Routley R, Yeates S (2005). Modeling the
Holland JF, McNamara DW (1982). Weed control and row spacing in effect of row configuration on sorghum and yield reliability in north-
dryland sorghum in northern New South Wales. Aust. J. Expt. Agric. eastern Australia. Aust. J. Agric. Res., 56: 11-23.
Anl. Husb., 22: 310-316.You can also read