Soil organic matter stoichiometry as indicator for peatland degradation - Agroscope
←
→
Page content transcription
If your browser does not render page correctly, please read the page content below
www.nature.com/scientificreports

            OPEN           Soil organic matter stoichiometry
                           as indicator for peatland
                           degradation
                                             ✉
                           Jens Leifeld       , Kristy Klein & Chloé Wüst-Galley
                           Peatlands accumulate organic matter (OM) under anaerobic conditions. After drainage for forestry or
                           agriculture, microbial respiration and peat oxidation induce OM losses and change the stoichiometry
                           of the remaining organic material. Here, we (i) evaluate whether land use (cropland CL, grassland GL,
                           forest FL, natural peatland NL) is associated with different peat stoichiometry, (ii) study how peat
                           stoichiometry changes with OM content and (iii) infer the fate of nitrogen upon soil degradation.
                           Organic C and soil N were measured for 1310 samples from 48 sites in Switzerland, and H and O for
                           1165. The soil OM content and C/N ratio were most sensitive to land use and are hence best suited
                           as indicators for peatland degradation. OM contents (CL < GL
www.nature.com/scientificreports/ www.nature.com/scientificreports
Measurements of organically bound H and O in peat reveal a wide range of molar H/C and O/C ratios of
1.1–1.5 and 0.4–0.9, respectively15,18. During peat formation, H and O decrease relative to C, owing to the release
of inorganic compounds with high O/C and H/C ratio, namely CO2 and CH4. Likewise, polysaccharides such as
cellulose, which is relatively rich in O and C [(C6H10O5)n], degrade faster whereas aliphatic and aromatic com-
pounds with lower O/C and H/C, either originating from the primary input material or newly formed during
microbial transformation, accumulate19,20. These processes determine the resulting stoichiometry and oxidation
state of SOC, which might be representative of the degree of peat decomposition21. In turn, peat composition may
change again upon aerobic decomposition after drainage, but a systematic investigation of drainage and land use
effects on stoichiometry is still outstanding.
Many organic soils in the temperate zone, particularly in Europe, have been subject to intensive drainage and
land use change22, and it is known that this has caused soil subsidence and GHG emissions23,24. However, the land
use impact on peat composition is less well known. Here, we study peat samples from managed and natural sites
(Table 1), all from the cool temperate moist zone of Switzerland to infer, (i) whether land use influences the OM
content and stoichiometry of peat, (ii) whether peat is composed differently in high and low OM content peats,
and (iii) the possible fate of N upon peat degradation. The situation in Switzerland25 is similar to that of some
other European countries in that many organic soils are already lost, and the remaining peatlands are mostly
drained and managed26. Finally, a comparison to published C and N data from the Northern Hemisphere peat-
lands places the degree of peat degradation in a wider context.
Results
All measured chemical indicators are related significantly to land use (Tables 2 and 3). Contents of OM and SOC
differed significantly between each land use type in the order CL < GL < FL < NL, both for the whole soil profile
as well as the top- and subsoil samples individually. OM and SOC contents were higher in subsoils and, for whole
profiles, above the average of all samples under FL and NL and below average for CL and GL. Peat C/N ratios also
differed significantly between land use and increased together with OM contents. As for OM and SOC, values
were above average for FL and NL. Nitrogen contents, for comparison, varied less and were slightly but signif-
icantly higher for peat only under GL. We also analysed six adjacent sites with different land use (Table 1, sites
Cressier, Gals, Mühleturnen, Sömmerigchopf, Staatswald, Vorderwengi). The direct comparison of paired sites
reveals that topsoil SOC contents were, on average, 0.1, 2.6, and 0.5% higher for GL vs. CL, FL vs. GL, and FL vs.
CL. Soil C/N ratios were higher by 1.2, 2.9, and 8,7 units for the same pairs.
Ratios of H/C were the highest under CL and GL, whereas O/C ratios were the highest under GL only. In all
four land use situations, H/C and O/C were higher in top- than in subsoils. Oxidation states of OM also differed
between land use types, but in contrast to the parameters above, intensive land use (CL and GL) did not lead to
consistently different C oxidation state (Cox) values (Table 2). Across all sites, Cox was higher in topsoil than in
subsoil.
Molar ratios were inversely and significantly related to SOC content. The strengths of the relationships
increased in the order O/C < H/C < N/C (Fig. 1). Additionally, there were interactions between OM content and
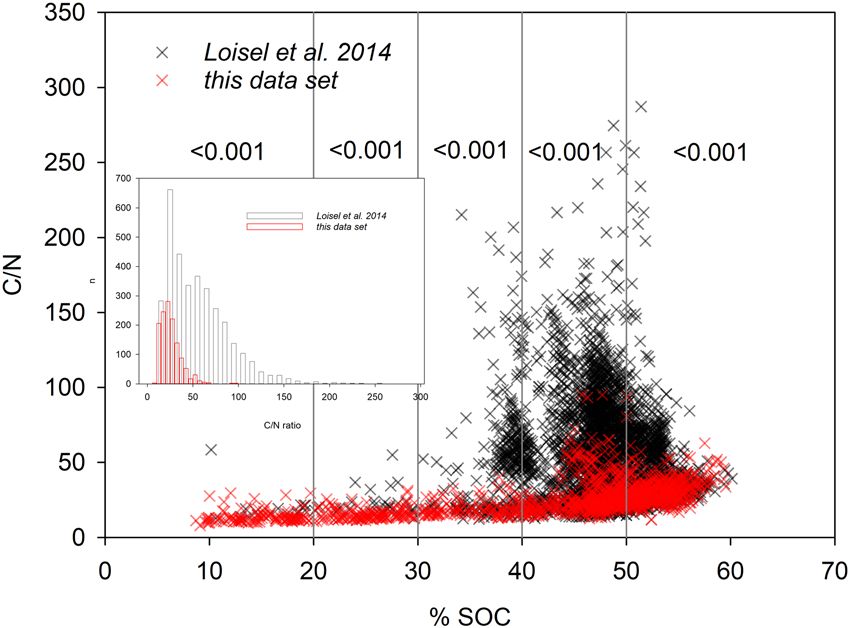
OM stoichiometry (Fig. 2). Linear regression of data in Fig. 2 indicates that, for a one percent reduction in OM
content, the relative (molar) contributions of N and H to OM increase by 1.28 and 0.18%, respectively; whereas
the relative contributions of C and O decrease by 0.22 and 0.07%, respectively. All regression coefficients as related
to Figs. 1 and 2 can be found in Supplementary Table S1.
To evaluate whether changes in soil C/N ratio with OM content differed between unfertilized (i.e., forest and
natural sites) and fertilized (i.e., croplands and grasslands) sites, we fitted exponential functions through the
corresponding subsets (please note that in Fig. 2, running averages are shown as a guide for the eye, not the curve
fits). Results indicate (see Supplementary Table S2), that for both land use pairs, C/N ratios significantly drop with
declining OM content. Further, the parameter estimates indicate that changes in C/N occur at a higher rate in
forests and natural lands than in agricultural land above c. 75% OM, but at a similar rate 95% OM contents are representative of an undisturbed situation. Relative
to this sample set (>95% OM, n = 325, of which 225 = FL, 57 = NL, 43 = GL, 0 = CL), the other peat samples
contained on average 5.0 ± 0.5 (NL), 11.3 ± 1.3 (FL), 34.8 ± 1.4 (GL) and 40.0 ± 1.9 (CL) % less OM. Lower OM
contents in more intensively managed and more deeply drained soils (CL and GL in our case), are in line with
the order of CO2 flux measurements over drained peatlands under different land use17. The reported differences
in OM contents are upper-end approximations, as peat layers of some sites (particularly fens) may have had OM
Scientific Reports | (2020) 10:7634 | https://doi.org/10.1038/s41598-020-64275-y 2www.nature.com/scientificreports/ www.nature.com/scientificreports
Coordinate Elevation Mean annual Mean annual Soil pH Land Reference
Site name WGS 84 (m asl) temperature (°C) precipitation (mm) (topsoil)1 use for site
Brüttelen 47.03°N, 7.18°E 438 9.9 1009 6.7 CL a
Cressier_Mis. 47.04°N, 7.05°E 430 10.2 1066 7.9 CL b
Gals I 47.04°N, 7.07°E 430 10.1 1073 6.5 CL c
Im Moos 47.38°N, 9.57°E 414 10.1 1392 6.0 CL a
Lüchingen 47.38°N, 9.57°E 414 10.1 1392 6.1 CL a
Parzelle33 46.98°N, 7.05°E 431 10.2 981 6.6 CL d
Spring 46.98°N, 7.05°E 431 10.2 981 5.5 CL this study
Treiten 47.01°N, 7.15°E 439 10.0 1011 6.2 CL a
Staatswald I 46.98°N, 7.09°E 431 10.1 994 6.3 CL this study
Mühleturnen 46.82°N, 7.52°E 544 8.8 1083 6.3 CL a
Ägeriried 47.07°N, 8.40°E 910 9.3 1343 3.4 FL this study
Bannwald 47.01°N, 8.19°E 860 7.0 1527 3.6 FL a
Birmensdorf 47.36°N, 8.45°E 560 9.3 1137 4.1 FL a
Dévin des Dailles I 46.52°N, 6.96°E 1100 6.2 1470 3.9 FL e
Dévin des Dailles II 46.52°N, 6.96°E 1100 6.2 1470 3.7 FL e
Foremoos 47.01°N, 8.21°E 960 6.8 1653 3.8 FL e
Gals II 47.04°N, 7.07°E 430 10.1 1073 7.3 FL c
Hagenmoos 47.24°N, 8.52° E 600 9.0 1262 4.1 FL this study
Joux Derrière 46.58°N, 7.00°E 1080 6.4 1331 3.8 FL e
Maas 47.36°N, 8.46°E 560 9.0 1136 3.9 FL e
Meiestossmoos I 47.01°N, 8.21°E 960 6.8 1653 3.9 FL e
Meiestossmoos II 47.01°N, 8.21°E 960 6.8 1653 3.8 FL e
Meiestossmoos III 47.01°N, 8.21°E 960 6.8 1653 3.6 FL a
Sigigerwald 47.05°N. 8.15°E 830 7.7 1333 4.3 FL e
Sömmerigchopf I 47.21°N, 9.40°E 1300 6.3 1971 4.5 FL e
Sömmerigchopf II 47.21°N, 9.40°E 1300 6.3 1971 3.9 FL e
Sömmerigchopf III 47.21°N, 9.40°E 1300 6.3 1971 4.8 FL a
Staatswald II 46.98°N, 7.09°E 431 10.1 994 3.4 FL this study
Staatswald III 46.98°N, 7.09°E 431 10.1 994 3.3 FL this study
Staatswald IV 46.98°N, 7.09°E 431 10.1 994 4.2 FL a
Vorderwengi I 47.20°N, 9.10°E 1070 6.3 2152 3.4 FL a
Vorderwengi II 47.20°N, 9.10°E 1078 6.3 2152 4.1 FL e
Weidli 46.77°N, 7.28°E 850 7.7 1262 3.9 FL a
Chiemiwald 46.85°N, 7.17°E 570 9.1 1060 3.5 FL e
Cressier II 47.04°N, 7.05°E 430 10.2 1066 7.4 GL b
Eigenried 47.09° N, 8.53°E 985 9.1 1413 4.7 GL this study
Gals III 47.04°N, 7.07°E 430 10.1 1073 6.3 GL c
Kirchenthurnen 46.82°N, 7.52°E 540 8.8 1083 5.5 GL a
Mühleturnen 46.82°N, 7.52°E 540 8.8 1083 6.0 GL a
Rüthi 47.28°N, 9.54°E 435 10.2 1229 5.8 GL a
Sömmerigchopf IV 47.22°N, 9.40°E 1300 5.4 2151 5.3 GL a
Seebodenalp I 47.03° N, 8.27° E 1025 9.3 1171 3.6 GL d
Seebodenalp II 47.03° N, 8.27° E 1025 9.3 1171 4.3 GL this study
Seebodenalp III 47.05° N, 8.27° E 1077 9.3 1099 4.6 GL this study
Vorderwengi III 47.20°N, 9.10°E 1070 6.3 2152 7.0 GL a
Tourbière au Paquier dessus 46.67°N, 7.16°E 1440 5.2 1791 3.8 NL e
Rüchiwald 46.88°N, 8.04°E 1640 4.8 2039 3.8 NL e
Etang de la Gruyere 47.24° N, 7.05° E 998 6.5 1554 4.0 NL this study
1 in water
Table 1. Site overview. a45, b46, c47, d19, e18.
contents lower than 95% in their pristine state. On the other hand, for some organic soils, losses might have been
even greater: While this study examined only existing organic soils, (near-) complete losses of OM results in clas-
sification as a mineral soil (organic horizon less than 10 cm thick or with less than 20–30% OM depending on clay
content and water saturation); which, in Switzerland, may extend over larger areas than still-existing peatlands25.
Scientific Reports | (2020) 10:7634 | https://doi.org/10.1038/s41598-020-64275-y 3www.nature.com/scientificreports/ www.nature.com/scientificreports
OM SOC N H/C O/C C/N Cox OR
mg g−1
all 802.9 (6.7) 423.4 (3.5) 17.8 (0.2) 1.37 (0.01) 0.55 (www.nature.com/scientificreports/ www.nature.com/scientificreports
OM SOC N C/N H/C O/C Cox
d.f. F p d.f. F p d.f. F p d.f. F p d.f. F p d.f. F p d.f. F p
All samples
Land-use 4 278.05 * 4 289.66 * 4 304.39 * 4 150.64 * 4 1748.1 * 4 568.54 * 4 14.96 *
Site 36 44.09 * 44 34.03 * 44 15.75 * 44 19.30 * 36 14.516 * 36 14.96 * 36 9.71 *
Error 1118 1261 1262 1262 1126 1115 1116
0–0.3 m
Land-use 4 238.13 * 4 233.25 * 4 239.79 * 4 100.20 * 4 1294.1 * 4 458.42 * 4 5.37 0.3 m
Land-use 4 397.57 * 4 307.24 * 4 301.9 * 4 160.25 * 4 1722.5 * 4 574.71 * 4 28.24 *
Site 33 23.38 * 33 21.48 * 33 8.01 * 42 12.05 * 33 9.26 * 33 10.90 * 33 7.24 *
Error 590 621 620 683 597 590 590
Table 3. ANOVA results for all soil samples and differentiated by top- and subsoil (0–0.3 and >0.3 m).
*
P < 0.001.
of peat from this study with values from peatlands around the world21 illustrates this: Whereas the H/C ratios of
deeper peat (>0.3 m) in this study are within the range of that reported from Canadian, UK and Latvian peat-
lands, the H/C ratios from shallower peat of CL and GL sites (from this study) are outside of the range reported
for these other peats. Such high H/C ratios indicate high lipid content32, possibly related to increased microbial
residues indicating high microbial transformation of peat. Additionally, soil C/N ratios were smaller in topsoils
of managed systems, suggesting higher N input and/or advanced microbial transformation of the peat33. Notably,
this result was reversed for the natural sites. Here, in accordance with other natural mire profiles6,11, a smaller C/N
ratio in subsoil is maintained. Taken together, a reversed trend of C/N ratios with depth, as found for CL, GL, and
FL, might be indicative of advanced peat decomposition in organic soils.
Net N release from mineral soil is expected to depend on the soil’s C/N ratio. For mineral soils, a high C/N ratio
is associated with lower N release, whereas at ratios below 15, N release increases exponentially5. Mechanistically,
the negative relationship between soil C/N and N release is explained by the difference in stoichiometry of the
decomposing microbial biomass vs. the nutrient-poor plant litter material. With continuing microbial transfor-
mation, soil’s C/N ratio declines, approaching values of 10 and below34. A non-linear relationship has been also
reported for the dependency of N2O emissions on C/N in organic soil: at C/N ratios of below 15, N2O emissions
tend to increase sharply35–37. These studies indicate that even strongly degraded and managed organic soils bear
the risk of high N losses, in line with constantly high OM mineralization rates also found in strongly degraded
peat38,39. Our sites represent different stages of soil degradation, and as such indicate that with ongoing OM loss,
N-release rates increase in conjunction with a decline in soil C/N. This occurs in spite of an accumulation of N
relative to the other elements. Figure 2 and Table S1 indicate that the smaller the C/N ratio becomes, the more C
and N are lost in tandem. The C/N ratios change only little (CL, GL) or or almost not at all (FL, NL) below 75%
OM. At higher OM contents, N seems mostly retained within the soil system. Data in Table 2 allow an estimate
of the gross N mobilization in organic soil. With an annual C loss rate of 8 t ha−1, a value typical for drained and
intensively managed temperate peatlands17, topsoil of a cropland with an average C/N ratio of 14.5 may annually
release c. 550 kg N ha−1, a magnitude in line with experimental evidence40. Although this calculation is only a
rough estimate, it stresses that more attention should be paid to the N cycle and N loss in degrading peatlands.
Set into a wider geographical context, our peat samples contained less C and considerably more N, resulting
in a different distribution of C/N ratios compared to the northern hemisphere data set of7. As discussed above,
the relative enrichment of N over other elements in degrading peat as caused by the different stoichiometry of
plant material and decomposer organisms may be one reason for this, considering that the sites in7 are mostly
unmanaged and, hence, accumulate peat. In addition, intensively managed organic soils are fertilized and prone
to substantial atmospheric N deposition. In the Swiss Central Plateau, where most of the studied cropland and
grassland sites are situated, annual N deposition can reach 30–40 kg N ha−1, and even in peatland ecosystems and
forests, N deposition records in Switzerland are 10–20 kg N ha−1a−1 and up to 50 kg N ha−1a−1 in single fens41.
Nitrogen input into peatlands, particularly bogs, alters vegetation communities, increases peat mineralization,
and impairs CO2 uptake42–44. Thus, with ongoing peat decomposition, the observed relative accrual of soil N and
the postulated increase in N release may induce a positive feedback mechanism, where peat communities altered
by N deposition are subjected to accelerated decomposition processes, thereby mineralizing more C and further
exacerbating declining C/N ratios. Notably, C/N ratios in7 also exceeded our measurements for samples with
>50% SOC. These C-rich samples were mostly from natural and forest sites, suggesting that external N input may
also play a relevant role when peatlands are not managed.
Methods
We took peat samples at 48 sites in Switzerland (Table 1) down to a maximum depth of 1–2 m. When peat thick-
ness was less, samples were collected down to the underlying sediment or bedrock. Samples were either collected
with a russian peat auger (Eijkelkamp, The Netherlands) or, when soils were more compacted (as is typically the
case for agricultural sites), with a motor driven auger (Humax, Switzerland). Peat samples were taken in triplicate
Scientific Reports | (2020) 10:7634 | https://doi.org/10.1038/s41598-020-64275-y 5www.nature.com/scientificreports/ www.nature.com/scientificreports
1.2
Cropland
1.0 Forest
Grassland
Natural Bog
0.8
O/C
0.6
0.4
0.2
0.0
2.2
2.0
1.8
1.6
1.4
H/C
1.2
1.0
0.8
0.6
0.4
0.12
0.10
0.08
N/C
0.06
0.04
0.02
0.00
0 10 20 30 40 50 60 70
% SOC
Figure 1. Soil organic matter O/C (upper panel), H/C (middle), and N/C (lower panel) ratios as related to SOC
concentration in peatlands. Symbols represent the four studied land use types. Coefficients of determination for
linear regressions were 0.22, 0.50, and 0.59 for O/C, H/C, and N/C, respectively (For details, see Suppelementary
Table S1).
per site 25–50 m apart. Cores were cut into 3–10 cm increments, dried at 105 °C, milled, and measured for C, H,
and N by dry combustion and elemental analysis, and for organic O after pyrolysis at 1000 °C and subsequent
GC-TCD quantification (Hekatech, Germany). A few samples contained carbonate and were HCl fumigated
before elemental analysis. Soil horizons in fens that showed clear signs of sediment layers were excluded from the
analysis. In addition, a lower threshold of 10% SOC was used to distinguish peat from non-peat. This threshold
does not compromise the minimum requirement for organic horizons defined by17, as samples with SOC con-
tents between 10–20% were always part of a thicker organic horizon with higher SOC contents in other layers.
Minimum thicknesses of organic horizons in sensu17 were 0.4 m. We assigned sites to land use by site inspection
of the vegetation and sampled 10 CL sites, 11 GL sites, 24 FL sites, and 3 natural undisturbed bogs (NL). All of
the cropland and grassland sites, and most of the forest sites were drained. In most cases, drainage commenced
many decades to >one century ago. The average site altitude (m asl.) was 440 (CL), 805 (GL), 860 (FL) m and
1359 m (NL). Correspondingly, climate data across land-use types differed (see Table 1). Average mean annual
temperatures were 10.0, 8.7, 7.7, and 5.5 °C and mean annual precipitation 1098, 1336, 1467, and 1795 mm for
CL, GL, FL, and NL, respectively.
The number of samples from the four land use types are 193 (CL), 338 (GL), 662 (FL), and 117 (NL). Mean
depths of all samples taken within one land-use were 0.45, 0.48, 0.44 and 0.70 m for CL, GL, FL, and NL, and
mean maximum depth of sampling were 0.95, 0.75, 0.91, and 1.23 m for CL, GL, FL, and NL.
Scientific Reports | (2020) 10:7634 | https://doi.org/10.1038/s41598-020-64275-y 6www.nature.com/scientificreports/ www.nature.com/scientificreports
Figure 2. Deviation in sample stoichiometry from the average stoichiometry, based on molar percentages, of
the whole data set for each element. In addition, soil C/N ratios are shown. Data are plotted as a function of soil
OM content. Lines represent running averages (n = 10 samples) for each parameter. For C/N ratios, the running
average for samples from forest and natural sites is displayed as a solid dark green line, and the one for samples
from cropland and grassland sites as a solid grey line.
Figure 3. Comparison of C/N ratios and SOC contents of Northern Hemisphere peatlands7 with the current
data set from temperate, mostly managed peatlands in Switzerland. Vertical lines group the data set into classes
of different SOC content; error probabilities indicate whether C/N ratios of the current data set are significantly
below that of the Loisel data set7. The small insert shows distribution of C/N ratios for both data sets.
In total, 1310 samples were analysed for their SOC and N content, and 1165 for their O and H content. We
refer to the sum of these four elements as soil organic matter. OM oxidation state (Cox) and oxidative ratios were
calculated according to27. Effects of land use on OM content, H/C, O/C, C/N ratios, and Cox were analysed using
ANOVA with land-use as fixed factor and site as random factor nested in land-use to take account of possible dif-
ferences in peat properties induced by preferential use of sites for specific land use. Differences between land-use
was tested post-hoc by Fisher’s LSD test. The relationship between % OM and deviations in OM stoichiometry
from the average OM composition, and the relationship between % SOC and molar ratios H/C, O/C, N/C were
studied by linear regression. Peat C and N contents of our data set were compared with a much larger data set of
mostly undisturbed peatlands from the Northern hemisphere published by7, and C/N ratios of the Northern data
set and our data were compared for different classes of SOC content using a Mann-Whitney U-test.
Received: 17 September 2019; Accepted: 30 March 2020;
Published: xx xx xxxx
References
1. Paustian, K. et al. Climate-smart soils. Nature 532, 49–57, https://doi.org/10.1038/nature17174 (2016).
2. Tipping, E., Somerville, C. J. & Luster, J. The C:N:P:S stoichiometry of soil organic matter. Biogeochemistry 130, 117–131, https://doi.
org/10.1007/s10533-016-0247-z (2016).
3. Kirkby, C. A. et al. Carbon-nutrient stoichiometry to increase soil carbon sequestration. Soil Biology and Biochemistry 60, 77–86,
https://doi.org/10.1016/j.soilbio.2013.01.011 (2013).
4. Conant, R. T., Paustian, K., Del Grosso, S. J. & Parton, W. J. Nitrogen pools and fluxes in grassland soils sequestering carbon. Nutrient
Cycling in Agroecosystems 71, 239–248, https://doi.org/10.1007/s10705-004-5085-z (2005).
5. Springob, G. & Kirchmann, H. Bulk soil C to N ratio as a simple measure of net N mineralization from stabilized soil organic matter
in sandy arable soils. Soil Biology & Biochemistry 35, 629–632 (2003).
Scientific Reports | (2020) 10:7634 | https://doi.org/10.1038/s41598-020-64275-y 7www.nature.com/scientificreports/ www.nature.com/scientificreports
6. Kuhry, P. & Vitt, D. H. Fossil Carbon/Nitrogen ratios as a measure of peat decomposition. Ecology 77, 271–275, https://doi.
org/10.2307/2265676 (1996).
7. Loisel, J. et al. A database and synthesis of northern peatland soil properties and Holocene carbon and nitrogen accumulation.
Holocene 24, 1028–1042 (2014).
8. Batjes, N. H. Harmonized soil profile data for applications at global and continental scales: updates to the WISE database. Soil Use
and Management 25, 124–127, https://doi.org/10.1111/j.1475-2743.2009.00202.x (2009).
9. Hoyos-Santillan, J. et al. Quality not quantity: Organic matter composition controls of CO2 and CH4 fluxes in neotropical peat
profiles. Soil Biology and Biochemistry 103, 86–96, https://doi.org/10.1016/j.soilbio.2016.08.017 (2016).
10. Biester, H., Knorr, K. H., Schellekens, J., Basler, A. & Hermanns, Y. M. Comparison of different methods to determine the degree of
peat decomposition in peat bogs. Biogeosciences 11, 2691–2707, https://doi.org/10.5194/bg-11-2691-2014 (2014).
11. Malmer, N. & Holm, E. Variation in the C/N quotient of peat in relation to decomposition rate and age determination with PB-210.
Oikos 43, 171–182 (1984).
12. Wang, M., Moore, T. R., Talbot, J. & Riley, J. L. The stoichiometry of carbon and nutrients in peat formation. Global Biogeochemical
Cycles 29, 113–121, https://doi.org/10.1002/2014gb005000 (2015).
13. Krüger, J. P., Leifeld, J., Glatzel, S., Szidat, S. & Alewell, C. Biogeochemical indicators of peatland degradation - a case study of a
temperate bog in northern Germany. Biogeosciences 12, 2861–2871 (2015).
14. Broder, T., Blodau, C., Biester, H. & Knorr, K. H. Peat decomposition records in three pristine ombrotrophic bogs in southern
Patagonia. Biogeosciences 9, 1479–1491, https://doi.org/10.5194/bg-9-1479-2012 (2012).
15. Klavins, M., Sire, J., Purmalis, O. & Melecis, V. Approaches to estimating humification indicators for peat. Mires and Peat 3, Article
07 (2008).
16. Berglund, O., Berglund, K. & Klemedtsson, L. A lysimeter study on the effect of temperature on CO2 emission from cultivated peat
soils. Geoderma 154, 211–218, https://doi.org/10.1016/j.geoderma.2008.09.007 (2010).
17. IPCC. 2013 Supplement to the 2006 IPCC Guidelines for National Greenhouse Gas Inventories: Wetlands. 354 (Switzerland, 2014).
18. Wüst-Galley, C., Mössinger, E. & Leifeld, J. Loss of the soil carbon storage function of drained forested peatlands. Mires and Peat 18,
1–22 (2016).
19. Leifeld, J., Steffens, M. & Galego-Sala, A. Sensitivity of peatland carbon loss to organic matter quality. Geophysical Research Letters
39, article L14704, https://doi.org/10.1029/2012gl051856 (2012).
20. Sjögersten, S. et al. Organic matter chemistry controls greenhouse gas emissions from permafrost peatlands. Soil Biology and
Biochemistry 98, 42–53, https://doi.org/10.1016/j.soilbio.2016.03.016 (2016).
21. Moore, T. R., Large, D., Talbot, J., Wang, M. & Riley, J. L. The stoichiometry of Carbon, Hydrogen, and Oxygen in peat. Journal of
Geophysical Research: Biogeosciences 123, 3101–3110, https://doi.org/10.1029/2018jg004574 (2018).
22. Joosten, H. The global peatland CO2 picture. Peatland status and drainage related emissions in all countries of the world., 36
(Wetlands International, Ede, NL, 2010).
23. Tubiello, F., Biancalani, R., Salvatore, M., Rossi, S. & Conchedda, G. A worldwide assessment of greenhouse gas emissions from
drained organic soils. Sustainability 8, 371 (2016).
24. Ewing, J. & Vepraskas, M. Estimating primary and secondary subsidence in an organic soil 15, 20, and 30 years after drainage.
Wetlands 26, 119–130, https://doi.org/10.1672/0277-5212(2006)26[119:epassi]2.0.co;2 (2006).
25. Wüst-Galley, C., Grünig, A. & Leifeld, J. Land use-driven historical soil carbon losses in Swiss peatlands. Landscape Ecology 35,
173–187, https://doi.org/10.1007/s10980-019-00941-5 (2020).
26. Erkens, G., van der Meulen, M. J. & Middelkoop, H. Double trouble: Subsidence and CO2 respiration due to 1000 years of Dutch
coastal peatlands cultivation. Hydrogeology Journal 24, 551–568, https://doi.org/10.1007/s10040-016-1380-4 (2016).
27. Masiello, C. A., Gallagher, M. E., Randerson, J. T., Deco, R. M. & Chadwick, O. A. Evaluating two experimental approaches for
measuring ecosystem carbon oxidation state and oxidative ratio. Journal of Geophysical Research: Biogeosciences 113, n/a–n/a,
https://doi.org/10.1029/2007JG000534 (2008).
28. Worrall, F., Clay, G. D., Masiello, C. A. & Mynheer, G. Estimating the oxidative ratio of the global terrestrial biosphere carbon.
Biogeochemistry 115, 23–32, https://doi.org/10.1007/s10533-013-9877-6 (2013).
29. Leifeld, J., Müller, M. & Fuhrer, J. Peatland subsidence and carbon loss from drained temperate fens. Soil Use and Management 27,
170–176, https://doi.org/10.1111/j.1475-2743.2011.00327.x (2011).
30. Leifeld, J. et al. Pyrogenic carbon contributes substantially to carbon storage in intact and degraded Northern Peatlands. Land
Degradation & Development 29, 2082–2091, https://doi.org/10.1002/ldr.2812 (2018).
31. Heller, C., Ellerbrock, R. H., Roßkopf, N., Klingenfuß, C. & Zeitz, J. Soil organic matter characterization of temperate peatland soil
with FTIR-spectroscopy: effects of mire type and drainage intensity. European Journal of Soil Science, n/a-n/a, https://doi.
org/10.1111/ejss.12279 (2015).
32. Preston, C. M. & Schmidt, M. W. I. Black (pyrogenic) carbon: a synthesis of current knowledge and uncertainties with special
consideration of noreal regions. Biogeosciences 3, 397–420 (2006).
33. Säurich, A., Tiemeyer, B., Dettmann, U. & Don, A. How do sand addition, soil moisture and nutrient status influence greenhouse gas
fluxes from drained organic soils? Soil Biology and Biochemistry 135, 71–84, https://doi.org/10.1016/j.soilbio.2019.04.013 (2019).
34. Guggenberger, G., Christensen, B. T. & Zech, W. Land-use effects on the composition of organic-matter in particle-size separates of
soil .1. Lignin and carbohydrate signature. European Journal of Soil Science 45, 449–458 (1994).
35. Klemedtsson, L., Von Arnold, K., Weslien, P., Gundersen, P. & Soil, C. N. ratio as a scalar parameter to predict nitrous oxide
emissions. Global Change Biology 11, 1142–1147, https://doi.org/10.1111/j.1365-2486.2005.00973.x (2005).
36. Mu, Z., Huang, A., Ni, J. & Xie, D. Linking annual N2O emission in organic soils to mineral nitrogen input as estimated by
heterotrophic respiration and soil C/N ratio. PLoS ONE 9, e96572, https://doi.org/10.1371/journal.pone.0096572 (2014).
37. Leifeld, J. Distribution of nitrous oxide emissions from managed organic soils under different land uses estimated by the peat C/N
ratio to improve national GHG inventories. Science of The Total Environment 631–632, 23–26, https://doi.org/10.1016/j.
scitotenv.2018.02.328 (2018).
38. Leiber-Sauheitl, K., Fuß, R., Voigt, C. & Freibauer, A. High CO2 fluxes from grassland on histic Gleysol along soil carbon and
drainage gradients. Biogeosciences 11, 749–761, https://doi.org/10.5194/bg-11-749-2014 (2014).
39. Tiemeyer, B. et al. High emissions of greenhouse gases from grasslands on peat and other organic soils. Global Change Biology 22,
4134–4149, https://doi.org/10.1111/gcb.13303 (2016).
40. Wang, H., Richardson, C. J., Ho, M. & Flanagan, N. Drained coastal peatlands: A potential nitrogen source to marine ecosystems
under prolonged drought and heavy storm events—A microcosm experiment. Science of the Total Environment 566-567, 621–626
(2016).
41. Seitler E., Thöni L. & M., M. Atmosphärische Stickstoff-Deposition in der Schweiz 2000 bis 2014. 105 (Rapperswil, 2016).
42. Breeuwer, A., Heijmans, M., Robroek, B. J. M., Limpens, J. & Berendse, F. The effect of increased temperature and nitrogen
deposition on decomposition in bogs. Oikos 117, 1258–1268, https://doi.org/10.1111/j.0030-1299.2008.16518.x (2008).
43. Chapin, C. T., Bridgham, S. D., Pastor, J. & Updegraff, K. Nitrogen, phosphorus, and carbon mineralization in response to nutrient
and lime additions in peatlands. Soil Science 168, 409–420, https://doi.org/10.1097/00010694-200306000-00003 (2003).
44. Bubier, J. L., Moore, T. R. & Bledzki, L. A. Effects of nutrient addition on vegetation and carbon cycling in an ombrotrophic bog.
Global Change Biology 13, 1168–1186, https://doi.org/10.1111/j.1365-2486.2007.01346.x (2007).
Scientific Reports | (2020) 10:7634 | https://doi.org/10.1038/s41598-020-64275-y 8www.nature.com/scientificreports/ www.nature.com/scientificreports
45. Bader, C., Müller, M., Schulin, R. & Leifeld, J. Peat decomposability in managed organic soils in relation to land use, organic matter
composition and temperature. Biogeosciences 15, 703–719 (2018).
46. Bader, C., Müller, M., Schulin, R. & Leifeld, J. Amount and stability of recent and aged plant residues in degrading peatland soils. Soil
Biology & Biochemistry 109, 167–175 (2017).
47. Bader, C., Müller, M., Szidat, S., Schulin, R. & Leifeld, J. Response of peat decomposition to corn straw addition in managed organic
soils. Geoderma 309, 75–83, https://doi.org/10.1016/j.geoderma.2017.09.001 (2018).
Acknowledgements
We are grateful to Robin Giger for the measurement of element contents of all samples in our laboratory.
Author contributions
J.L. coordinated the collation of data, carried out analyses and wrote the manuscript; K.K. and C.W. also discussed
interpretation of results and contributed to the manuscript.
Competing interests
The authors declare no competing interests.
Additional information
Supplementary information is available for this paper at https://doi.org/10.1038/s41598-020-64275-y.
Correspondence and requests for materials should be addressed to J.L.
Reprints and permissions information is available at www.nature.com/reprints.
Publisher’s note Springer Nature remains neutral with regard to jurisdictional claims in published maps and
institutional affiliations.
Open Access This article is licensed under a Creative Commons Attribution 4.0 International
License, which permits use, sharing, adaptation, distribution and reproduction in any medium or
format, as long as you give appropriate credit to the original author(s) and the source, provide a link to the Cre-
ative Commons license, and indicate if changes were made. The images or other third party material in this
article are included in the article’s Creative Commons license, unless indicated otherwise in a credit line to the
material. If material is not included in the article’s Creative Commons license and your intended use is not per-
mitted by statutory regulation or exceeds the permitted use, you will need to obtain permission directly from the
copyright holder. To view a copy of this license, visit http://creativecommons.org/licenses/by/4.0/.
© The Author(s) 2020
Scientific Reports | (2020) 10:7634 | https://doi.org/10.1038/s41598-020-64275-y 9You can also read