21st Century Recessions in the European Union - Henna Repo - Theseus
←
→
Page content transcription
If your browser does not render page correctly, please read the page content below
21st Century Recessions in the
European Union
A correlation between recession and profitability

Henna Repo
BACHELOR’S THESIS
February 2020

International Business
ABSTRACT

Tampereen Ammattikorkeakoulu
Tampere University of Applied Sciences
International Business

Henna Repo:
21st century recessions in the European Union: A correlation between recession
and profitability

Bachelor's thesis 31 pages, appendices 5 pages
February 2020

This study was conducted to find out of if there is a correlation between the 21st
century recessions and profitability of European enterprises operating in mining
and quarrying, manufacturing, construction of buildings, wholesale and retail
trade industry. Recessions are nowadays norm rather than exception due to the
economic volatility that is result of globalisation and interconnected markets.
Therefore, it is important to understand how recessions impact the profitability of
enterprises. The first part of this study defined Europe as an economic
environment, inflation and purchasing power parity, economic cycle and 21 st
century recessions. Frederick Hawley’s Theory of Risk and Uncertainty and John
Keynes’ Model of Economics are used to explain the natural changes in the
economic environment and why it causes changes in profitability. The second
part of this study examined the relationship between recessions and profit before
taxation between 2007-2019. The hypothesis for this thesis was that the
recessions have a relation to the profitability of enterprises. The variable used to
portray recessions was a gross domestic product between 2007-2019. The profit
before taxation was collected from 10 randomly selected enterprises operating in
mining and quarrying, manufacturing, construction of buildings, wholesale and
retail trade industry between 2007-2019. The statistical method used for this
study was linear regression. The two measures used to prove a correlation were
P and R2. The profit before taxation of enterprises between 2007-2019 was
selected as dependent variable, and the used independent variable was a gross
domestic product of the European Union between 2007-2019. In the third part of
this study, it was discussed that only enterprises operating mining and quarrying
had positive correlation with a gross domestic product of the European Union
between 2007-2019. Therefore, the hypothesis of this study was proved to be
wrong with all industries expect mining and quarrying. This suggests there is no
relation with recessions and profitability of the enterprises used in this study.

Key words: profitability, recession, European Union
3

CONTENTS

1 INTRODUCTION .................................................................................. 4
 1.1 The European Union as Economic Environment............................ 5
 1.2 Aggregate Demand and Supply ..................................................... 6
 1.2.1 Aggregate Demand .............................................................. 6
 1.2.2 Aggregate Supply ................................................................. 7
 1.3 Annual Inflation Rate of Goods │ 2002–2020 ................................ 8
 1.3.1 Annual Inflation Rate of Goods between 2002–2020 in the
 European Union ................................................................. 11
 1.4 Purchasing Power Parity .............................................................. 11
 1.4.1 Purchasing Power of 1€ │ 2000-2020 ................................ 13
 1.5 Economic Cycles.......................................................................... 13
 1.5.1 Indicators of Economic Cycles ........................................... 14
 1.6 Recession .................................................................................... 15
 1.7 Recession in Europe .................................................................... 16
 1.7.1 The Great Recession.......................................................... 17
 1.7.2 COVID19-Recession .......................................................... 17
2 Theoretical Framework ....................................................................... 18
 2.1 Theory of Risk and Uncertainty of Profit ....................................... 18
 2.2 Keynesian Model of Economics ................................................... 19
3 Methodology ....................................................................................... 21
 3.1 Statistical Methods ....................................................................... 22
4 Results ................................................................................................ 25
 4.1 Gross Domestic Product in European Union │2007-2019 ........... 25
 4.2 Profit Before Taxes on Industry Level │2007-2019 ...................... 26
 4.3 R2 and P-value ............................................................................. 27
 4.3.1 Scatterplot .......................................................................... 27
 4.3.2 Linear Regression Analysis ................................................ 29
5 Discussion .......................................................................................... 31
6 Conclusion .......................................................................................... 33
REFERENCES ........................................................................................ 35
 Appendix 1. Profitability & GDP 2007-2019 in B€ ............................... 45
 Appendix 2. Regression Analysis ....................................................... 46
4

1 INTRODUCTION

This study is conducted to find out if there is a correlation between recessions in
the 21st century and the profitability of European enterprises operating in mining
and quarrying, manufacturing, construction of buildings, wholesale and retail
trade industry. This study aims to answer the following research question.

 1. Is there a correlation between 21st century recessions and the profitability
 between 2007-2019 of European enterprises operating in mining and
 quarrying, manufacturing, construction of buildings, wholesale and retail
 trade industry?

If statistically significant correlation can be found, then the following research
subquestion is answered.

 1. Which industry has greater correlation with recessions?

This study is conducted in three parts. The first part of this study defines Europe
as an economic environment, reviews the previous research conducted on
inflation and purchasing power parity, economic cycle and 21 st century
recessions and defines the theoretical framework using Frederick Hawley’s
Theory of Risk and Uncertainty and Keynesian Model of Economics.

The second part of this study uses linear regression to analyse if there is a
correlation between the profitability between 2007-2019 of European enterprises
operating in mining and quarrying, manufacturing, construction of buildings,
wholesale and retail trade industry and the 21st century recessions. The variable
used in this study to indicate recession is a gross domestic product between
2007-2019.

In the third part of this study, the results of the linear regression are discussed,
and the hypothesis of this study is tested.
5

1.1 The European Union as Economic Environment

Goods, services, and money are indicators of the financial state of the economy.
Economic environment changes when the exchange and interest rates, demand,
supply and taxes change. Changes in these factors impact the financial stability
of industries. Financial Stability is a situation where enterprises operating in
industry are resilient and can efficiently use its resources and assess its financial
risks. Fault in any of these components may result in financial instability in the
future. As the world economy has shifted from trade to capital movements, work
and employment has become more complex, a portion of primary products of
total production has diminished and the global economy has polarized, the
economic environment has become volatile. (Carter, 1997; Bush, 2016; Schinasi,
2016)

The European Union is an economic environment for its member countries. The
member countries have shared economic, fiscal, and monetary policies.
European Central Bank governs the monetary policies, and the member states
govern economic policies. The European Union has a single market that allows
the free movement of people and goods. The benefits of a single market include
easier trading, increased competition and better quality of goods. (European
Union, n.d; European Comission, 2020, Europa, n.d a)

Members on the European Union can freely trade with each other and many
countries outside of it. There are no custom duties when trading between
European Union countries. Custom union regulates the customs. 30% of the
gross domestic product of European Union comes from foreign trade. (Europa,
n.d, Europe, n.d)

According to regulation No 638/2004 the enterprises that are registered for value
added tax and whose annual trade amount exceeds certain limit must report their
transactions with the EU countries they are trading with. The limit is adjusted
annually. (Eur-lex, 2016.)

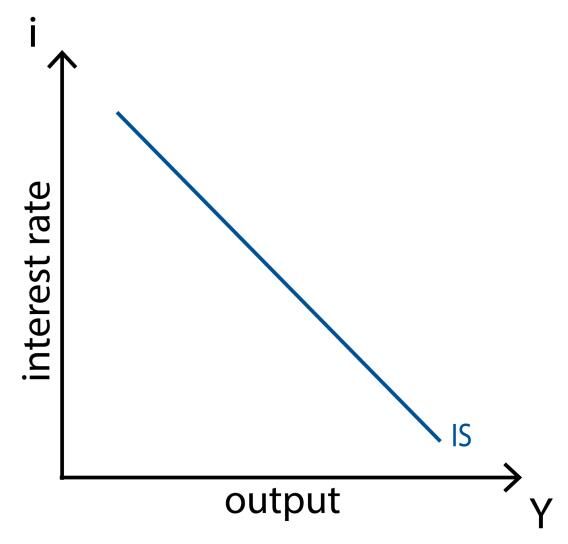
6

This study uses a sample that includes some enterprises that do not operate in
the European Union or do not have euro as their currency. However, all the
European enterprises operate in the same economic environment and therefore
the location of the enterprise is irrelevant for this study.

This study uses demand and supply as indicators of the economic environment.
In the next chapter, it will be discussed further what is demand and supply, how
they change the economic environment and how they affect the inflation and
purchasing power parity.

1.2 Aggregate Demand and Supply

Traditionally the economic market is divided into two groups: suppliers and
buyers. Prices are determined by the valuation of the goods and the cost to
produce them. The demand is depended on the purchasing power of buyers,
whereas suppliers set the level of supply. (Drennan, 2008.)

1.2.1 Aggregate Demand

The national product is the sum of demand, investment and government
expenditure.

 = + +
 y is the national product, c is demand, i is investment and g is government
 expenditure (Dieffenbach, 2014.)

The relationship of these variables can be shown on IS-curve. The interest rate
(i) is set on the y-axel and the output (y) on the x-axel. The trendline shown in
the figure is the relationship between demand, investment and government
expenditure. (Dieffenbach, 2014.)
7

Figure 1. IS-curve (Policonomics, n.d.)

When the interest rate decreases the output increases which causes an
increase in the national income and product. This can be seen in the figure 1.
The curve can shift to right if demand, investment or government expenditure
increases, and if they decrease the curve shifts to the left. (Wright, 2012;
Dieffenbach, 2014)

1.2.2 Aggregate Supply

In the short run, the suppliers react to the rise of the prices by increasing their
production. This improves their profits because while the prices have risen the
costs take time to adjust to the changes in the market. Due to this reason the
aggregate supply curve is upward sloping. In the long term the supply curve
becomes vertical when the production reaches its limit. (Wright, 2012.)

 = + ( − )

 Y is production of the economy, Yx is the natural level of production of the
economy, coefficient α>0, P is the price level, and Pe is the expected price level.
 (Lumenlearning, n.d)
8

Figure 2. Aggregate Supply Curve (Triplealearning, n.d)

The increased price level increases the real national output as figure 2 shows.
The curve can shift to the right because of positive supply shock, the decrease in
inflation or when the natural level of production is greater than the production of
the economy. The opposite changes in these factors can cause the curve to shift
left. (Wright, 2012.)

1.3 Annual Inflation Rate of Goods │ 2002–2020

One of the factors that affect the profitability of the enterprises is inflation. Small
changes on inflation are normal for economy and in moderation they can increase
spending and investment. An increase in inflation rises the need for loans and
resources that are used for production. This happens because the suppliers aim
to meet the demand. If the inflation grows out of its healthy boundaries, it can
cause negative impacts on the economy. Examples of negative impacts are
decreased spending, investment, employment and international trade. If inflation
grows to the point that the money loses its worth, it is called hyperinflation.
(McB.Grant and R.L.Mathews, 1956; Hashaw, 2020)

Inflation occurs when there is disturbance in the balance of demand and supply.
When prices increase due to cost-push or if there are changes in the overall
societal situation, it can cause distribution in the economic environment resulting
in inflation. (Roncaglia de Carvalho, Ribeiro and Marques, 2018)

Consumer price index is used to calculate the rate of inflation. It compares the
cost of living on the base year compared to the following year. (Hashaw, 2020.)
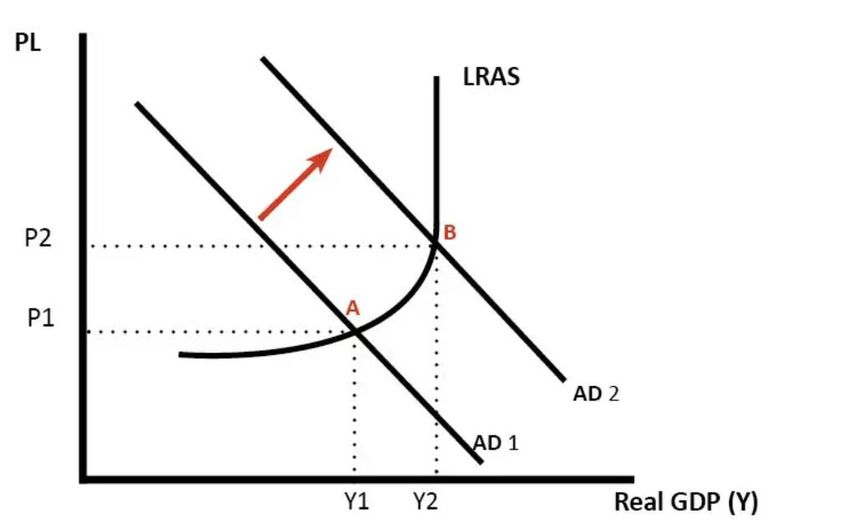
9

 − +1
 = × 100

 CPIx is the consumer price index in year x (Hashaw, 2020.)

There are three types of inflation. Demand-pull inflation occurs when the
aggregated demand exceeds the supply of full capacity. Cost-push inflation
occurs when the costs increase separately from the demand. Built-in inflation
happens as the cost of living increases which drives the wages up which results
in increased prices. (Sherman, Meeropol and Sherman, 2019; Hashaw, 2020)

Figure 3. Demand-pull inflation (Pettinger, 2019b.)

Figure 3 reveals what happens when the aggravated demand (AD) exceeds the
long run aggravated supply (LRAS). When AD moves from point Y1 to Y2 it pulls
the price from A to B. Demand-pull inflation causes. increased competition and
prices because the supply cannot meet the demand.(Hashaw, 2020.)
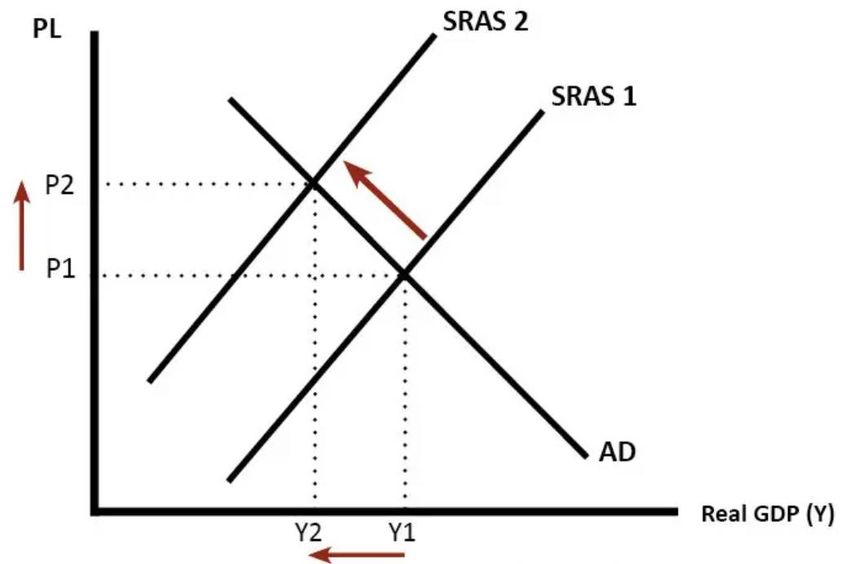
10

Figure 4. Cost-push inflation (Pettinger, 2019a.)

Figure 4 illustrates how cost-push inflation occurs. When the short-run
aggravated supply (SRAS) exceeds the aggravated demand (AD) it pushes the
price level up from P1 to P2. This usually happens as a result of external event
such as natural disaster that constraints the level of production, while the demand
remains the same. (Hashaw, 2020.)
11

1.3.1 Annual Inflation Rate of Goods between 2002–2020 in the European
 Union

Figure 5. Annual Inflation Rate of Goods between 2002-2020 in European Union1

The annual inflation rate of all goods between 2002-2020 in the European Union
can be seen in the figure 5. The annual inflation rate of all goods remained around
to 6.5% in 2002-2007. Inflation had a significant increase in 2008 when it went up
to 10.2% and in 2009 it dropped down to 0.7%. Between 2010-2011 inflation grew
to 8.21% until it began decreasing in 2012. It reached its lowest point in 2015
when it was 0.40%. In 2016, the inflation grew to 4.67% in 2017 when it started
decreasing. In 2020, the inflation was 0.46%. (Eurostat, 2020.)

The inflation rate seems to coincide with the recessions that occurred in 2008-
2008-2009, 2011-2013 and 2020. During these time periods the inflation rate was
lower suggesting lower demand and contracted economic activity. These
changes in the economic activity and demand probably affected the profitability
of enterprises as production would have declined because of lower demand. This
paper looks in depth of these recessions in the subchapter ‘Recession in Europe’.

1.4 Purchasing Power Parity

1 Based on the data obtained from Eurostat (2020). Years 2000-2001 are not included due to the
missing data on dataset. The inflation rate is based on a harmonised index of consumer prices.
The graph was constructed by calculating the average inflation rate of all goods for each year.
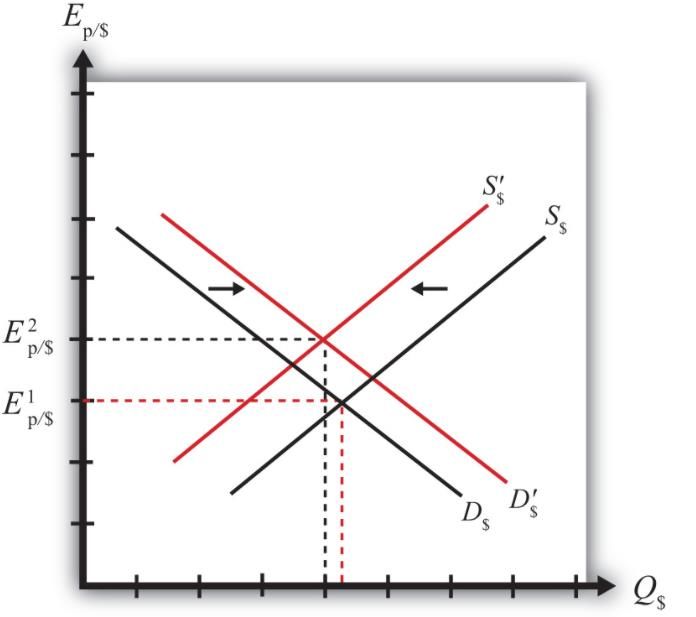
12

Purchasing power parity is used to calculate the exchange rates of currencies by
comparing the purchasing power of one currency to another. (Ziebart, 1985.) This
affects the profitability of the enterprises when the enterprise is trading with a
country that uses different currency.

 $
 =
 €

P stands for the purchasing power parity. $ is the price of the good in dollars and € the
 good in euros (Dornbusch, 1985.)

Problems with the purchasing power is the changes in price levels in different
countries and transport costs that include tariffs and quotas. Due to these factors
the prices might not be comparable.(Dornbusch, 1985.)

Figure 6. The value of currency in relation to Supply and Demand (Melitz,
Obstfeld and Krugman, 1998)

Figure 6 reveals the relation between the demand, supply and value of currency.
When the demand or supply shifts, it causes an increase in the value of currency
and therefore the exchange rate rises. When the supply (S) or demand (D) shifts
from its original point, it moves the exchange rate (E). (Melitz, Obstfeld and
Krugman, 1998.)
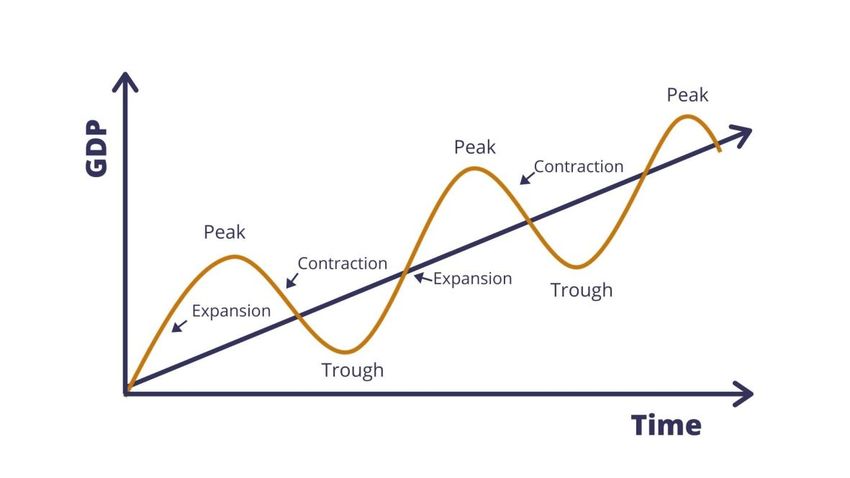
13

1.4.1 Purchasing Power of 1€ │ 2000-2020

Figure 7. Purchasing Power of 1€ 2000-20202

The figure 7 shows that the purchasing power of euro has steadily fallen between
2000-2020. In 2000 purchasing power of one euro was 1.39 times more than in
2020. This means that the cost of living has risen in euro countries as one euro
in 2020 is worth less than it was in 2000. (Statista, 2020.)

1.5 Economic Cycles

Economic cycle is the way the economy changes through time through
expansions and contractions. The economic cycle can be illustrated on x-y-axel
where a gross domestic product is on y-axel and time on x-axel. The trendline set
on the figure portrays the changes in a gross domestic product during the
selected time. There are patterns in the changes of a gross domestic product
which are known as economic cycles. The four stages of the economic cycle are
expansion, peak, recession, and recovery. (Rosanna, 2011; Hussain and Ashe,
2020)

2 Based on the data obtained from Statista (2020)
14

Figure 8. Economic Cycles (Gunther, 2020.)

The figure 8 shows the economic cycles. During expansion, the economy grows
in terms of production and profits. When economy reaches its limit of expansion,
it reaches its peak which is the highest point on the figure 8. The economy enters
recession after the peak. In recession, economic activity contracts substantially.
This is discussed further in the following chapter. The lowest point for the
economic activity is called trough after which the economy recovers and begins
growing again. The growth can be seen as increase in the gross domestic
product. (Hussain and Ashe, 2020; IG, 2020)

There are four key elements that are applicable to the economic cycles. Firstly,
the economic cycles have occurred throughout economic history. Secondly, the
time of the economic cycles varies. Thirdly, the amplitude of the economic
cycles is not constant. Lastly, the economic cycles occur in all economies.
(Rosanna, 2011.)

1.5.1 Indicators of Economic Cycles

Indicators are used to predict future economic cycles. These indicators are
summaries of the data collected from the economic activity. There are three type
of indicators that can predict future recessions or booms: leading, coincident and
lagging indicator. A Leading indicator is suggesting a future recession or
15

expansion, and it declines before recession. Coincident indicator is implying a
current recession or expansion, and it declines during recession. Lagging
indicator shows past recessions or booms, and it declines during recession.
(Rosanna, 2011.)

1.6 Recession

Recession is a weak economic phase which exceeds the normal contraction
limits of the economy and its impact is in a larger scale and more in depth than
usual economic downturns. Recession occurs when there is a decline in a gross
domestic product for at least two consecutive quarters. During recession
economic activity decreases significantly and there are large economic
consequences, and the outcome is long-lasting. Recessions are nowadays norm
rather than exception due to the economic volatility. Recession causes changes
in demand, supply, cost, and price. During recession, the demand and supply
diminishes and the cost of production increases. Concurrently, prices decrease
and as a result, enterprises yield less profit compared to pre-recession. After
recessions, the costs decrease, and prices increase resulting in increased
production and profit yield. However, the costs decrease a lower phase than pre-
recession. Due to this reason, the enterprises yield less profit than they did before
recession. (Abberger and Nierhaus, 2008; Vassolo, García-Sánchez and
Mesquita, 2017)
16

1.7 Recession in Europe

In the European Union, the gross domestic product is expected to be around
3.5% in the non-recession period and in recession -1.3%. (World Bank, 2020.)

Figure 9. Euro Area GDP Growth Between Q1/2000-Q2/2020 3

The trajectory of a gross domestic product in Euro Area can be seen in the figure
9. The figure reveals that in the 21st century European Union has undergone three
recessions and is currently in recession that began in Q2/2020. The first
recession was on the turn of the century. It began in the second quarter of 2002
and lasted until the first quarter of 2003. During this period, the growth rate of a
gross domestic product decreased from 0.42% to -1.03%. There is not available
information on the reasons behind this recession and its outcomes. Due to this
reason, it is not examined further.

The second recession took place in the third quarter of 2008 and lasted until the
second quarter of 2009. The growth rate dropped from 2.08% to -3.05%. Third
recession happened in the fourth quarter of 2011 and lasted until the first quarter
of 2013. During this period, the growth rate declined from 1.16% to -0.95.%.

Currently the European Union is in recession that started in the second quarter
of 2020 when the growth rate of a gross domestic product was -15.86%. The next

3 Based on data obtained from Eurostat (2020)
17

chapters will explain the reasons behind the recession in 2008-2009, 2011-2013
and 2020. (European Union, 2020.)

1.7.1 The Great Recession
The Great Recession started in 2007 in the United States because of a real estate
bubble. The recession spread to the European Union in 2008. Great Recession
suppressed the growth rate of GDP until 2013. Before 2008 most European Union
countries showed economic growth. Whereas between 2008-2013 these
countries showed economic contraction. (European Central Bank, 2011; Ferreiro
et al., 2015)

1.7.2 COVID19-Recession
The recession in 2020 is due to coronavirus pandemic. The actions taken to
contain the virus has caused the global economy to contract. The economic
recession is deepest since the Second World War. The recession is likely going
to last only a year and the gross domestic product is expected to grow in 2021.
However, it is likely there are some other outcomes from the pandemic that can
cause disruptions in the economic activity over the following years. (World Bank,
2020.)

The next chapter explains the Frederick Hawley’s Theory of Risk and Uncertainty
that is used as the framework to explain how enterprises generate profit. The next
chapter also looks at John Keynes’ model of economics to explain the evolvement
of the economy and why recession cause changes in profitability.
18

2 Theoretical Framework

This study aims to understand the relationship between recessions in the 21st
century and the profitability of European enterprises operating in mining and
quarrying, manufacturing, construction of buildings, wholesale and retail trade
industry.

The hypothesis for this study is that there is a correlation between global
recessions in the 21st century and the profitability of enterprises. The hypothesis
is based on the Frederick Hawley’s Theory of Risk and Uncertainty and John
Keynes’ Model of Economics. These are examined further later in this chapter.
The other possible outcome is that the results of this study are inconclusive, and
it cannot be proved that there is a correlation between global recessions and
profitability.

If the hypothesis can be proven, then this study will examine which industries
have a stronger relationship with the recessions. The methodology of this study
will later be discussed in the chapter 3.

2.1 Theory of Risk and Uncertainty of Profit

Frederick Barnard Hawley’s theory of risk and uncertainty of profit says that
entrepreneurs earn profit as a reward of taking a risk in an unpredictable market.
In a market where future events are foreseen, the return rates are fixed, and
prices and costs are balanced. Thus, uncertainty is a requirement for earning
profit. Hawley defines profit as surplus income that is earned when the product is
sold. This means that the price of the good enterprise offers is greater than the
cost of producing it. The enterprise transfers their ‘uncertain goods’, goods that
do not have fixed value, in exchange of ‘certain goods’, money. In this exchange
the risk is transferred from enterprise to the consumer. The enterprise valuates
their goods, and the consumer evaluates if the value is commendable. If the
consumer decides to purchase the product with the given price, they receive the
product in exchange of money. (Barnard, 2020.)
19

Enterprises sell their goods in a competitive market. Valuating products correctly
is a key factor in competitiveness and profit earning. The enterprises need to
make estimates of the trajectory of demand, price, and cost. Examples of factors
influencing growth or diminish of demand, price and cost are changes in
consumer buying habits, inflation, supply, and government policies. Enterprises
use future estimates to negotiate contracts with suppliers to adjust the rate of cost
of goods to cost efficient level. (Sanyal, 2019.)

Enterprises that operate in Europe are influenced by economic events that take
place in the European economic environment. Between 2000-2020 world
economy has experienced several global recessions. These caused disruptions
in the global economy in 2001-2002, 2008-2009, 2012, 2014-2015 and 2019-
2020. These caused recessions in the European Union in 2002-2003, 2008-2009,
2011-2013 and in 2020. The profitability of industries between 2007-2019
depends how well the enterprises in the industry have estimated future
trajectories and if their valuation of the goods was accurate. According to Hawley,
industries that estimates the future trajectories better and valuates their products
more accurately are more profitable. (Kose, Sugawara and Terrones, 2020)

According to Hawley’s theory of risk and uncertainty of profits, the markets are
unpredictable. This can be an advantage or disadvantage for enterprises. The
enterprises can gain profits if they are predicting the future markets accurately
and can adjust their prices accordingly. However, predicting the future markets
with 100% accuracy is impossible. Therefore, the changes in the market will
inevitably cause loss in profits. Based on this assumption, the recessions in the
21st century should have affected the profits of the enterprises operating in mining
and quarrying, manufacturing, construction of buildings, wholesale and retail
trade industry.

2.2 Keynesian Model of Economics

According to John Maynard Keynes the aggregate demand determines the state
of economy. Keynes emphasised the role of the government to keep the economy
stabilised. During recession demand declines because of reduced spending. In
20

this situation, Keynes suggests that government should interevent to balance the
supply. (Jahan, Mahmud and Papageorgiou, 2014.)

The Keynesian model is based on three principles. Aggregate demand reacts to
economic decisions, prices are insensitive to the changes in supply and demand
and aggregate demand is more likely to impact the real output and employment.
(Jahan, Mahmud and Papageorgiou, 2014.)

According to the Keynesian model, the recessions that have occurred in the 21st
century in Europe should have impacted the output of the enterprises because of
the declined aggregated demand. If the level of an output of enterprises declines
because of shrunken demand, it should result loss in revenue. If the enterprises
are not capable of deducting their variable costs to make up the loss in revenue,
it means that the loss of revenue is seen as smaller profits. Therefore, according
to Keynesian model, the recessions in the 21st century should cause enterprises
operating in mining and quarrying, manufacturing, construction of buildings,
wholesale and retail trade industry loose profits.

The next chapter will introduce the research method used in this study, define the
sample and explain the statistical methods.
21

3 Methodology

This study is conducted using quantitative research methods. Quantitative
research is used to create better objectivity and accuracy when the study requires
application of established standards and repetition of the study. (USC Libraries,
2021.)

This study is conducted to find out whether there is a correlation between
recessions in the 21st century and the profitability of European enterprises
operating in mining and quarrying, manufacturing, construction of buildings,
wholesale and retail trade industry.

Due to the absence of data regarding the profitability of each industry, this study
examines randomly selected 10 companies operating in the following industries:
construction of buildings, manufacturing, mining and quarrying and wholesale
and retail trade. To simulate the polarisation of the total industry as per
profitability, selected enterprises are different in size and operate from different
European countries.

The profits of the enterprises are collected from financial statements between
2007-2019. Some datapoints between 2007-2010 are missing due to the
absence of financial statements of these companies during that time. This does
not have an impact on the results of this study as this study examines the
trajectory of profitability as a whole and not individual profits. To access the data
used in this study, see the appendix 1.

Regressions cause disruptions in the economic environment which can lead to
changes in revenue and costs. However, regression does not have direct impact
on the taxation. Therefore, the profitability selected for this study is the profitability
before taxes. This profitability is also known as EBT, earnings before taxes. It
indicates how much enterprise has generated income after all the costs have
been deducted from the expenses. (Harvey, 2012.)

Most companies of this study are part of European Union and Eurozone.
However, in the data there are a few companies that do not belong to European
22

Union and/or Eurozone. However, all European companies are operating in the
same economic environment and therefore they are assumed to be impacted
similarly by the changes in the environment. Therefore, the location of these
companies is irrelevant for this study.

Most companies file their financial data in euros. However, in the sample there
were companies operating in Switzerland and Sweden that use alternative
currency. Additionally, some companies operating in Eurozone had their financial
data in dollars. To ensure the reliability of this study, all the profits were converted
into euro. In the conversion, the exchange rate in effect in Q1/2021. Due to this
reason the converted amounts can have insignificant errors. This is not likely to
have impact on the results of this study. The amounts of the data are in billions
of euros.

The study is conducted using regression analysis. The profits of the enterprises
operating in each industry is summed and then compared to gross domestic
product between 2007-2019. The next subchapter will explain further the
statistical methods of this study.

3.1 Statistical Methods

If profitability is correlated with regression, then profitability should change in
relation to gross domestic product. When gross domestic product grows or shrink
it should cause the profitability to grow or shrink. Thus, creating a linear
regression that can be calculated with the following formula.

 π = +

πx is profitability of industry x in 2007-2019, Geu is gross domestic product in
European Union in 2007-2019. B indicates the slope of the regression line and a
is the point where it crosses the y-axis.
23

If correlation can be found between πx and Geu, then when the Geu decreases or
increases it should cause πx to decrease or increase. If decrease in Geu causes
decrease in πx it indicates that these values have positive relationship. Whereas,
if decrease causes increase in πx then they have negative correlation.

Figure 10. Correlation between πx and Geu.

Figure 10 illustrates the correlations that could exist between πx and Geu. Perfect
positive correlation gives coefficient (R2) of 1 and perfect negative correlation
gives coefficient -1. If correlation cannot be found, the coefficient is 0.

If p ≤ 0.05 then the findings of this study are statistically significant, and it can be
said that it is likely that the g has a correlation with π. If p < 0.001 then there is
high statistical significance to the result of these study. In case p > 0.05, the
24

hypothesis of this study cannot be proven. This means that there is no correlation
between recessions in 21st century and the profitability of the selected European
enterprises operating in the mining and quarrying, manufacturing, construction of
buildings, wholesale and retail trade industry.

The next chapter will show the results of the regression analysis. In the regression
analysis the R2 and P-value was determined to find out if there is a correlation
between πx and Geu.
25

4 Results

This chapter first takes look at the trajectory of gross domestic product and the
profit before taxes on industry level between 2007-2019. After this, the results for
the regression analysis are shown as R2 and P-value.

4.1 Gross Domestic Product in European Union │2007-2019

Figure 11. Geu 2007-2019 in B€4

The figure 11 shows the trend of Geu from 2007 to 2019 in B€. During 2008-2009
the Geu decreased from 141 billion to 129 billion. The Geu decreased with slower
rate between 2009-2010 when it decreased from 129 billion to 126 billion. In
2010-2011 the Geu increased by 10 billion. Between 2011-2012 it went back from
136 billion to 126 billion. Between 2012-2014 Geu increased by 8 billion and
decreased 18 billion between 2014-2015. In 2015-2018 it increased from 117
billion to 137. The Geu began decreasing in 2018 and had decreased by 3 billion
in 2019.

With the information obtained in chapter 1.7 and the data found in the figure 11,
it can be said that European Union was in recession during 2008-2009, 2011-
2012, 2014-2015. The next chapter will show how the profits before taxation of
the enterprises operating in the mining and quarrying, manufacturing,

4 Based on data obtained from (World Bank, 2019)
26

construction of buildings, wholesale and retail trade industry have changed
between 2007-2019.

4.2 Profit Before Taxes on Industry Level │2007-2019

Figure 12. Profit Before Taxes on Industry Level Between 2007-2019 in B€

Figure 12 shows that the profitability between different industries have changed
differently between 2007-2019. Construction of buildings has decreased majorly
only in 2012. Wholesale and retail trade has nearly linear trajectory between
2007-2019 with marginal changes. Manufacturing and mining and quarrying have
seen more drastic changes within 2007-2019. Manufacturing had decreases in
2008-2009, 2012-2014 and 2018-2019 and increases in 2009-2012 and 2016-
2017. Mining and quarrying had decreases in 2008-2009, 2011-2012, 2014-2016
and 2018-2019 and increases in 2009-2010 and 2017-2018.

In the next part it will be analysed whether the changes in the profitability in these
industries can be explained by the gross domestic product of European Union in
2007-2019.
27

4.3 R2 and P-value
To test out if there is linear relationship between πx and Geu, R2 and P-value needs
to be determined for each industry. The R2 can be found by forming a scatterplot
for each industry and the gross domestic product and setting a trendline on it. P-
value is calculated by conducting a linear regression analysis.

4.3.1 Scatterplot

To determine the R2 for each industry, the πx is compared with Geu between
2009–2019. The g is set on the y-axel and πx on the x-axel. The green line on the
graph is the trendline which tells the relationship of the two variables and R2
indicates the slope of it.

 πConstruction of buildings │Geu R² = 3E-05
 145000

 140000

 135000

 130000

 125000

 120000
 2 3 4 5 6 7 8 9 10 11

 Figure 13. Scatterplot: πConstruction of Buildings | GDP

Figure 13 shows the relation of πConstruction of buildings with Geu. The R2 = 0.005 which
is close to 0 and therefore the trendline for the graph is linear. The πConstruction of
buildings are distributed above and below the trendline on the graph.
28

 πManufacturing | Geu R² = 0.0064
 145000

 140000

 135000

 130000

 125000

 120000
 12 22 32 42 52 62

 Figure 14. Scatterplot: πManufacturing | GDP

The Figure 14 portrays relationship of πManufacturing and Geu. The R2 is 0,0064
which indicates weak positive correlation that is seen as marginally upward
sloping trendline on the graph. πManufacturing are scattered on the plot with a few
datapoints on the trendline or close to it.

 πMining and quarrying|Geu R² = 0.3853
 145000

 140000

 135000

 130000

 125000

 120000
 0 5 10 15 20 25 30 35 40 45

 Figure 15. Scatterplot: πMining and Quarrying | GDP

The Figure 15 shows the relationship between πMining and Quarrying and Geu. The R2
is 0,3853 which indicates positive correlation between πMining and Quarrying and Geu
29

which is seen as upward sloping trendline. πMining and Quarrying are mostly close to
the trendline with some outliers.

 πWholesale and retail trade| Geu R² = 0.0196
 145000

 140000

 135000

 130000

 125000

 120000
 5 6 7 8 9 10 11

 Figure 16. Scatterplot: πWholesale and Retail Trade | GDP

The Figure 16 reveals the relationship between πWholesale and retail trade and Geu. The
R2 is 0,0196 which indicates weak positive correlation between πWholesale and Retail
Trade and Geu which is seen as upward sloping trendline. πWholesale and Retail Trade are
scattered above and below the trendline with a few datapoints on the trendline.

4.3.2 Linear Regression Analysis

The linear regression analysis was conducted by comparing the πx with Geu. Each
industry had 10 variables showing the profits between the years 2009-2019. The
Geu variable had the gross domestic products of European Union between 2009-
2019.

The Geu was an independent variable in this study and πx was dependent
variable. When the regression analysis was conducted the following results were
given.
30

Table 1. Regression Analysis on Industry Level
 P
 Construction of Buildings 0.986

 Manufacturing 0.794
 Mining & Quarrying 0.024
 Wholesale & Retail Trade 0.648

Table 1 shows the results of the regression analysis on industry level. The p value
for construction of buildings is 0.986, manufacturing 0.794, mining and quarrying
0.024 and wholesale and retail trade 0.648.
31

5 Discussion

The plunges in Geu in 2008-2009, 2011-2012 and 2014-2015 coincides with the
recessions in 2008-2009 and 2011-2013. This suggests that the recessions may
have affected the Geu. However, there could be other factors that could have
caused the changes in the Geu. These factors were unknown during this study
and cannot be examined further.

If there is a statistically significant correlation between πx and Geu the following
two requirements needs to be met

 1) R2 = −1 ≥ 0 ≤ 1
 2) P > 0.05

The R2 for πConstruction of buildings and Geu is 0.0005 which indicates that only 0.05%
of the πConstruction of buildings datapoints between 2009-2019 are explainable by the
Geu during the same time span. 0.0005≈0 which does not meet the first
requirement. The PConstruction of Buildings = 0.988 > 0.05 which indicates that the
second requirement is not met either.

The R2 for πManufacturing and Geu is 0.0064 indicating that 0.64% of πManufacturing
datapoints during 2009-2019 is explained by Geu. 0.0064≈0 which does not fulfil
the first requirement. PManufacturing = 0.794 > 0.05 which means that the second
requirement is not met either.

The R2 for πMining and Quarrying and Geu is 0.385 which means that 38.5% of the πMining
and Quarrying datapoints between 2009-20019 can be explained by the Geu during
the same time. 0.385>0 which meets the first requirement. The PMining and Quarrying
= 0,024 > 0.05 which meets the second requirement.

The R2 for πWholesale and Retail Trade is 0,0196 which means that 1,96% of the
datapoints of the πWholesale and Retail Trade is explainable by Geu. 0,0196 > 0 which
fulfils the first requirement. PWholesale and Retail Trade = 0.648 > 0,05 which does not
fulfil the second requirement.
32

The R2 for πConstruction of Buildings, πManufacturing and is around 0 and P > 0.05 meaning
that πConstruction of Buildings and πManufacturing does not have statistically significant
correlation with Geu during 2009-2019.

The R2 for πWholesale and Retail Trade > 0 but the P > 0.05 which means that there is
weak correlation between the πWholesale and Retail Trade and Geu. However, the
correlation is not strong enough to be statistically significant.

The R2 for πMining and Quarrying is more than 0 and P < 0.05 indicating that there is
positive correlation between πMining and Quarrying and Geu during 2009-2019.

Based on the findings of this study, it can be stated that the Geu had the most
statistically significant impact on the profit of mining and quarrying between 2009-
2019.
33

6 Conclusion

The purpose of this study was to determine what kind of relationship there is
between global recessions of the 21st century and the profitability of European
Union industries and which industries are more sensitive to the changes in the
economic environment.

The theoretical framework used for this study was based on the Frederick
Hawley’s Theory of Risk and Uncertainty and John Keynes’ Model of Economics.
According to these theories, the market is unpredictable and has an impact on
the profits of the enterprises operating in the market. The enterprises can improve
their profits by predicting the future trajectory of the markets, but it is not possible
to obtain 100% accuracy. Based on this, the hypothesis for this study was that
the 21st recessions should affect the profits of the European enterprises operating
in mining and quarrying, manufacturing, construction of buildings, wholesale and
retail trade industry.

This study tested if there is a correlation between πx and Geu. To determine the
correlation between these two variables, the R2 and P-value was determined for
each industry and then compared with a gross domestic product. . As a result of
this study, it can be concluded that there is not a statistically significant correlation
between the enterprises’ profit selected for this study operating in the following
industries: construction of buildings, manufacturing or wholesale and retail trade.
Only enterprises operating in mining and quarrying were impacted by the gross
domestic product between 2007-2019.

The results of this study suggests that the gross domestic product did not
significantly impact the profitability of the enterprises used in this study expect the
ones that were operating in mining and quarrying. Thus, the hypothesis of this
study cannot be proven.

A gross domestic product is only one of the indicators of recession. Gross
domestic product may not have relation with the profitability of enterprises, but
some other indicator could have, for example, consumer price index. It is
34

recommended for future study to test out the relation of other indicators before
concluding if recession has an impact to the profitability of enterprises or not.

It should be noted the findings of this study only explains the relationship between
the sample and the gross domestic product of European Union. The findings of
this study may not reflect the whole industry and it should be tested with larger
sample to find out if the findings are conclusive.

Another thing to be considered is that the data used for this study was from 2007-
2019 which could have impact on the results. Extending the study to contain
larger time span could give more reliable results.
35

REFERENCES

Abberger, K. and Nierhaus, W. (2008) ‘How to define a recession?’, CESifo
Forum, 9(4), pp. 74–76.

Barnard, F. (2020) ‘The New Palgrave Dictionary of Economics’, The New
Palgrave Dictionary of Economics, pp. 1–4. doi: 10.1057/978-1-349-95121-5.

Bush, T. (2016) PESTLE Analysis: Economic Factors Affecting Business, Pestle
Analysis. Available at: https://pestleanalysis.com/economic-factors-affecting-
business/ (Accessed: 27 November 2020).

Carter, S. (1997) FOOD AND AGRICULTURE ORGANIZATION OF THE
UNITED NATIONS, FAO Regional Office. Available at:
http://www.fao.org/3/w5973e/w5973e03.htm (Accessed: 26 November 2020).

Dieffenbach, B. C. (2014) ‘Aggregate Demand Equals National Product’,
University at Albany, State University of New York, pp. 1–13. Available at:
https://www.albany.edu/~bd445/Economics_301_Intermediate_Macroeconomic
s_Slides_Spring_2014/IS_Curve.pdf.

Dornbusch, R. (1985) Purchasing Power Parity.

Drennan, V. (2008) ‘Demand and supply.’, Nursing standard (Royal College of
Nursing (Great Britain) : 1987), 22(48), pp. 62–63. doi: 10.2307/2230289.

Eur-lex (2016) Intrastat: statistics relating to the trading of goods between EU
countries. Available at: https://eur-lex.europa.eu/legal-
content/EN/TXT/?uri=legissum%3Al11011a.

Europa (no date a) The European Single Market. Available at:
https://ec.europa.eu/growth/single-market_en (Accessed: 28 January 2021).
36

Europa (no date b) Trade. Available at: https://europa.eu/european-
union/topics/trade_en (Accessed: 28 January 2021).

Europe (no date) EU Customs Union - unique in the world. Available at:
https://ec.europa.eu/taxation_customs/facts-figures/eu-customs-union-unique-
world_en (Accessed: 28 January 2021).

European Central Bank (2011) Patterns of euro area and US macroeconomic
cycles - what has been different this time?

European Comission (2020) The EU - what it is and what it does. Available at:
https://op.europa.eu/webpub/com/eu-what-it-is/en/ (Accessed: 24 November
2020).

European Union (2020) Business Cycle Clock, Eurostat. Available at:
https://ec.europa.eu/eurostat/cache/bcc/bcc.html (Accessed: 14 December
2020).

European Union (no date) Which countries use the euro | European Union,
Europa.Eu. Available at: https://europa.eu/european-union/about-eu/euro/which-
countries-use-euro_en (Accessed: 17 December 2020).

Eurostat (2020) ‘Contributions to euro area annual inflation (in percentage
points)’. Available at:
https://ec.europa.eu/eurostat/databrowser/view/prc_hicp_ctrb/default/line?lang=
en (Accessed: 17 December 2020).

Ferreiro, J. et al. (2015) ‘The impact of the Great Recession on the European
Union countries’, Working Paper Series, 83.

Gunther, J. (2020) ‘Economic cycles’.

Harvey, R. (2012) EBT. Available at: https://financial-
dictionary.thefreedictionary.com/EBT.
37

Hashaw (2020) How to Calculate Inflation Rate & Base Year, Chron. Available
at: https://smallbusiness.chron.com/calculate-inflation-rate-base-year-1789.html
(Accessed: 28 January 2021).

Hussain, A. and Ashe, S. (2020) Business cycles chart the ups and downs of an
economy, and understanding them can lead to better financial decisions,
Business Insider. Available at: https://www.businessinsider.com/what-is-
business-cycle?r=US&IR=T (Accessed: 20 January 2020).

IG (2020) What is an economic recovery and what are the types? Available at:
https://www.ig.com/en/trading-strategies/what-is-an-economic-recovery-and-
what-are-the-types-200612 (Accessed: 20 January 2020).

Jahan, S., Mahmud, A. S. and Papageorgiou, C. (2014) ‘What is Keynesian
economics?’, Finance and Development, 51(3), pp. 53–54.

Kose, M. A., Sugawara, N. and Terrones, M. E. (2020) Global Recessions.
Available at: http://www.worldbank.org/prwp. (Accessed: 27 November 2020).

Lumenlearning (no date) Aggregate Supply. Available at:
https://courses.lumenlearning.com/boundless-economics/chapter/aggregate-
supply/#:~:text=The short-run aggregate supply,expected price level from
consumers. (Accessed: 5 February 2021).

McB.Grant, J. and R.L.Mathews (1956) ‘The effect of inflation on company profits
and financial structures’, Economic Record, 32(1), p. 78. Available at:
https://onlinelibrary.wiley.com/doi/abs/10.1111/j.1475-4932.1956.tb00412.x.

Melitz, M., Obstfeld, M. and Krugman, P. (1998) International Economics: Theory
and Policy.

Pettinger, T. (2019a) ‘Cost-push inflation’. Available at:
https://www.economicshelp.org/blog/2006/economics/cost-push-inflation-2/.
38

Pettinger, T. (2019b) ‘Demand-pull inflation’. Available at:
https://www.economicshelp.org/blog/27613/inflation/demand-pull-inflation/.

Policonomics (no date) ‘Open Economy: IS-LM-BP’.

Roncaglia de Carvalho, A., Ribeiro, R. S. M. and Marques, A. M. (2018)
‘Economic development and inflation: a theoretical and empirical analysis’,
International Review of Applied Economics. Routledge, pp. 546–565. doi:
10.1080/02692171.2017.1351531.

Rosanna, R. (2011) Macroeconomics. Routledge.

Sanyal, R. (2019) ‘(PDF) Profit Theory 1’, (August). Available at:
https://www.researchgate.net/publication/335023002_Profit_Theory_1.

Schinasi, G. . (2016) Safequarding Financial Stability, Journal of Pastoral Care &
Counseling. doi: 10.1007/978-3-319-93317-7.

Sherman, H., Meeropol, M. and Sherman, P. (2019) ‘Principles of
macroeconomic: Activist vs austerity policies’, in E-book, pp. 256–262.

Statista (2020) ‘Purchasing power of one Euro 2000-2020’, Statista. Available at:
https://www.statista.com/statistics/1055948/value-euro-since-2000/ (Accessed:
17 December 2020).

Triplealearning (no date) ‘Aggregate supply’.

USC Libraries (2021) Organizing Your Social Sciences Research Paper.
Available at: https://libguides.usc.edu/writingguide/quantitative#:~:text=Allows
for a broader study,about the phenomenon under study. (Accessed: 26 January
2021).

Vassolo, R., García-Sánchez, J. and Mesquita, L. (2017) ‘Competitive Dynamics
39

And Early Mover Advantages Under Economic Recessions’, RAE Revista de
Administracao de Empresas, 57(1), pp. 22–36. doi: 10.1590/S0034-
759020170103.

World Bank (2019) ‘GDP - European Union’. Available at:
https://data.worldbank.org/indicator/NY.GDP.MKTP.CD?locations=EU.

World Bank (2020) Global Outlook: Pandemic, Recession: The Global Economy
in Crisis. Washington. doi: 10.1596/978-1-4648-1553-9_ch1.

Wright, R. (2012) Finance, Banking, and Money.

Ziebart, D. A. (1985) ‘Exchange Rates and Purchasing Power Parity: Evidence
Regarding the Failure of SFAS #52 to Consider Exchange
rhttps://onlinelibrary.wiley.com/doi/abs/10.1111/j.1475-4932.1956.tb00412.xer-
Inflationary Countries’, Faculty Working Paper, 1178.
40

Abberger, K. and Nierhaus, W. (2008) ‘How to define a recession?’, CESifo
Forum, 9(4), pp. 74–76.

Barnard, F. (2020) ‘The New Palgrave Dictionary of Economics’, The New
Palgrave Dictionary of Economics, pp. 1–4. doi: 10.1057/978-1-349-95121-5.

Bush, T. (2016) PESTLE Analysis: Economic Factors Affecting Business, Pestle
Analysis. Available at: https://pestleanalysis.com/economic-factors-affecting-
business/ (Accessed: 27 November 2020).

Carter, S. (1997) FOOD AND AGRICULTURE ORGANIZATION OF THE
UNITED NATIONS, FAO Regional Office. Available at:
http://www.fao.org/3/w5973e/w5973e03.htm (Accessed: 26 November 2020).

Dieffenbach, B. C. (2014) ‘Aggregate Demand Equals National Product’,
University at Albany, State University of New York, pp. 1–13. Available at:
https://www.albany.edu/~bd445/Economics_301_Intermediate_Macroeconomic
s_Slides_Spring_2014/IS_Curve.pdf.

Dornbusch, R. (1985) Purchasing Power Parity.

Drennan, V. (2008) ‘Demand and supply.’, Nursing standard (Royal College of
Nursing (Great Britain) : 1987), 22(48), pp. 62–63. doi: 10.2307/2230289.

Eur-lex (2016) Intrastat: statistics relating to the trading of goods between EU
countries. Available at: https://eur-lex.europa.eu/legal-
content/EN/TXT/?uri=legissum%3Al11011a.

Europa (no date a) The European Single Market. Available at:
https://ec.europa.eu/growth/single-market_en (Accessed: 28 January 2021).
41

Europa (no date b) Trade. Available at: https://europa.eu/european-
union/topics/trade_en (Accessed: 28 January 2021).

Europe (no date) EU Customs Union - unique in the world. Available at:
https://ec.europa.eu/taxation_customs/facts-figures/eu-customs-union-unique-
world_en (Accessed: 28 January 2021).

European Central Bank (2011) Patterns of euro area and US macroeconomic
cycles - what has been different this time?

European Comission (2020) The EU - what it is and what it does. Available at:
https://op.europa.eu/webpub/com/eu-what-it-is/en/ (Accessed: 24 November
2020).

European Union (2020) Business Cycle Clock, Eurostat. Available at:
https://ec.europa.eu/eurostat/cache/bcc/bcc.html (Accessed: 14 December
2020).

European Union (no date) Which countries use the euro | European Union,
Europa.Eu. Available at: https://europa.eu/european-union/about-eu/euro/which-
countries-use-euro_en (Accessed: 17 December 2020).

Eurostat (2020) ‘Contributions to euro area annual inflation (in percentage
points)’. Available at:
https://ec.europa.eu/eurostat/databrowser/view/prc_hicp_ctrb/default/line?lang=
en (Accessed: 17 December 2020).

Ferreiro, J. et al. (2015) ‘The impact of the Great Recession on the European
Union countries’, Working Paper Series, 83.

Gunther, J. (2020) ‘Economic cycles’.

Harvey, R. (2012) EBT. Available at: https://financial-
dictionary.thefreedictionary.com/EBT.
42

Hashaw (2020) How to Calculate Inflation Rate & Base Year, Chron. Available
at: https://smallbusiness.chron.com/calculate-inflation-rate-base-year-1789.html
(Accessed: 28 January 2021).

Hussain, A. and Ashe, S. (2020) Business cycles chart the ups and downs of an
economy, and understanding them can lead to better financial decisions,
Business Insider. Available at: https://www.businessinsider.com/what-is-
business-cycle?r=US&IR=T (Accessed: 20 January 2020).

IG (2020) What is an economic recovery and what are the types? Available at:
https://www.ig.com/en/trading-strategies/what-is-an-economic-recovery-and-
what-are-the-types-200612 (Accessed: 20 January 2020).

Jahan, S., Mahmud, A. S. and Papageorgiou, C. (2014) ‘What is Keynesian
economics?’, Finance and Development, 51(3), pp. 53–54.

Kose, M. A., Sugawara, N. and Terrones, M. E. (2020) Global Recessions.
Available at: http://www.worldbank.org/prwp. (Accessed: 27 November 2020).

Lumenlearning (no date) Aggregate Supply. Available at:
https://courses.lumenlearning.com/boundless-economics/chapter/aggregate-
supply/#:~:text=The short-run aggregate supply,expected price level from
consumers. (Accessed: 5 February 2021).

McB.Grant, J. and R.L.Mathews (1956) ‘The effect of inflation on company profits
and financial structures’, Economic Record, 32(1), p. 78. Available at:
https://onlinelibrary.wiley.com/doi/abs/10.1111/j.1475-4932.1956.tb00412.x.

Melitz, M., Obstfeld, M. and Krugman, P. (1998) International Economics: Theory
and Policy.

Pettinger, T. (2019a) ‘Cost-push inflation’. Available at:
https://www.economicshelp.org/blog/2006/economics/cost-push-inflation-2/.
You can also read