Spatial and temporal analysis of the mid-summer dry spells for the summer rainfall region of South Africa - Water SA
←
→
Page content transcription
If your browser does not render page correctly, please read the page content below
Water SA 47(1) 76–87 / Jan 2021                                                                                                       Research paper
https://doi.org/10.17159/wsa/2021.v47.i1.9447

Spatial and temporal analysis of the mid-summer dry spells for the summer rainfall
region of South Africa
MG Mengistu1,2, C Olivier1, JO Botai1,2,3, AM Adeola1,3,4 and S Daniel1,2
1
 South African Weather Service, Private Bag X097, Centurion, South Africa
2
 School of Agricultural, Earth and Environmental Sciences, University of KwaZulu-Natal, Pietermaritzburg, South Africa
3
 Department of Geography, Geoinformatics and Meteorology, University of Pretoria, Pretoria, South Africa
4
 UP Institute for Sustainable Malaria Control, School for Health Systems and Public Health, University of Pretoria, Pretoria, South Africa

                                                                                                                        CORRESPONDENCE
    South Africa is frequently subjected to severe droughts and dry spells during the rainy season. As such, rainfall   MG Mengistu
    is one of the most significant factors limiting dryland crop production in South Africa. The mid-summer
    period is particularly important for agriculture since a lack of rain during this period negatively affects crop    EMAIL
    yields. Dry spell frequency analyses are used to investigate the impacts of sub-seasonal rainfall variability       Michael.Mengistu@weathersa.co.za
    on crop yield, since seasonal rainfall totals alone do not explain the relationship between rainfall and crop       mgmengistu@gmail.com
    yields. This study investigated the spatial and temporal occurrences of the mid-summer dry spells based on
    magnitude, length and time of occurrence in the major maize growing areas of the summer rainfall region             DATES
    of South Africa. Three thresholds of 5 mm, 10 mm, and 15 mm total rainfall for a pentad were used for the           Received: 11 October 2019
                                                                                                                        Accepted: 15 December 2020
    analysis of dry spells. Dry spell analysis showed that dry pentads occur during mid-summer with differing
    intensity, duration and frequency across the summer rainfall region. Annual frequency of dry pentads for the
                                                                                                                        KEYWORDS
    mid-summer period ranged between 0 and 4 pentads for the 5 mm threshold and 1 to 7 for the 10 mm and                pentad rainfall
    15 mm thresholds. The non-parametric Mann-Kendall trend analysis of the dry pentads indicates that there            mid-summer
    is no significant trend in the frequency of dry spells at a 95% confidence level. The initial and conditional       dry spells
    probabilities of getting a dry spell using the Markov chain model also showed that there is a 32% to 80%            Markov chain model
    probability that a single pentad will be dry using the 15 mm threshold. There is a 5% to 48% probability            South Africa
    of experiencing two consecutive dry pentads and 1% to 29% probability of getting three consecutive dry
    pentads. The duration and intensity of dry spells, as well as the Markov chain probabilities, showed a decrease     COPYRIGHT
    in dry spells from west to east of the maize-growing areas of the summer rainfall region of South Africa.           © The Author(s)
                                                                                                                        Published under a Creative
                                                                                                                        Commons Attribution 4.0
INTRODUCTION                                                                                                            International Licence
                                                                                                                        (CC BY 4.0)
South Africa is a semi-arid country with mean annual rainfall totals below 500 mm (Taljaard, 1996).
In most parts of South Africa rainfall occurs during the austral summer months from October to
March (Harrison 1984; Hart et al., 2010). The most significant increase in rainfall over the summer
rainfall region starts in September along the southeast and east coast, then the increase in rainfall
spreads to the eastern interior parts in October extending to the western interior from October to
November (Taljaard, 1986). In December a break in the rising rainfall occurs over part of the summer
rainfall region (Taljaard, 1986). The other distinct rainfall regions over South Africa occur along
the southern coast of the country where rainfall occurs all year round (Engelbrecht et al., 2014), as
well as the south-western region which receives the majority of its rain during the winter months
(Reason et al., 2002).
Southern Africa summer rainfall experiences significant rainfall variability, with recurrent wet and
dry spells and severe droughts (Richard et al., 2001). Drought is a natural phenomenon that occurs
when there is a temporal imbalance of water availability due to a persistent lower than average
precipitation over a certain period of time (Pereira et al., 2009). Several studies in the past have
focused on the occurrence, intensity, impact and prediction of drought on an annual and seasonal
basis. However, dry spells are equally important to the agricultural sector, as the timing of the
occurrence and intensity of the dry period is more important than seasonal shortfalls in rainfall.
Usman and Reason (2004) highlighted that a season with above-average rainfall may not be better
than a below-average season over an agricultural region if the rainfall during the season is not well
distributed in space and time. Crops are more likely to do well with evenly distributed rains than
intermittent heavy showers interrupted by prolonged dry periods (Usman and Reason, 2004). Various
crops, such as maize, are vulnerable to dry spells during specific phenological stages (Tadross et al.,
2009; Mupangwa et al., 2011). Water stress is one of the major limiting factors in dryland (rainfed)
agriculture and its effects include stunted growth, delayed maturity and low crop productivity
(Mzezewa et al., 2010). The flowering stage of maize has been found to be the most sensitive stage to
water stress, for example, leading to reductions in crop growth, biomass production and finally yield
(Du Plessis, 2003; Masupha et al., 2016). Therefore, planting dates should be chosen to ensure that
this stage coincides with normally favourable growing conditions and does not coincide with mid-
summer drought periods (Du Plessis, 2003).
Rainfall has been identified as the most pressing and significant factor limiting dryland crop
production in South Africa. The mid-summer period is particularly important since a lack of rain

ISSN (online) 1816-7950                                                        76
Available on website https://www.watersa.net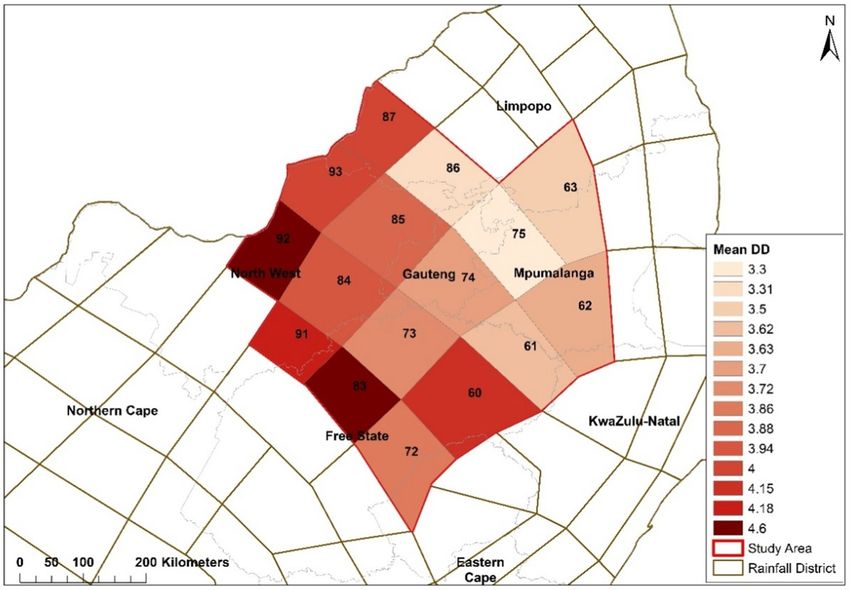
for even a few days during this period may decrease crop yields. pentad were used for the analysis of dry spells. This study aims to
Variability in seasonal rainfall totals alone may not explain the perform a detailed spatial and temporal analysis on the occurrence
relationship between rainfall and crop yields, hence dry spell of the mid-summer dry spells (MSD) based on magnitude, length
frequency analyses are used globally to investigate the implications and time of occurrence in the summer rainfall region of South
of sub-seasonal rainfall variability on food security (Usman and Africa.
Reason 2004). Dry spells are defined as extended periods with
no rainfall within a rainy season (Ngetich et al., 2014). Studies DATA AND METHODOLOGY
in semi-arid environments in Sub-Saharan Africa have indicated
Daily rainfall data from the South African Weather Service
that dry spells range between 5 and 15 days (Usman and Reason
(SAWS) data bank were used to investigate mid-summer dry
2004). It has been observed that in the summer rainfall region of
spells. Rainfall was measured at either individual rainfall stations
Southern Africa, there is a break in rainfall during mid-summer
or automatic weather stations (AWSs). As mentioned in Kruger
when the cyclonic (baroclinic) regime in early summer switches
and Nxumalo (2017), measurements at manual stations were
to a dominantly tropical (barotropic) system, characteristic of
done at 08:00 SAST and represent the accumulated rainfall over
late summer (Bhalotra, 1984). With the exception of a study
the preceded 24 hours, while AWS data represent the total rainfall
by Grobler (1993), little research has been devoted to dry spell
accumulated over the period from 08:00 SAST the previous day to
characteristics in South Africa.
08:00 SAST the current day. Only stations that were operational
The rainfall time-series is characterised by periods of wetness (wet throughout the study period were selected, with at least 90% of
spells) and dryness (dry spells). Therefore, a threshold for defining daily values available. In cases where zero rainfall was recorded
wet and dry days is required when analysing spells of rainfall, since for relatively long periods (a month or longer) when surrounding
the frequency distribution of the length of the spells is dependent stations recorded significant rainfall amounts, the data were
on the selected threshold (Bärring et al., 2006). Different thresholds flagged and removed (Kruger and Nxumalo, 2017).
have been used internationally based on the aspect of the spells
The summer period is defined as the 6-month period extending
that needed to be considered. Moon et al. (1994) and Matrin-Vide
from October to March. A map illustrating the South African
and Gomez (1999) have used 0.1 mm per day, Frei et al. (2003),
average rainfall totals over the period of October to March is
Douguedroit (1987), and Usman and Reason (2004) have used
depicted in Fig. 1. Climatological rainfall totals from October to
a threshold of 1.0 mm daily precipitation, Perzyna (1994) used a
March were calculated and related, as a percentage, to the annual
threshold of 2.0 mm per day, and Ceballos et al. (2004) have used
rainfall totals (defined here as June to May to capture the full
a threshold of 10 mm daily rainfall for wet and dry spell analysis.
October to March period). The study area receives 80% or more of
Reddy (1990) used a threshold of 3 mm per day, which is the
its total annual rainfall from October to March as shown in Fig. 1.
minimum rainfall depth threshold value for crops to satisfy their
Parts of the eastern coastal areas still receive significant rainfall
crop water requirement during a growing season.
during these months; however, they also receive rainfall during
In this study, a dry spell is defined as a period of 5 days (a pentad) winter and spring, lowering the overall percentage for October to
during which rainfall totals are less than predefined thresholds. March (NCAR, 2018). From the summer rainfall region, which
Three thresholds of 5 mm, 10 mm, and 15 mm total rainfall for a receives rain mostly during October to March (Fig. 1), only 16
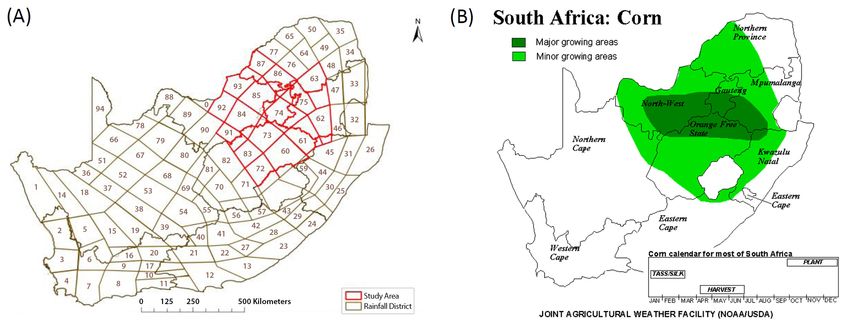
Figure 1. October to March rainfall totals compared with annual rainfall totals (1979–2018) using CPC unified gauge-based analysis of global
daily precipitation
Water SA 47(1) 76–87 / Jan 2021 77
https://doi.org/10.17159/wsa/2021.v47.i1.9447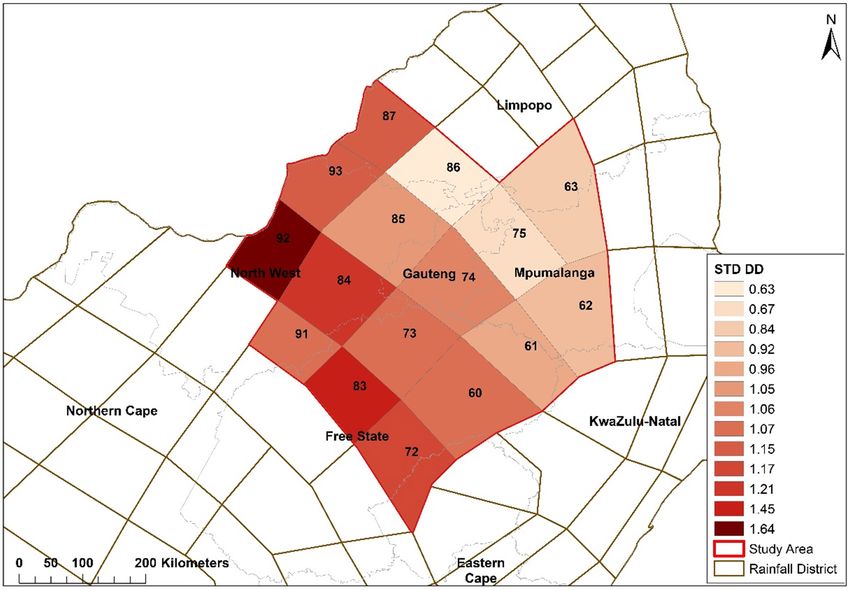
Figure 2. (A) Rainfall districts for South Africa with provincial borders (SAWB, 1972), showing the 16 selected districts with red polygons,
(B) A map showing maize-growing areas (AgWeb, 2015)

districts (Fig. 2A) with homogeneous rainfall and seasonality              a wet pentad, PDW is the probability of a dry pentad preceded
(Kruger, 2011) from the maize-growing areas (Fig. 2.B) were used           by a wet pentad, FDD is the number of dry pentads preceded by
for further analysis. From the daily district rainfall (Kruger and         another dry pentad, FWW is the number of wet pentads preceded
Nxumalo, 2017), pentad summations (totals) were calculated                 by another wet pentad, 2D is the probability of 2 consecutive dry
following the methodology used in Grobler (1993). Pentads                  pentads starting with a particular pentad, 2W is the probability
were calculated using Julian days; for example, Pentad 1 refers to         of 2 consecutive wet pentads starting with the pentad, 3D is the
January 1–5 and Pentad 73 refers to December 27–31. The extra              probability of 3 consecutive dry pentads starting with the pentad,
leap year day, 29 February, was added to the 10th pentad. Eight            3W is the probability of 3 consecutive wet pentads starting with
pentads between 12 December (start of Pentad 70) and 20 January            the pentad, PDp1 is the probability of the pentad being dry (first
(end of Pentad 4) were selected for detailed analysis of the mid-          pentad), PDDp2 is the probability of the second pentad being dry,
summer rainfall for the study area.                                        given the preceding pentad dry, PDDp3 is the probability of the
                                                                           third pentad being dry, given the preceding pentad dry, PWp1 is
Dry and wet spell analysis has been carried out using the Markov
                                                                           the probability of the pentad being wet (first pentad), PWWp2 is the
chain probability model for the threshold value of 3 mm rainfall
                                                                           probability of the second pentad being wet, given the preceding
depth per day (15 mm per pentad). A pentad with less than
                                                                           pentad wet, and PWWp3 is the probability of the third pentad being
15 mm rainfall was considered as a dry pentad and a pentad with
                                                                           wet, given the preceding pentad wet.
15 mm or more rainfall as a wet pentad. The Markov chain model
calculates the initial probabilities of getting a dry spell or wet spell
                                                                           RESULTS AND DISCUSSION
for a given pentad. The calculation of conditional probabilities
provides the information on the dry spell followed by dry or wet           Time-series analysis of mid-summer rainfall
spell and vice-versa. The calculations of initial and conditional
                                                                           Long-term mean monthly rainfall totals were plotted to check the
probabilities are given below.
                                                                           seasonality and rainfall variability for all selected districts from
Initial probability:                                                       the summer rainfall region. The district rainfall plots exhibited
                                                                           austral summer rainfall seasonality with mean monthly rainfalls
                        PD = FD / N                                 (1)
                                                                           peaking in December. Examples of the plots are presented in Fig. 3,
                        PW = FW / N                                 (2)    showing rainfall seasonality for 4 districts covering different
                                                                           maize-growing regions of the summer rainfall areas of South
Conditional probabilities:
                                                                           Africa.
                        PDD = FDD / FD                              (3)
                                                                           Most studies of mid-summer drought evaluate an already existing
                        PWW = FWW / FW                              (4)    climatological dry period within a typical summer season
                                                                           (Bhalotra, 1984; Karnauskas et al., 2013; Perdigón-Morales et al.,
                        PDW  1  PWW                               (5)
                                                                           2017). During this relatively dry period, precipitation is reduced
Consecutive dry and wet pentad probabilities                               by up to 40% and constitutes a clear signal of bimodal nature of the
                                                                           summer precipitation (Perdigón-Morales et al., 2017). However,
                        2D = PDp1PDDp2                              (6)
                                                                           this does not seem to be the case for the summer rainfall region of
                        2W = PWp1PWWp2                              (7)    central South Africa.
                        3D = PDp1PDDp2 PDDp 3                       (8)    Pentad rainfall distributions for the 16 district rainfall regions
                                                                           contained within the study area are presented in Fig. 4. Pentad
                          3W = PWp1PWWp2 PWWp3                      (9)
                                                                           rainfall distributions are clearly skewed towards the higher
where, PD is the probability of the pentad being dry, PW is the            rainfall totals. This is a common feature with sub-monthly rainfall
probability of the pentad being wet, N is the number of years of           totals (e.g. days and weeks, or in this case pentads). Rainfall totals
data, FD is the number of dry pentads, FW is the number of wet             for months and seasons tend to be less skewed compared to sub-
pentads, PDD is the probability of a dry pentad preceded by a              monthly rainfall totals. This justifies the reason for defining dry
dry pentad, PWW is the probability of a wet pentad preceded by             periods with thresholds for the dry spell analysis.

Water SA 47(1) 76–87 / Jan 2021                                                                                                              78
https://doi.org/10.17159/wsa/2021.v47.i1.9447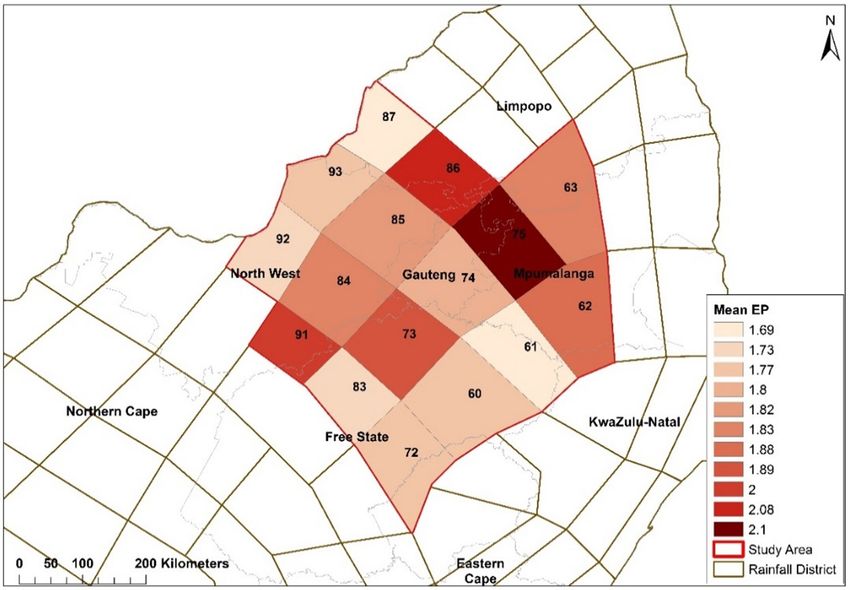
Figure 3. Rainfall seasonality for four different maize-growing regions of South Africa. The black line is the median, box covers the 1st and 3rd
quantile (25th and 75th percentiles), whiskers are 1.5 times the interquartile range and dots are outliers outside this range

Figure 4. Pentad rainfall distributions for the 16 district rainfall regions contained within the revised study area. The black line is the median, box
covers the 1st and 3rd quantile (25th and 75th percentiles), whiskers are 1.5 times the interquartile range and dots are outliers outside this range

Water SA 47(1) 76–87 / Jan 2021                                                                                                                    79
https://doi.org/10.17159/wsa/2021.v47.i1.9447
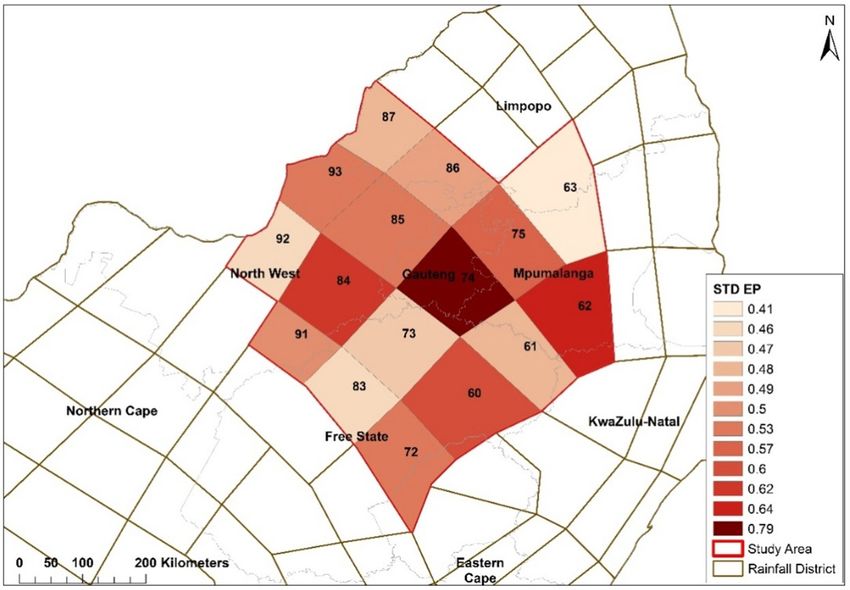
Figure 5. Pentad anomaly frequency below-average thresholds of 5 mm, 10 mm, and 15 mm for the eight pentads in December and January
covering the four different maize-growing regions of South Africa

Table 1. The non-parametric Mann-Kendall test of dry pentads using three thresholds for 16 homogeneous rainfall districts for the mid-summer
period (1985–2015)
 District                                                               Thresholds
                              > 5 mm                                      > 10 mm                                     > 15 mm
               Z-statistic Attained significance level   Z-statistic   Attained significance level   Z-statistic   Attained significance level
 60              −1.17                76%                  −0.68                  50%                  −0.65                  48%
 61              −0.64                48%                  −0.39                  30%                  −1.73                  92%
 62               0.06                 5%                   0.00                   0%                   0.91                  63%
 63               0.19                15%                  −0.63                  47%                  −0.53                  40%
 72              −1.38                83%                  −0.13                  10%                  −0.50                  38%
 73               0.00                 0%                   0.33                  26%                   0.35                  28%
 74              −0.25                19%                  −0.56                  43%                  −0.64                  48%
 75              −0.11                 9%                  −0.09                   8%                  −0.15                  12%
 83              −1.24                79%                  −1.31                  81%                  −0.75                  55%
 84              −0.02                 1%                   0.24                  19%                  −0.43                  33%
 85               1.21                77%                  −0.86                  61%                  −0.13                  10%
 86              −1.76                92%                  −1.43                  85%                  −0.57                  43%
 87              −0.02                 2%                   0.46                  36%                   0.24                  19%
 91              −1.81                93%                  −0.62                  47%                  −0.50                  38%
 92              −0.17                13%                   0.39                  30%                   0.53                  40%
 93              −1.18                76%                  −0.45                  35%                  −0.67                  50%

An analysis of total pentad rainfall for 8 pentads in December and        analysis was performed to investigate trends in the frequency of dry
January was done to investigate the deviation from the climatolog-        spells during the mid-summer period (Hipel and McLeod, 1994;
ical average of the number of dry pentads during the mid-summer           Libiseller and Grimvall, 2002). The trend analysis results for the
period. Anomalies of dry pentad frequency are presented in Fig. 5         16 districts are presented in Table 1 for the dry pentads during the
using the three thresholds for the period 1985 to 2015. Negative          mid-summer using the three thresholds. As presented in Table 1,
values indicate fewer dry pentads and positive values indicate more       there is no significant trend in the frequency of dry spells at a
dry pentads during the mid-summer period. Anomalies of dry                95% confidence level. However, District 61 showed a decrease in
pentad frequency plots for the four districts covering the different      15 mm pentad rainfall totals at a 92% confidence level. Districts
maize growing regions of the summer rainfall areas of South Africa        86 and 91 also have shown a decrease in 5 mm pentad rainfall
are shown in Fig. 5. The non-parametric Mann-Kendall trend test           totals at 92% and 93% confidence level, respectively.

Water SA 47(1) 76–87 / Jan 2021                                                                                                             80
https://doi.org/10.17159/wsa/2021.v47.i1.9447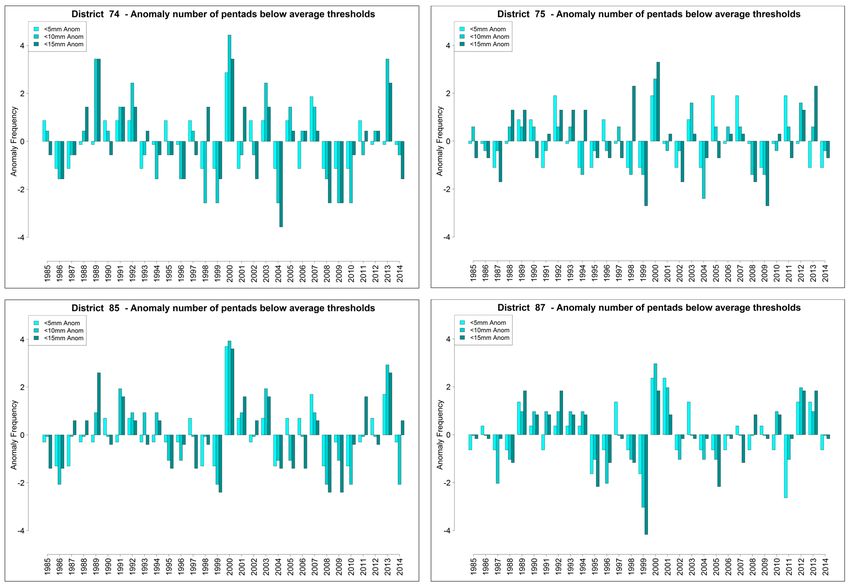
Boxplots of annual frequencies of dry pentads during the mid-              15 mm rainfall was considered as a dry pentad. The Markov chain
summer (December–January) using the three thresholds of 5 mm,              model calculates the initial probabilities of getting dry spell (PD),
10 mm and 15 mm are presented in Fig. 6. The bands inside the              conditional probabilities of dry spell followed by dry spell (PDD),
boxplots show the medians and the ends of the whiskers (vertical           two (2D) and three (3D) consecutive dry spells. Climatologically,
lines) represent the minimum and the maximum number of dry                 Districts 72, 83 and 93 show a higher likelihood of getting
pentads. The number of dry pentads was higher for District 87              consecutive dry spells than the other regions. Consecutive dry
compared to Districts 74, 75, and 85, as shown in Fig. 6, indicating       spells also seem more likely to occur during Pentads 73 and 1.
more dry pentads for all three thresholds for the 30-year period.          These results are in agreement with the findings of Grobler (1993),
The Markov chain probability model was used for dry spell                  who reported mid-summer dry spells for the study area which
analysis using a threshold value of 3 mm rainfall per day (15              lasted, on average, 7 to 14 days, occurring typically at the end of
mm per pentad), as presented in Table 2. A pentad with less than           December and the beginning of January.

Figure 6. The number of pentads with below-average thresholds of 5 mm, 10 mm, and 15 mm for the eight pentads in December and January
(1985–2015) covering the four different maize-growing regions of South Africa

Table 2. Markov chain results for the 16 rainfall districts contained in the study area for the mid-summer period (1985–2015) using a threshold
value of 3 mm rainfall per day (15 mm per pentad). (A) Probability for a single dry pentad – PD, (B) probability for dry pentad given the previous
pentad dry – PDD, (C) probability for two consecutive pentads being dry starting with the pentad − 2D, (D) probability for three consecutive
pentads being dry starting with the pentad − 3D
 District                                                                      Pentad
                     70                71           72              73                   1             2                3               4
                                                                      (A) PD
 60                51.60              45.20        38.70           61.30                61.30        51.60            61.30           54.80
 61                38.70              51.60        38.70           51.60                58.10        48.40            58.10           48.40
 62                38.70              41.90        35.50           45.20                51.60        32.30            45.20           32.30
 63                45.20              41.90        29.00           54.80                64.50        41.90            71.00           51.60
 72                77.40              67.70        54.80           61.30                71.00        64.50            51.60           51.60
 73                64.50              54.80        45.20           67.70                67.70        67.70            64.50           58.10
 74                41.90              45.20        29.00           41.90                51.60        48.40            61.30           41.90
 75                51.60              45.20        29.00           45.20                51.60        48.40            54.80           45.20
 83                77.40              64.50        45.20           74.20                77.40        71.00            74.20           67.70
 84                58.10              58.10        51.60           54.80                67.70        51.60            71.00           48.40
 85                48.40              61.30        48.40           61.30                71.00        45.20            61.30           41.90
 86                45.20              54.80        38.70           41.90                58.10        48.40            64.50           48.40
 87                64.50              61.30        54.80           71.00                74.20        51.60            67.70           67.70
 91                71.00              67.70        58.10           67.70                71.00        58.10            80.60           67.70
 92                71.00              61.30        64.50           61.30                77.40        54.80            71.00           54.80
 93                67.70              64.50        64.50           71.00                74.20        61.30            58.10           51.60

Water SA 47(1) 76–87 / Jan 2021                                                                                                               81
https://doi.org/10.17159/wsa/2021.v47.i1.9447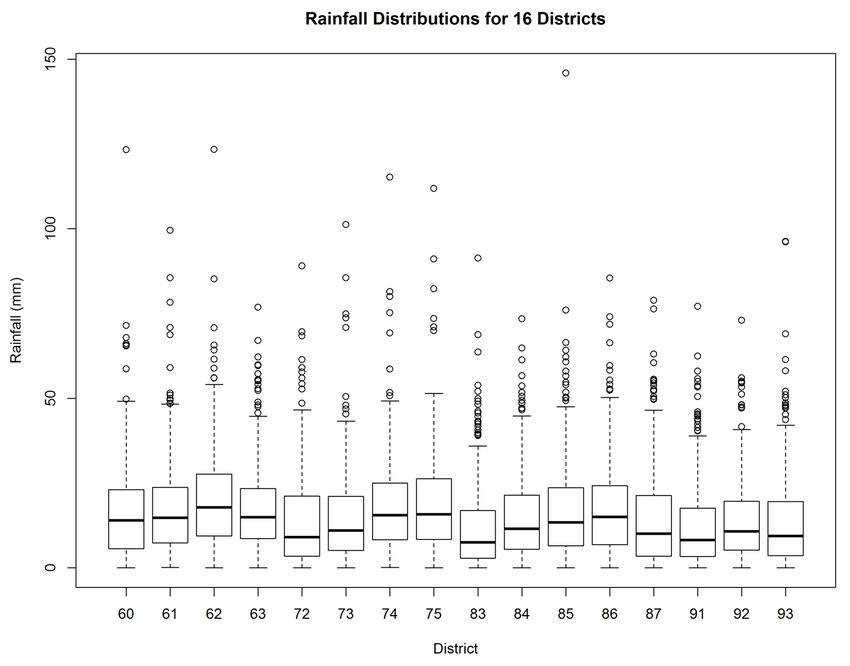
Table 2 Continued. Markov chain results for the 16 rainfall districts contained in the study area for the mid-summer period (1985–2015) using
a threshold value of 3 mm rainfall per day (15 mm per pentad). (A) Probability for a single dry pentad – PD, (B) probability for dry pentad given
the previous pentad dry – PDD, (C) probability for two consecutive pentads being dry starting with the pentad − 2D, (D) probability for three
consecutive pentads being dry starting with the pentad − 3D
 District                                                                  Pentad
                    70                 71          72               73               1                2                3               4
                                                                     (B) PDD
 60                29.00             22.60        25.80            25.80            33.30           35.50            29.00           35.50
 61                22.58              19.35       25.81            25.81            26.67           25.81            25.81           25.81
 62                 9.70              16.10       12.90            19.40            20.00           19.40            12.90           12.90
 63                12.90              19.40       12.90            16.10            36.70           16.10            32.30           32.30
 72                41.90             54.80        41.90            29.00            50.00           51.60            29.00           29.00
 73                29.00             32.30        29.00            25.80            46.70           58.10            38.70           38.70
 74                16.10              19.40       19.40            9.70             20.00           32.30            29.00           19.40
 75                12.90             22.60        16.10            9.70             20.00           35.50            25.80           16.10
 83                41.90             48.40        25.80            35.50            63.30           61.30            48.40           48.40
 84                22.60             35.50        25.80            25.80            40.00           48.40            41.90           35.50
 85                19.40             22.60        35.50            25.80            46.70           41.90            32.30           25.80
 86                16.10             22.60        22.60            16.10            20.00           35.50            32.30           29.00
 87                22.60              41.90       32.30            41.90            56.70           41.90            38.70           41.90
 91                54.80              51.60       35.50            41.90            53.30           51.60            45.20           54.80
 92                41.90             45.20        41.90            41.90            50.00           51.60            35.50           29.00
 93                35.50              38.70       41.90            45.20            56.70           58.10            32.30           25.80
                                                                     (C) 2D
 60                11.70              11.70       10.00            20.40            21.70           15.00            21.70           14.20
 61                 7.49              13.32        9.99            13.76            14.98           12.49            14.98           10.93
 62                 6.24              5.41         6.87            9.03             9.99             4.16            5.83             4.16
 63                 8.70              5.40         4.70            20.10            10.40           13.50            22.90           15.00
 72                42.50             28.40        15.90            30.60            36.60           18.70            15.00           15.00
 73                20.80              15.90       11.70            31.60            39.30           26.20            25.00           13.10
 74                 8.10              8.70         2.80            8.40             16.60           14.00            11.90            4.10
 75                11.70              7.30         2.80            9.00             18.30           12.50            8.80             8.70
 83                37.50              16.60       16.00            47.00            47.50           34.30            35.90           30.60
 84                20.60              15.00       13.30            21.90            32.80           21.60            25.20           12.50
 85                10.90              21.70       12.50            28.60            29.80           14.60            15.80            8.10
 86                10.20              12.40        6.20            8.40             20.60           15.60            18.70            6.20
 87                27.10              19.80       23.00            40.20            31.10           20.00            28.40            37.10
 91                36.60             24.00        24.30            36.10            36.60           26.20            44.20           24.00
 92                32.00              25.70       27.10            30.60            40.00           19.50            20.60           14.20
 93                26.20              27.10       29.10            40.20            43.10           19.80            15.00           21.60
                                                                     (D) 3D
 60                 3.01              3.01         3.33            7.25             6.31             5.32            5.61             3.20
 61                 1.93              3.44         2.66            3.55             3.87             3.22            3.38             3.17
 62                 0.81              1.05         1.37            1.75             1.29             0.54            0.75             0.81
 63                 1.13              0.87         1.72            3.24             3.36             4.36            6.65             2.42
 72                17.80              8.20         8.00            15.80            10.60            5.40            4.40             3.90
 73                6.00               4.10         5.40            18.40            15.20           10.20            5.60             3.40
 74                 1.57              0.85         0.56            2.71             4.83             2.72            1.15             0.92
 75                 1.88              0.70         0.56            3.20             4.73             2.01            1.71             1.41
 83                 9.70              5.90        10.10            28.80            23.00           16.60            16.20           11.80
 84                5.30               3.90         5.30            10.60            13.70            7.70            6.50             3.60
 85                3.88               5.61         5.83            11.99            9.60             3.76            3.06             2.09
 86                2.30               2.00         1.25            2.98             6.65             4.53            2.42             1.81
 87                 8.70              8.30        13.00            16.90            12.00            8.40            15.60           20.40
 91                13.00              10.08       12.99            18.65            16.54           14.38            15.69            9.30
 92                13.40             10.80        13.50            15.80            14.20            5.60            5.30             3.70
 93                11.00              12.20       16.50            23.40            13.90            5.10            6.30             9.80

Water SA 47(1) 76–87 / Jan 2021                                                                                                               82
https://doi.org/10.17159/wsa/2021.v47.i1.9447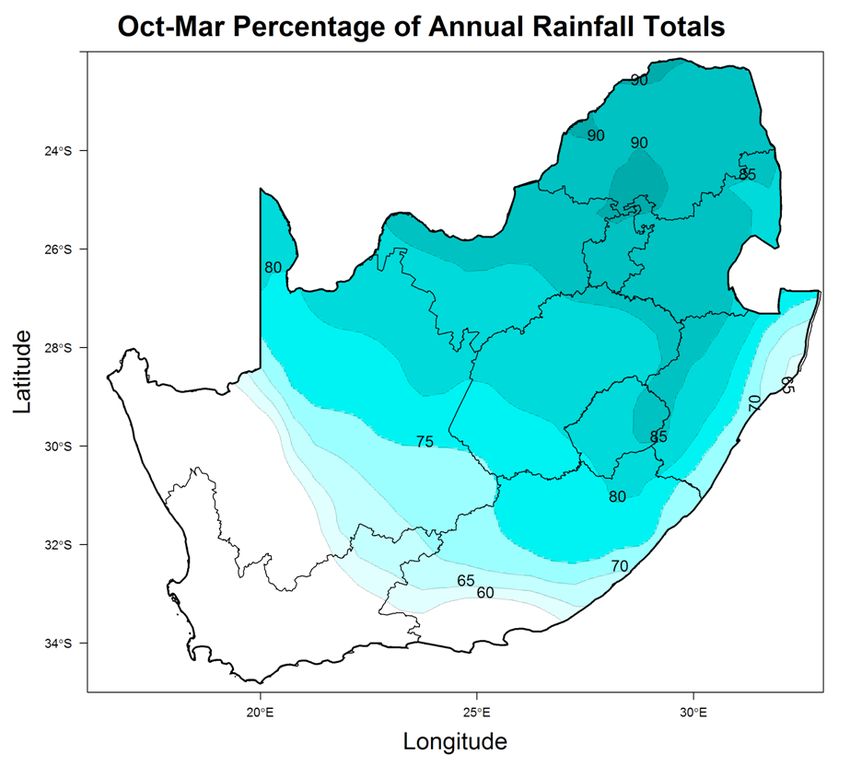
Spatial analysis of mid-summer rainfall
                                                                       Mpumalanga, Limpopo and North West Provinces, respectively.
The episode of dry spells (EP) is the number of consecutive dry        Most dry spell episodes with higher EP are concentrated in the
spells (≥ 2 pentads) in one mid-summer period (mid-December            north-central part of the study area. Similarly, the standard
and mid-January) averaged over a 30-year period with less than         deviation (STD) of the EP shown in Fig. 8 illustrates that the main
the threshold value of 15 mm per pentad. As shown in Fig. 7, the       deviation from the mean EP is located in District 74. Although
mean EP values varied from 1.69 to 2.10 across the districts. High     high mean values of EP were noticed in the north-central part of
mean EP values were observed around Districts 75, 86 and 91 in         the study area there is little variation from the mean EP.

Figure 7. The mean episode of dry spells (EP) during mid-December and mid-January using a threshold value of 15 mm for the period of
1985−2015. (EP) is the number of consecutive dry spells (≥ 2 pentads) in one mid-summer period

Figure 8. The standard deviation of the episode of dry spells (EP) during mid-December and mid-January using a threshold value of 15 mm for
the period of 1985–2015

Water SA 47(1) 76–87 / Jan 2021                                                                                                         83
https://doi.org/10.17159/wsa/2021.v47.i1.9447
The average maximum duration of dry spells (DD), which is the area. As shown in Fig. 9, high mean values of DD are noticeable maximum duration of consecutive dry spells using a threshold in Districts 83 and 92 in Free State and North West Provinces, of 15 mm between mid-December and mid-January per year, respectively. This indicates that dry pentads are more evident over is depicted in Fig. 9 and the deviations from the mean for each the districts during the mid-summer period compared to other district (standard deviation of DD) in Fig. 10. There is a close districts. More deviations from the mean DD were also observed range of mean DD across the districts; however, there is a decline for rainfall Districts 83 and 92 compared to the other districts as in the duration of dry spells from the west to east of the study shown in Fig. 10. Figure 9. The mean maximum duration of dry pentads (DD) during mid-December and mid-January using a threshold value of 15 mm for the period of 1985–2015 Figure 10. The standard deviation of the maximum duration of dry pentads (DD) during mid-December and mid-January using a threshold value of 15 mm for the period of 1985–2015 Water SA 47(1) 76–87 / Jan 2021 84 https://doi.org/10.17159/wsa/2021.v47.i1.9447
Impacts of dry spells on maize production                                These results show the probabilities of mid-summer pentads
                                                                         with rainfall less than 15 mm for the different rainfall districts.
Several studies on rainfall variability in Southern Africa have
                                                                         During a dry pentad, crops might not be affected if there is
reported both intra-seasonal and inter-annual variability in
                                                                         enough soil moisture available. However, districts (e.g. 72, 83 and
summer which is the main cropping season in the region
                                                                         93) experiencing 2 and 3 consecutive dry pentads are likely to
(Landman and Tennant, 2000; Usman and Reason, 2004; Tadross
                                                                         be water-stressed. These dry spells, compounded with the high
et al., 2005; Mupangwa et al., 2011; Crétat et al., 2011). This
                                                                         temperatures experienced during this period, may harm the
observed variability in rainfall and its impact on crop yield makes
                                                                         quality and yield of maize.
the Southern Africa region prone to food insecurities. Although
the relationships between the total rainfall and crop yield are clear,   Information on dry spell characteristics, such as frequency,
it is often the variability in seasonal rainfall characteristics such    duration and intensity, with respect to maize crop phenology is
as onset, cessation, and dry spells that is important in terms of        very important for dryland maize production. Studies in parts of
adverse effects on agriculture (Tadross et al., 2009).                   the study area in the Limpopo Province by Mzezewa et al. (2010)
                                                                         and Tshililo (2017) have highlighted that dry spells are one of the
The maize growing season experiences different rainfall
                                                                         most important determinants of maize yield reduction if coincident
characteristics such as dry spells which may impact phenology
                                                                         with the water stress–sensitive stages of the maize crop. Therefore,
and lead to reduced crop yields (Tadross et al., 2009; Moeletsi and
                                                                         planting dates should be chosen to ensure that this stage coincides
Walker, 2012). Maize is mostly planted on drylands in most parts
                                                                         with normally favourable growing conditions and does not coincide
of Southern Africa and is sensitive to water stress (Zinyengere
                                                                         with mid-summer dry spell periods (Du Plessis, 2003). In-situ
et al., 2014). The yield and quality of maize depend on the
                                                                         rainwater harvesting is a viable option to alleviate water stress in
distribution of rainfall during the different phenological stages,
                                                                         rainfed maize production. Moreover, information on the length of
in addition to other factors (Tadross et al., 2009, Mupangwa et
                                                                         dry spells could be used for selecting drought-tolerant crop varieties
al., 2011). Most studies show that maize plants are more sensitive
                                                                         and could also be used as a guide for planning supplementary
to water stress during silking and pollination compared to the
                                                                         irrigation during the mid-summer dry period.
vegetative stage (Du Plessis, 2003; Masupha et al., 2016).
Several studies have reported on dry and wet spell analysis over         SUMMARY AND CONCLUSIONS
southern Africa and their impacts on crop yield (e.g., Usman and         Rainfall is one of the most important factors limiting dryland
Reason 2004; Tadross et al., 2009; Mupangwa et al., 2011; Moeletsi       crop production in South Africa. The mid-summer period is
and Walker, 2012; and Duffy and Masere, 2015). However, except           particularly significant since a lack of rain for a few days during
for the study by Grobler (1993), little research has been devoted        this period may affect crop yields negatively. Dry spell frequency
to mid-summer dry spells which usually coincide with the water-          analyses are used to investigate the effects of sub-seasonal rainfall
sensitive growth stages of maize crop. In this study, a detailed         variability on crop yields since variability in seasonal rainfall
spatial and temporal analysis of the mid-summer dry spells was           totals alone does not show the relationship between rainfall and
performed for the maize growing areas of the summer rainfall             crop yields. However, little research has been dedicated to dry
region in South Africa using three thresholds of 5 mm, 10 mm,            spell characteristics in South Africa.
and 15 mm total rainfall for a pentad. As shown in the previous
sections, the frequency (Figs 5 and 6), magnitude (Fig. 7),              In this study, a dry spell was defined as a pentad with a rainfall
and duration (Fig. 9) of mid-summer dry spells differ across             total that is less than a predefined threshold. Three thresholds of
the rainfall districts in the maize-growing areas of the summer          5 mm, 10 mm, and 15 mm total rainfall for a pentad were used
rainfall region in South Africa. These results are in agreement          for the analysis of dry spells. This study investigated the spatial
with the findings of Grobler (1993), who reported an increase in         and temporal occurrences of the mid-summer dry spells based on
length, intensity and occurrence probability of dry spells from          magnitude, length and time of occurrence in the summer rainfall
east to west of the study area.                                          region of South Africa. The existence of a climatological dry
                                                                         period within the main rainfall season was investigated using the
Annual frequency of dry pentads for the mid-summer period                monthly rainfall totals from October to March. The results show
ranged between 0 and 4 pentads for the 5 mm threshold and                that, climatologically, mid-summer months do not experience
from 1 to 7 for the 10 mm and 15 mm thresholds, as presented in          lower rainfall than the early and late summer months. However,
Fig. 6. These results are comparable with the study of Usman and         the dry spell analysis showed that dry pentads occur during mid-
Reason (2004), who reported mean frequency of dry spells for the         summer with different intensity, duration and frequency across
study area ranging between 1 and 7 pentads using a threshold of          the maize-growing areas of the summer rainfall region. The non-
5 mm for the austral summer season (December to February). For           parametric Mann-Kendall trend analysis for the dry pentads
meteorological and some hydrological applications, the 5 mm and          during mid-summer for 16 selected homogeneous rainfall districts
10 mm thresholds are useful and may suffice; however, for crop           indicates that there is no significant trend in the frequency of dry
production, the 15 mm (3 mm per day) threshold pentad rainfall           spells at the 95% significance level. The initial and conditional
is more applicable. Reddy (1990) proposed the use of a 3 mm              probabilities of getting a dry spell using the Markov chain model
threshold per day (15 mm per pentad), which is the minimum               also showed that there is a 32% to 80% probability that a single
rainfall depth threshold value for crops to satisfy their crop           pentad will be dry using the 15 mm threshold. There is a 5%
water requirement during a growing season. For regions with              to 48% probability of experiencing 2 consecutive dry pentads
high evaporative demand, Stern et al. (2003) suggested a higher          and 1 to 29% probability of getting 3 consecutive dry pentads.
threshold of 4.95 mm can be used to define a wet day.                    Consecutive dry spells mostly seem to occur during Pentads 73
Markov chain results for the 16 rainfall districts contained in          (end of December) and 1 (beginning of January). Furthermore,
                                                                         the Markov chain analysis showed a decrease in the probability
the study area for the mid-summer period (1985–2015) show
                                                                         of dry spells from west to east of the study area. Analysis of the
that there is a 32% to 80% probability that a single pentad will
                                                                         duration and intensity of dry spells also showed a decrease from
be dry using the 15 mm threshold (Table 2). There is a 5% to
                                                                         west to east of the study area.
48% probability of experiencing 2 consecutive dry pentads and,
for the same period, there is a 1% to 29% probability of getting 3       The research presented in this study will significantly contribute
consecutive dry pentads for the study area, as shown in Table 2.         to dry spell research in South Africa and addresses some of the

Water SA 47(1) 76–87 / Jan 2021                                                                                                            85
https://doi.org/10.17159/wsa/2021.v47.i1.9447
research gaps in dry spell analysis studies, which are of utmost KARNAUSKAS KB, SEAGER R, GIANNINI A and BUSALACCHI
importance for rainfed crop production. The findings from this AJ (2013) A simple mechanism for the climatological midsummer
study will assist farmers and decision-makers to adjust planting drought along the Pacific coast of Central America. Atmosfera. 26
dates of summer crops to ensure favourable growing conditions (2) 261–281. https://doi.org/10.1016/S0187-6236(13)71075-0
during the water stress–sensitive growth stages. Information KRUGER AC (2011) Identification and quality control procedures for
rainfall stations: 1961-2010. South African Weather Service Report,
about dry spells could also be used for selecting a crop variety in a
CLS-RES-REP-2011-10.1. South African Weather Service, Pretoria.
given location and for planning supplementary irrigation.
KRUGER AC and NXUMALO MP (2017) Historical rainfall trends in
South Africa: 1921-2015. Water SA. 43 (2) 285–297. http://dx.doi.
ACKNOWLEDGMENTS org/10.4314/wsa.v43i2.12
The research presented in this paper forms part of Water Research LANDMAN WA and TENNANT W J (2000) Statistical downscaling
Commission (WRC) Project No. K5/2830 ‘An investigation of of monthly forecasts. Int. J. Climatol. 20 1521–1532. https://doi.
org/10.1002/1097-0088(20001115)20:133.0.CO;
the historical and projected occurrence of the South African
2-N
mid-summer drought and its implications for the agro-water
LIBISELLER C and GRIMVALL A (2002) Performance of partial
budget’. Funding from the WRC and the South African Weather Mann-Kendall tests for trend detection in the presence of covariates.
Service (SAWS) for this study is gratefully acknowledged. The Environmetrics. 13 71–84. https://doi.org/10.1002/env.507
contributions of the members of the WRC Reference Group for MARTIN-VIDE J and GOMEZ L (1999) Regionalization of penin-
Project No. K5/2830 are also gratefully acknowledged. sular Spanish based on the length of dry spells. Int. J. Climatol.
19 (5) 537–555. https://doi.org/10.1002/(SICI)1097-0088(199904)19:
REFERENCES 53.0.CO;2-X
MASUPHA TE, MOELETSI ME and TSUBO M (2016). Dry spells
AgWeb (2015) South Africa major and minor corn growing areas.
assessment with reference to the maize crop in the Luvuvhu River
AgWeb/NOAA/USDA. URL: https://www.agweb.com/article/south-
catchment of South Africa. Phys. Chem. Earth. 92 99-111. https://
africa-corn-crop-seen-shrinking-further-as-drought-spreads-blmg
doi.org/10.1016/j.pce.2015.10.014
(Accessed 6 September 2019).
MOELETSI ME and WALKER S (2012) Rainy season characteristics of
BÄRRING L, HOLT T, LINDERSON ML, RADZIEJEWSKI M,
the Free State Province of South Africa with reference to rain-fed
MORIONDO M and PALUTIKOF JP (2006) Defining dry/wet spells
maize production. Water SA. 38 (5) 775-782. https://doi.org/10.4314/
for point observations, observed area averages, and regional climate
wsa.v38i5.17
model grid-boxes in Europe. Clim. Res. 31 (1) 35–49. https://doi.
MOON SE, RYOO SB and KWON JG (1994) A Markov chain model for
org/10.3354/cr031035
daily precipitation occurrence in South Korea. Int. J. Climatol. 14
BHALOTRA YPR (1984) Climate of Botswana, Part I. Climatic controls.
Department of Meteorological services, Ministry of Transport and 1009–1016. https://doi.org/10.1002/joc.3370140906
Communications, Botswana. MUPANGWA W, WALKER S and TWOMLOW S (2011) Start,
CEBALLOS A, MARTINEZ-FERNANDEZ J and LUENGO-UGIDOS end and dry spells of the growing season in semi-arid southern
MA (2004) Analysis of rainfall trends and dry period on a Zimbabwe. J. Arid Environ. 75 1097–1104. https://doi.org/10.1016/j.
pluviometric gradient representative of Mediterranean climate in jaridenv.2011.05.011
the Duero Basin, Spain. J. Arid Environ. 58 214-232. https://doi. MZEZEWA J, MISI T and VAN RENSBURG L (2010) Characterisation
org/10.1016/j.jaridenv.2003.07.002 of rainfall at a semi-arid ecotope in the Limpopo Province (South
CRÉTAT J, MACRON C, POHL B and RICHARD Y (2011) Quantifying Africa) and its implications for sustainable crop production. Water
internal variability in a regional climate model: a case study for SA. 36 (1) 19–26. https://doi.org/10.4314/wsa.v36i1.50903
Southern Africa. Clim. Dyn. 37 1335-1356. https://doi.org/10.1007/ NCAR (2018) National Center for Atmospheric Research Staff (eds).
s00382-011-1021-5 The climate data guide: cpc unified gauge-based analysis of global
DOUGUEDROIT A (1987) The variation of dry spells in Marseilles daily precipitation. URL: https://climatedataguide.ucar.edu/climate-
from 1865 and 1984. J. Climatol. 7 541-551. https://doi.org/10.1002/ data/cpc-unified-gauge-based-analysis-global-daily-precipitation
joc.3370070603 (Accessed 21 July 2019).
DUFFY KJ and MASERE TP (2015) Effect of within-season daily NGETICH KF, MUCHERU-MUNA M, MUGWE JN, SHISANYA
rainfall distribution on maize crop yields. Outlook Agr. 44 267-271. CA, DIELS J and MUGENDI DN (2014) Length of growing season,
https://doi.org/10.5367/oa.2015.0223 rainfall temporal distribution, onset and 61 cessation dates in the
DU PLESSIS J (2003) Maize production. Directorate Agricultural Kenyan highlands. Agric. For. Meteorol. 188 24–32. https://doi.
Information Services, Department of Agriculture in cooperation org/10.1016/j.agrformet.2013.12.011
with ARC-Grain Crops Institute. Potchefstroom, South Africa. PERDIGON-MORALES J, ROMERO-CENTENO R, PEREZ PO and
ENGELBRECHT CJ, LANDMAN WA, ENGELBRECHT FA and BARRET BS (2017) The midsummer drought in Mexico: perspectives
MALHERBE J (2014) A synoptic decomposition of rainfall over the on duration and intensity from the CHIRPS precipitation database.
Cape south coast of South Africa. Clim. Dyn. 44 2589–2607. https:// Int. J. Climatol. 38 (5) 2174–2186. https://doi.org/10.1002/joc.5322
doi.org/10.1007/s00382-014-2230-5 PEREIRA LS, CORDERY I and IACOVIDES I (2009) Coping with
FREI C, CHRISTENSEN JH, DE´QUE´ M, JACOB D, JONES RG and water scarcity. In addressing the challenges; Springer Science and
VIDALE PL (2003) Daily precipitation statistics in regional climate Business Media: Dordrecht, The Netherlands. 382pp.
models: evaluation and intercomparison for the European Alps. J. PERZYNA G (1994) Spatial and temporal characteristics of maximum
Geophys. Res. 108 (D3) 4124. https://doi.org/10.1029/2002JD002287 dry spells in southern Norway. Int. J. Climatol. 14 895–909. https://
GROBLER EJML (1993) Die midsomerdroogte in the sentrale dele van doi.org/10.1002/joc.3370140806
die somerreenvalgebied van Suid Afrika. MSc. thesis, University of REASON CJC, ROUAULT M, MELICE JL and JAGADHEESHA D
Stellenbosch. (2002) Interannual winter rainfall variability in SW South Africa
HARRISON MSJ (1984) A generalized classification of South African and large scale ocean-atmosphere interactions. Meteorol. Atmos.
summer rain-bearing synoptic systems. J. Climatol. 4 (5) 547– Phys. 80 19–29. https://doi.org/10.1007/s007030200011
560. https://doi.org/10.1002/joc.3370040510 REDDY SJ (1990) Methodology: Agro-climatic analogue technique and
HART NCG, REASON CJC and FAUCHEREAU N (2010) Tropical– applications as relevant to dry land agriculture. Agro climatology
extratropical interactions over southern africa: three cases of heavy Series Eth 86/21-WMO/UNDP, NMSA 60 pp.
summer season rainfall. Mon. Weather Rev. 138 (7) 2608–2623. RICHARD Y, FAUCHEREAU N, POCCARD I, ROUAULT M and
https://doi.org/10.1175/2010MWR3070.1 TRZASKA S (2001) 20th century droughts in Southern Africa –
HIPEL KW and MCLEOD AI (1994) Time Series Modelling of Water spatial and temporal variability, teleconnections with oceanic and
Resources and Environmental Systems. Elsevier Science, Amsterdam. atmospheric conditions. Int. J. Climatol. 21 873–895. https://doi.
1014 pp. org/10.1002/joc.656
Water SA 47(1) 76–87 / Jan 2021 86
https://doi.org/10.17159/wsa/2021.v47.i1.9447SAWB (South African Weather Bureau) (1972) WB35. Climate of South TALJAARD JJ (1996) Atmospheric circulation systems, synoptic Africa. Part 10. District rainfall for South Africa and the annual climatology and weather phenomena of South Africa: Part 6: march of rainfall over Southern Africa. South African Weather Rainfall in South Africa. Technical Paper 32. South African Weather Bureau, Pretoria. Bureau, Pretoria. STERN R, KNOCK J, RIJKS D and DALE I (2003) INSTAT Climatic TSHILILO FP (2017) Rainy season characteristics with reference to Guide. 398 pp. http://www.reading.ac.uk/ssc/software/instat/clim maize production for the Luvuvhu river catchment, Limpopo atic.pdf (Accessed 9 July 2020). Province, South Africa. PhD thesis, University of KwaZulu-Natal. TADROSS MA, HEWITSON BC and USMAN MT (2005) The inter- USMAN MT and REASON CJC (2004). Dry spell frequencies and their annual variability on the onset of the maize growing season over variability over southern Africa. Clim. Res. 26 199–211. https://doi. South Africa and Zimbabwe. J. Clim. 18 3356–3372. https://doi. org/10.3354/cr026199 org/10.1175/JCLI3423.1 ZINYENGERE N, CRESPO O, HACHIGONTA S and TADROSS M TADROSS M, SUAREZ P, LOTSCH A, HACHIGONTA S, MDOKA (2014) Local impacts of climate change and agronomic practices on M, UNGANAI L, LUCIO F, KAMDONYO D and MUCHINDA M dry land crops in Southern Africa. Agr. Ecosyst. Environ. 197 1–10. (2009) Growing-season rainfall and scenarios of future change in https://doi.org/10.1016/j.agee.2014.07.002 southeast Africa: Implications for cultivating maize. Clim. Res. 40 147–161. https://doi.org/10.3354/cr00821 TALJAARD JJ (1986) Change of rainfall distribution and circulation patterns over Southern Africa in summer. J. Climatol. 6 579–592. https://doi.org/10.1002/joc.3370060602 Water SA 47(1) 76–87 / Jan 2021 87 https://doi.org/10.17159/wsa/2021.v47.i1.9447
You can also read