Occurrence characteristics of branching structures in equatorial plasma bubbles: a statistical study based on all-sky imagers in China - Earth and ...
←
→
Page content transcription
If your browser does not render page correctly, please read the page content below
Earth and Planetary Physics
RESEARCH ARTICLE                                                                                                    5: 407–415, 2021
SPACE PHYSICS: IONOSPHERIC PHYSICS                                                                        doi: 10.26464/epp2021044

Occurrence characteristics of branching structures in equatorial
plasma bubbles: a statistical study based on all-sky imagers in China
Kun Wu1,2, JiYao Xu1,2*, YaJun Zhu1,2, and Wei Yuan1,2
1State   Key Laboratory of Space Weather, National Space Science Center, Chinese Academy of Sciences, Beijing 100190, China;
2School   of Astronomy and Space Science, University of Chinese Academy of Sciences, Beijing 100049, China

Key Points:
 ● Branching structure is a high occurrence phenomenon during the evolution of EPBs but not all EPBs are observed to develop

   branching.
 ● Occurrence times of BSEPBs vary with local time, and most of the BSEPBs begin to appear between 21:00 and 22:00 LT.

 ● BSEPBs occurrence is related to solar activity and geomagnetic activity.

Citation: Wu, K., Xu, J. Y., Zhu, Y. J., and Yuan, W. (2021). Occurrence characteristics of branching structures in equatorial plasma bubbles:
a statistical study based on all-sky imagers in China. Earth Planet. Phys., 5(5), 407–415. http://doi.org/10.26464/epp2021044

Abstract: Branching structure (BS) is a very important phenomenon in the evolution of equatorial plasma bubbles (EPBs), the mechanism
of which is widely studied from observation and from simulation. However, occurrence characteristics of branching structure of
equatorial plasma bubbles (BSEPBs) have not been well addressed. In this work, we used seven-years (2012−2018) of observations from
two all-sky imagers to study occurrence of BSEPBs in detail. These data reveal a high incidence of BS in EPB cases; in particular, most EPBs
occurring on days with geomagnetic disturbances exhibited BS. Periods when all EPBs exhibited BS increased significantly in the 2014
solar maximum. Occurrence times of BSEPBs varied with local time; most of the BSEPBs began to appear between 21:00 and 22:00 LT.
During the solar maximum, some BSEPBs were observed after midnight. The data also reveal that BSEPBs are characterized primarily by
two branches or three branches. Multi-branching appeared only in the solar maximum. EPB events with different coexisting branching
structures increased from 2012 to 2014 and decreased from 2014 to 2018. These results strongly suggest that BSEPB occurrence is related
to solar activity and geomagnetic activity, and thus provide a new perspective for future studies of EPBs as well as enriching our
understanding of ionospheric irregularity.
Keywords: branching structure of equatorial plasma bubble; equatorial plasma bubble; ionospheric irregularity; all-sky imager

1. Introduction                                                                  served the BSEPB phenomenon repeatedly in airglow observa-
The ionosphere usually becomes unstable after sunset, promot-                    tions. Meanwhile, some satellite observations confirmed the pres-
ing development of some plasma density depletions in the low-                    ence of branching in EPBs (Aggson et al., 1996). Based on so many
latitudes, which are called equatorial spread F or equatorial                    observations, generation of BSEPBs has been widely studied. Agg-
plasma bubbles (EPBs). It is generally accepted that EPBs are                    son et al. (1996) used observations from satellites to determine
caused by Rayleigh-Taylor-like instability (Ott, 1978; Ossakow,                  that appearances of BS in EPBs are related to the electric field
1981; Kelley, 2009; Makela and Otsuka, 2012). As EPBs evolve,                    arising from the plasma depletion region. Some studies have sug-
some exhibit branching structure (BS). The branching structure of                gested that occurrences of BSEPB are due to the polarization elec-
equatorial plasma bubbles (BSEPBs) is a very important phe-                      tric fields associated with EPBs (Li GZ et al., 2011; Wu K et al.,
nomenon.                                                                         2017). Makela et al. (2006) presented evidence that BSEPBs are
                                                                                 caused by secondary instabilities. A number of simulations have
Over the past years, equatorial plasma bubbles exhibiting branch-
                                                                                 also been performed to study the evolution of BSEPBs. Zalesak et
ing structure have been detected by different instruments (e.g.,
                                                                                 al. (1982) used a three-layer model to simulate a simple BSEPB un-
Woodman and La Hoz, 1976; Tsunoda et al., 1982). Woodman and
                                                                                 der a certain diffusion parameter and a ratio of conductivity relat-
La Hoz (1976) detected BSEPBs in radar observations. Similarly,
Tsunoda et al. (1982) observed BSEPBs in ALTAIR radar data. Men-                 ive to the background. Huba and Joyce (2008) showed that a 2D
dillo and Baumgardner (1982), and Mendillo and Tyler (1983) ob-                  simulation code (NRLESF2) could generate multiple BSEPBs.
                                                                                 Yokoyama et al. (2014) reproduced the nonlinear growth of EPB
Correspondence to: J. Y. Xu, jyxu@spaceweather.ac.cn
                                                                                 and BSEPB process, using a three-dimensional high-resolution
Received 03 JUL 2021; Accepted 21 JUL 2021.                                      bubble model. Although the evolution of BSEPBs has been widely
Accepted article online 16 AUG 2021.                                             studied and simulated, their occurrence characteristics have not
©2021 by Earth and Planetary Physics.                                            been investigated in detail.
408 Earth and Planetary Physics doi: 10.26464/epp2021044
In this paper, we used seven-years (2012−2018) of observations 40
from two all-sky imagers located at Fuke and Qujing, China to
study BSEPB occurrence characteristics. Statistical results show 35
that BS occurs with a high incidence in the evolution of EPBs.
However, not all EPBs are accompanied by BS occurrence. Occur- 30
rence times of BSEPBs change with local time. Furthermore, their
G. Latitude (°N)
occurrence characteristics are found to be related to solar activity 25
and geomagnetic activity.
20
2. Instrumentation
15
The airglow data used in this study were from two all-sky imagers,
which were deployed at low-latitude regions in southern China.
10
One of them operates over Fuke, China (Geographic: 19.5° N,
109.1° E; Geomagnetic: 9.5° N, 178.4° W); the other operates over
5
Qujing, China (Geographic: 25° N, 104° E; Geomagnetic: 15.1° N, 90 95 100 105 110 115 120 125
176.0° E). Their locations are indicated by the stars in Figure 1. The G. Longitude (°E)
imagers have the same design. Each all-sky imager consists
Figure 1. The locations of the two all-sky imagers. The stars denote
primarily of a fish-eye lens with a 180° field of view, a CCD detect-
the geographic locations of the all-sky imagers at Qujing and Fuke.
or (1024 × 1024 pixel), and an interference filter (630.0 nm). The
The blue and red circles denote the fields of view, respectively of the
integration time is 3 min. An introduction to the two all-sky im-
two imagers at an altitude of 250 km. The red dotted line represents
agers has been given in several previous publications (e.g., Wu K
the magnetic equator.
et al., 2018, 2020, 2021).
was assumed to be at 250 km. Figure 2 shows EPBs associated
3. Observations and Results with various BSs, such as no BS (a), two BSs (b, c), three BSs (d),
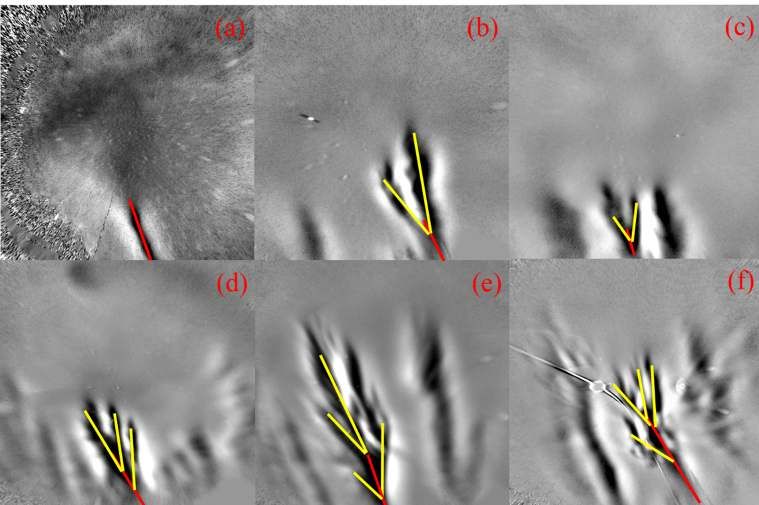
In Figure 2, we present some typical examples of EPBs with BS. A and multi-BS (e, f) (more than three branches). It is generally true
red line denotes the main stem of an EPB and a yellow line de- that most EPBs display one or more occurrences of BS in their de-
notes BS on an EPB. Images of Figure 2 are from two all-sky im- velopment. These BSs are related to the morphological character-
agers. For these images, we used an unwarping (Garcia et al.,
istics and evolutions of the EPBs. Unfortunately, occurrence char-
1997) process to remove the effects of compression and curing by
acteristics of BSEPBs have not previously been well addressed.
the all-sky imagers. These images have been mapped into a cor-
responding geographic range; in this process, the airglow layer In order to study occurrence characteristics of BSEPBs, we used
Figure 2. Various BSs of images were obtained from two all-sky imagers that were located at Qujing and Fuke, China. (a) no BS; (b) and (c) two
BSs; (d) three BSs; (e) and (f) multi-BSs. These images were mapped to geographical coordinates; in the image processing, the airglow layer was
assumed to be at 250 km.
Wu K and Xu JY et al.: Occurrence characteristics of branching structures in equatorial plasma bubblesEarth and Planetary Physics doi: 10.26464/epp2021044 409
2012−2018 (seven years) of observation data from the two sta- atively rare though not as rare as days on which no branching of
tions. We investigated every EPB event for evidence of BS to de- EPBs is observed; in other words, on most EPB days, some EPBs ex-
termine BS incidence rate. During the statistical process, we con- hibit BS but others do not. The data in Figure 3 also reveal anoth-
sidered only branching of the main stem; we did not count sub- er interesting fact — that the frequency of occurrence of branch-
branching (branches of branches). Table 1 gives data categories of ing EPBs appears to be linked to solar activity. During the solar
two all-sky imagers, including year, total EPB days, no BS EPB days, maximum (2014 in our data set), days of EPB with BS increase sig-
days on which some EPBs exhibited BS, and days on which all nificantly. In particular, the values in the red column increased sig-
EPBs were observed to branch. Numbers in brackets represent the nificantly; that is, an increased incidence of EPBs with branching
subset of geomagnetically disturbed days (if Dst index is < −30 nT structure was observed, clearly related to solar activity; the incid-
before all EPBs disappear, we defined it is a geomagnetically dis- ence of branching EPBs was highest during the solar maximum.
turbed day) within each category. Figure 3 shows occurrence Note also that numbers in the white column correlate strongly
characteristics derived from data collected by the two all-sky im- with those in the BS column, which means that on days when
agers. In Figure 3, the black column presents total EPB days; the geomagnetic disturbances were observed, most EPBs exhibited
gray column indicates EPB days on which no branching was ob- BS, strongly suggesting a link between geomagnetic activity and
served; the green column presents days on which BS was ob- the occurrence of BSEPBs.
served in some EPBs; the red column indicates days when all EPBs Another variable of interest to the study of occurrence character-
had BS; the white column gives the subsets of geomagnetically istics of BSEPB is the occurrence time of the first BS in every BSEPB
disturbed days. case. These data are given in Table 2, which presents year, effi-
These data presented in Figure 3 reveal some significant occur- cient days (except for the days without branching EPBs and days
rence characteristics of BSEPB. It can be seen that BS appeared on in which occurrence time of first BS cannot be determined), and
most days when EPBs were observed (in every year, the values in occurrence times of first BSEPB. These results are displayed in
the gray column are much less than the ones green column plus Figure 4: the black column presents efficient days; the gray
red column). In other words, BS is a high occurrence phenomen- column presents days on which the first BS appeared between
on during the evolution of EPBs. On most days when EPBs were 20:00 and 21:00 LT; the green column presents days on which the
observed, at least one of them exhibited branching; however, it is
Observation of Qujing station
worth noting that not all EPBs were observed to branch. Also 60
(a) Total EPB days
worthy of note is that in every year the numbers in the green Days when no EPBs exhibit BS
Days when some EPBs exhibit BS
column are relatively larger than those in the red column; in other
Days when all EPBs exhibit BS
words, days on which all EPBs exhibit branching structure are rel-
Number of days
40 Disturbed days
Table 1. BS occurrence observed by all-sky imagers at Qujing and
Fuke.
20
Days Days
Days when
Total when no when all
Year some EPBs Station
EPB days EPBs EPBs
exhibit BS
exhibit BS exhibit BS 0
2012 2013 2014 2015 2016 2017 2018
2012 20(11) 3(2) 17(9) 0
Observation of Fuke station
2013 24(3) 3(0) 19(3) 2(0) 100
(b) Total EPB days
Days when no EPBs exhibit BS
2014 56(6) 3(1) 37(5) 16(0) Days when some EPBs exhibit BS
80
2015 21(6) 3(1) 16(5) 2(0) Qujing Days when all EPBs exhibit BS
Number of days
Disturbed days
2016 8(4) 2(2) 6(2) 0 60
2017 0 0 0 0
40
2018 1(0) 1(0) 0 0
2012 0 0 0 0 20
2013 46(8) 7(1) 34(6) 5(1)
0
2012 2013 2014 2015 2016 2017 2018
2014 92(31) 5(2) 52(24) 35(5)
2015 39(19) 6(4) 30(15) 3(0) Fuke Figure 3. Statistical results of BS occurrences observed by all-sky
2016 25(7) 4(1) 19(6) 2(0) imagers in Qujing (a) and Fuke (b), China during years 2012 to 2018.
The black column presents total EPB days; the gray column presents
2017 11(2) 2(0) 8(2) 1(0)
the number of EPB days during which no branching was detected; the
2018 12(5) 5(1) 7(4) 0
green column presents EPB days on which at least some EPBs
Note: BS = branching structure; EPB = equatorial plasma bubble. exhibited BS; the red column presents days on which all observed
Numbers in brackets represent the subset of geomagnetically EPBs exhibited BS; the white column presents geomagnetically
disturbed days in each category. disturbed days.
Wu K and Xu JY et al.: Occurrence characteristics of branching structures in equatorial plasma bubbles410 Earth and Planetary Physics doi: 10.26464/epp2021044
Table 2. Occurrence time of BS varied with local time at Qujing and Fuke.
Efficient First BS occurred First BS occurred First BS occurred First BS occurred First BS occurred
Year Station
days at 20:00−21:00 LT at 21:00−22:00 LT at 22:00−23:00 LT at 23:00−24:00 LT after midnight
2012 13(7) 0 10(4) 3(3) 0 0
2013 18(2) 0 17(2) 1(0) 0 0
2014 48(4) 6(0) 30(4) 4(0) 3(0) 5(0)
2015 15(5) 2(0) 11(5) 2(0) 0 0 Qujing
2016 5(1) 0 2(1) 2(0) 1(0) 0
2017 0 0 0 0 0 0
2018 0 0 0 0 0 0
2012 0 0 0 0 0 0
2013 23(4) 1(0) 16(4) 3(0) 3(0) 0
2014 49(17) 9(5) 33(8) 5(4) 2(0) 0
2015 22(7) 3(2) 14(4) 4(1) 1(0) 0 Fuke
2016 14(3) 2(1) 7(2) 5(0) 0 0
2017 7(2) 1(0) 4(1) 2(1) 0 0
2018 6(4) 1(1) 3(2) 2(1) 0 0
Note: BS=branching structure; EPB=equatorial plasma bubble. Numbers in brackets represent the subset of geomagnetically disturbed days in
each category.
first BS appeared between 21:00 and 22:00 LT; the blue column re- was observed, most were two- or three-branch structures. Struc-
cords the days when first BS appeared between 22:00 and 23:00 tures with more than three branches (“multi-branch”) appeared
LT; appearances between 23:00 and 24:00 LT are presented in the only in 2014, the year of highest solar activity. Moreover, Figure 5
red column; the yellow column indicates days on which the first shows that days on which various forms of BSEPB were observed
BS appeared after midnight; the white column within each to coexist increased from 2012 to 2014 and decreased from 2014
column records days on which geomagnetic-disturbance was de- to 2018. There was also a positive correlation between BSEPB
tected. Examination of the data in Figure 4 reveals that the ap- count and solar flux; thus, BSEPB occurrence appears to be re-
pearance times of BSEPBs varied with local time. For branching lated to solar activity.
EPBs, most of the first instances of BS appeared between 21:00
and 22:00 LT. Others often appeared between 22:00 and 24:00 LT. 4. Discussion
Interestingly, appearances of the first BS after midnight began to In Section 3, occurrence characteristics of BSEPB were investig-
occur during the solar maximum (for example 2014). Note also ated in detail. Statistical results of seven-years (2012−2018) of ob-
that comparison of days with and without geomagnetic disturb- servations from two all-sky imagers reveal that BS appears to be a
ances reveals no correlation with appearance time of BS; thus we high occurrence phenomenon in the evolution of EPBs. However,
find no obvious link between geomagnetic activity and BS ap- not every EPB exhibited BS during its evolution. Meanwhile, this
pearance time. analysis demonstrates that occurrence times of BSEPBs varied
To investigate further the occurrence characteristics of BSEPB, we with local time, and that their occurrence characteristics were re-
used statistics to investigate the significance of various structural lated to solar activity. These results will enhance our understand-
forms of BS. Detailed data are shown in Table 3, which displays, for ing of EPB evolution.
each year, total BS days (EPB days on which no branching was ob- BS is an important morphological feature of EPBs. By studying the
served are not included), two-BS days, three-BS days, multi-BS occurrence of BS, we can better understand the stability and com-
days, and days when various BSs were observed to exist simultan- plexity of EPBs. Occurrence of BS should be an important reflec-
eously. Figure 5 presents the statistical result of these different tion of EPB stability. It is generally accepted that Rayleigh–Taylor
BSs. In Figure 5, the black column presents total BS days; the gray instability is the most plausible mechanism triggering EPBs.
column, days when two-branch EPBs were observed; the green However, the evolution of EPBs will be affected by other factors,
column, three-branch EPB days; the blue column, days on which such as secondary instabilities known to be associated with EPBs.
branching higher than three was observed; the red column, days Many studies have found that EPBs usually are influenced by sec-
on which BSs with different structures were observed to exist sim- ondary instabilities along the EPB wall (Makela et al., 2006; Yokoy-
ultaneously; the white column in each parent column records the ama et al., 2014). Secondary instabilities will cause BS to appear in
subset of days on which geomagnetic disturbances were ob- the EPB. Secondary instabilities usually occur on the western wall
served. Figure 5 reveals some significant statistical results. Certain of an EPB, which can promote the develop of a BS (Tsunoda et al.,
BS types occurred more frequently than others. When branching 1982). Makela et al. (2006) reported that secondary instabilities
Wu K and Xu JY et al.: Occurrence characteristics of branching structures in equatorial plasma bubblesEarth and Planetary Physics doi: 10.26464/epp2021044 411
Observation of Qujing station Observation of Qujing station
50 60
(a) Efficient days (a) Total BS days
First BS occurred at 20—21 LT Two-BS days
40 First BS occurred at 21—22 LT Three-BS days
First BS occurred at 22—23 LT Multi-BS days
Number of days
First BS occurred at 23—24 LT 40 Various BS days
Number of days
30 First BS occurred after midnight Disturbed days
Disturbed days
20
20
10
0 0
2012 2013 2014 2015 2016 2017 2018 2012 2013 2014 2015 2016 2017 2018
Observation of Fuke station Observation of Fuke station
50 100
(b) Efficient days (b) Total BS days
First BS occurred at 20—21 LT Two-BS days
40 First BS occurred at 21—22 LT 80 Three-BS days
First BS occurred at 22—23 LT Multi-BS days
Number of days
Various BS days
Number of days
First BS occurred at 23—24 LT
30 First BS occurred after midnight
60 Disturbed days
Disturbed days
20 40
10 20
0 0
2012 2013 2014 2015 2016 2017 2018 2012 2013 2014 2015 2016 2017 2018
Figure 4. Occurrence time of branching structure (years 2012 to Figure 5. Statistical results of branching structure were obtained
2018) varied with local time. (a) and (b) show statistical results from Qujing station (a) and Fuke station (b). The black column
obtained from Qujing station and Fuke station, respectively. The black presents total branching days; the gray, days of two-branch EPBs; the
column presents the efficient days (except for days without branching green column, days of three-branch EPBs; the blue column, days of
EPBs and days on which occurrence time of first BS cannot be multi-branch EPBs; the red column, days on which various branching
determined); the gray column presents days on which the first BS structure existed simultaneously; the white portion of every column
appeared between 20:00 and 21:00 LT; the green column presents presents the subset of days on which geomagnetic disturbance was
days when first BS appeared between 21:00 and 22:00 LT; the blue detected.
column records days when first BS appeared between 22:00 and 23:00
LT; days in the red column are those on which the time of first BS was rence characteristics of BSEPBs.
between 23:00 and 24:00 LT; the yellow column gives days on which
In addition, the relationship between BSEPBs and solar activity is
the time of first BS was after midnight; the white portion of every
an issue worthy of discussion. Based on the statistical results
column records the subset of days on which geomagnetic-
presented in Section 3, solar activity appears to affect the occur-
disturbance was observed.
rence characteristic of BSEPBs. A number of studies have found
that solar activity can affect EPB occurrence (Tsunoda, 1985; Su SY
developed in the unstable wall of EPBs and caused BSs to develop.
et al., 2006, 2007). Incidence rates of EPBs usually change with sol-
Huba et al. (2008) used a 2-D simulation code to show that mul-
ar activity: there is higher incidence of EPBs during high solar
tiple BS can be caused by secondary instabilities. Yokoyama et al.
activity years (Huang CY et al., 2002; Stolle et al., 2006). But the re-
(2014) used a three-dimensional high-resolution numerical model
lationship between BSEPBs and solar activity has not been well
to produce BS processes caused by secondary instabilities, sug-
understood. Our study indicates that the occurrence of BS is re-
gesting that secondary instabilities play an important role in the
lated to solar activity. An obvious increase in total days of all EPBs
development of BSEPBs. Growth of secondary instabilities was af- with BS was observed in 2014, the year in which solar cycle 24
fected by many factors, such as magnetic field, electric field, and reached its maximum. Moreover, that proportion had been rising
density gradient (Kelley, 2009). Although many simulations have each year from 2012 to 2014, and fell from its 2014 peak in 2015
produced BSs by using secondary instabilities, it is difficult to and again in 2016. The occurrences of BS varieties were similar to
measure empirically these secondary instabilities associated with the year varieties of solar flux. In other words, occurrence of vari-
EPBs. Moreover, in these simulations, secondary instabilities asso- ous BSEPB structures appear to be affected by solar activity. High
ciated with EPB were a main reason for triggering the BS. We thus solar activity can effect the ionosphere environment, thereby con-
propose to use the characteristics of BS to study the complexity tributing to occurrences of BSEPB. During high solar activity, the
and stability of an EPB case; in other words, the occurrence of BS bottom altitude of the ionosphere usually is higher than when sol-
can be used to predict the intensity of the hard-to-observe sec- ar activity is lower (Vichare and Richmond, 2005; Fejer et al.,
ondary instabilities associated with EPBs and the stability strength 2008a; Stolle et al., 2008; Su SY et al., 2008). Solar activity favors
of EPBs, which means that it is important to understand the occur- the growth of instabilities, which promote the occurrence of
Wu K and Xu JY et al.: Occurrence characteristics of branching structures in equatorial plasma bubbles412 Earth and Planetary Physics doi: 10.26464/epp2021044
Table 3. BS types were obtained from Qujing and Fuke.
Days on which various BSs
Year Total BS days Two-BS days Three-BS days Multi-BS days Station
were observed simultaneously
2012 17(9) 14(8) 8(3) 0 5(2)
2013 21(3) 16(2) 12(1) 0 7(0)
2014 53(5) 46(5) 22(1) 9(1) 25(2)
2015 18(5) 16(3) 11(2) 1(0) 9(0) Qujing
2016 6(2) 4(1) 2(1) 0 0
2017 0 0 0 0 0
2018 0 0 0 0 0
2012 0 0 0 0 0
2013 39(7) 26(5) 21(2) 0 8(0)
2014 87(29) 57(16) 45(13) 16(8) 31(8)
2015 33(15) 26(13) 13(5) 2(0) 8(3) Fuke
2016 21(6) 17(3) 8(5) 0 4(2)
2017 9(2) 7(2) 5(2) 0 3(2)
2018 7(4) 5(2) 3(2) 0 1(0)
Note: BS=branching structure; EPB=equatorial plasma bubble. Numbers in brackets represent the subset of geomagnetically disturbed days in
each category.
BSEPBs. Since the appearance of BS is a common part of EPB evol- data from 2001−2004, that the highest occurrence of EPBs in
ution, the factors beneficial to occurrence of EPBs are also advant- those years appeared between 21:00 and 22:00 LT. Xiong C et al.
ageous for increased BS inducement. Significantly more vertical (2010), using data from CHAMP and GRACE, also found an EPB oc-
drifts of the F region are observed in years of high solar activity currence peak between 21:00 and 22:00 LT. In summary, observa-
than in years of lower solar activity (Fejer et al., 1979; Batista et al., tions of EPBs and of EPBS with branching structure both peak in
1996; Abdu et al., 2006). Many studies have shown that the occur- the same time interval. Interestingly, instances of first BSEPB after
rence of EPBs is linearly correlated with nighttime equatorial up- midnight were observed primarily during the high solar activity
ward plasma drift (Vichare and Richmond, 2005; Fejer et al., year, 2014, suggesting that high solar activity may restrain the
2008a). Stronger upward plasma drift during a solar maximum starting time of BS in some EPBs.
should cause a higher incidence rate of BSEPBs. Besides, due to
An important aspect of BS is the relationship between occurrence
larger electron densities and temperatures, instability is more
of BSEPB and geomagnetic activity. Some previous studies have
likely to occur in those EPBs, which suggests that EPBs should be
reported that the occurrence of EPBs is affected by geomagnetic
more prone to a complex structure during solar maximums; that
activity (e.g., Abdu et al., 2003; Keskinen et al., 2006; Sahai et al.,
is, we can expect a higher incidence rate of BSEPB. Various BS
2009; Patra et al., 2016; Aa et al., 2018). Geomagnetic storms can
forms of EPB indicate the complexity of EPB. It is a highly complex
cause equatorial ionospheric variations by Prompt Penetrating
EPB case when there are two or more branches (three-branch
Electric Fields (PPEF) and Disturbance Dynamo Electric Fields
structure and multi-branch – more than three branches). The stat-
(DDEF), which are supposed to cause EPBs (Kelley et al., 1979;
istical results presented in Figure 5 showed that complex EPB
Richmond et al., 2003). Results presented in Figure 3 confirm that
events were related to solar activity; note that the multi-branch
BS was observed on most EPB days characterized by strong geo-
structure appeared only in the year of highest solar activity, and
magnetic disturbances. Occurrence of BSEPBs can be expected,
that the days of coexistence of various BSEPB structures increased
also, to correlate with geomagnetic activity because BS is a com-
obviously during that year (2014). These results also indicate a re-
mon feature of the evolution of EPBs. Table 4 and Figure 6 illus-
lationship between BSEPB and solar activity.
trate this observation. In storm time, increases in the hourly AE in-
As for evidence of a relationship between occurrence of BSEPBs dices and long-lasting AE indices can be used to indicate PPEF and
and local time, Figure 4 demonstrates that the BSEPB occurrence DDEF (Ahn et al., 1992; Fejer et al., 2008b; Kelley, 2009). Using the
changed with local time. The first BSEPB most often occurred after criterion from Fejer and Scherliess (1995), PPEF or DDEF may oc-
20:00 LT but it could occur at any time during the lifetime of a giv- cur when an hourly variation of AE indices is greater than 125 nT,
en EPB. The largest number of first appearances of branching was or a four hours’ average is greater than 300 nT on a geomagnetic
observed between 21:00 and 22:00 LT, the frequency of occur- disturbed day. When AE indices satisfy the above criterion during
rence gradually decreasing after 22:00 LT except for the year 2014. the evolution of an EPB, we defined the disturbed day as a dis-
This result is similar to the pattern of occurrence characteristic of turbed AE day. In Figure 6, EPBs show BS on most of the disturbed
EPBs versus local time. Stolle et al. (2006) report, using CHAMP AE days, indicating that PPEF or DDEF caused by the geomagnet-
Wu K and Xu JY et al.: Occurrence characteristics of branching structures in equatorial plasma bubblesEarth and Planetary Physics doi: 10.26464/epp2021044 413
Table 4. BS occurrence in disturbed AE days.
Year Total disturbed days with EPB Total disturbed days without BS Total disturbed days with BS Station
2012-2018 30(25) 6(2) 24(23) Qujing
2012-2018 72(62) 9(2) 63(60) Fuke
Note: BS=branching structure; EPB=equatorial plasma bubble. Numbers in brackets represent geomagnetically disturbed AE days
corresponding to each category.
from two all-sky imagers to investigate detailed occurrence char-
Observation of Qujing station acteristics of branching structures of EPB. The main findings can
50
(a) Total disturbed days in EPB days
be summarized as follows:
Total no BS days in disturbed days
40 Total BS days in disturbed days
Disturbed AE days (1) Branching structure is a high occurrence phenomenon during
Number of days
the evolution of EPBs; most are observed to branch. However, not
30
all EPBs are observed to develop branching.
(2) Occurrence characteristics of branching structures are related
20
to solar activity. The number of EPB days on which EPB branching
was observed increased significantly during high solar activity (for
10
example, in 2014), especially the number of days on which all
EPBs were observed to exhibit branching.
0
2012—2018 2012—2018 2012—2018 (3) Time of branching occurrence varied with local time. Also, al-
though within the aggregated data for the entire seven-year peri-
Observation of Fuke station
100 od the most common time interval in which a day’s first branch-
(b) Total disturbed days in EPB days
Total no BS days in disturbed days
ing structure appeared was 21:00 to 22:00 LT, during the solar
80 Total BS days in disturbed days maximum year (2014), first EPB branching structures were ob-
Disturbed AE days
served to be delayed on some days until after midnight.
Number of days
60 (4) In some EPBs, more than one form of branching structure was
observed to occur in the course the EPB’s evolution, such as two-
40 branch structure, three-branch structure and multi-branch (more
than three branches) structure. Two-branch and three-branch
20 structures appeared most frequently; multi-branch structure ap-
peared only in the high solar activity year, during which instances
0 of branching structure coexistence were also observed to in-
2012—2018 2012—2018
crease significantly.
(5) Branching structure may be related to EPB stability. During
Figure 6. Statistical results of BS occurrence in disturbed AE days at
high solar activity, there is poor stability in EPBs, especially
Qujing station (a) and Fuke station (b). The black column presents
between 21:00−22:00 LT.
total disturbed days with EPB; the gray, total disturbed days without
BS; the green column, total disturbed days with BS; the white column,
the subset of total disturbed AE days in each category. Acknowledgments
We acknowledge the use of data from the Chinese Meridian
ic activity affects the occurrence frequency of BSEPB. Project. This work was supported by the Youth Science and Tech-
nology Innovation Foundation of NSSC, the International Partner-
Occurrence of BSEPB should be affected by disturbance winds
ship Program of Chinese Academy of Sciences (183311KYSB-
and westward winds during geomagnetic disturbances. During
20200003), the National Natural Science Foundation of China
disturbance geomagnetic activity, the winds are observed to be
mainly westward at low latitudes (Xiong C et al., 2015). When the (41831073 and 42004138), and the Open Research Project of
wind blows westward, the wind-induced Pedersen current flows Large Research Infrastructures of CAS – “Study on the interaction
downward, and gradient-drift instability can occur at the eastern between low/mid-latitude atmosphere and ionosphere based on
wall of EPB, where the plasma density gradient is eastward. Mean- the Chinese Meridian Project”. The airglow data were down-
while, due to the Coriolis force, the enhanced equatorward wind loaded from http://data.meridianproject.ac.cn/. The Dst, Kp, and
at disturbed periods also will have a westward component that F10.7 data were obtained from the OMNIWeb (https://omniweb.gs-
will work on the eastward wall of EPB, causing secondary instabil- fc.nasa.gov/).
ities. Similar findings of BSEPB from secondary instabilities have
been reported by Makela et al. (2006), instabilities caused by dis- References
turbance winds and westward winds associated with increased Aa, E., Huang, W. G., Liu, S. Q., Ridley, A., Zou, S. S., Shi, L. Q., Chen, Y. H., Shen, H.,
geomagnetic activity. Yuan, T. J., … Wang. T. (2018). Midlatitude plasma bubbles over China and
adjacent areas during a magnetic storm on 8 September 2017. Space Wea.,
16(3), 321–331. https://doi.org/10.1002/2017SW001776
5. Summary Abdu, M. A., Batista, I. S., Takahashi, H., MacDougall, J., Sobral, J. H., Medeiros, A.
In this study, we used seven-years (2012−2018) of observations F., and Trivedi, N. B. (2003). Magnetospheric disturbance induced equatorial
Wu K and Xu JY et al.: Occurrence characteristics of branching structures in equatorial plasma bubbles414 Earth and Planetary Physics doi: 10.26464/epp2021044
plasma bubble development and dynamics: a case study in Brazilian sector. https://doi.org/10.1007/s11214-011-9816-6
J. Geophys. Res.: Space Phys., 108(A12), 1449. Mendillo, M., and Baumgardner, J. (1982). Airglow characteristics of equatorial
https://doi.org/10.1029/2002ja009721 plasma depletions. J. Geophys. Res.: Space Phys., 87(A9), 7641–7652.
Abdu, M. A., Batista, I. S., Reinisch, B. W., Sobral, J. H. A., and Carrasco, A. J. https://doi.org/10.1029/JA087iA09p07641
(2006). Equatorial F region evening vertical drift, and peak height, during Mendillo, M., and Tyler, A. (1983). Geometry of depleted plasma regions in the
southern winter months: a comparison of observational data with the IRI equatorial ionosphere. J. Geophys. Res.: Space Phys., 88(A7), 5778–5782.
descriptions. Adv. Space Res., 37(5), 1007–1017. https://doi.org/10.1029/JA088iA07p05778
https://doi.org/10.1016/j.asr.2005.06.074 Ossakow, S. L. (1981). Spread-F theories—a review. J. Atmos. Terr. Phys., 43(5-6),
Aggson, T. L., Laakso, H., Maynard, N. C., and Pfaff, R. F. (1996). In situ 437–452. https://doi.org/10.1016/0021-9169(81)90107-0
observations of bifurcation of equatorial ionospheric plasma depletions. J. Ott, E. (1978). Theory of Rayleigh-Taylor bubbles in the equatorial ionosphere. J.
Geophys. Res.: Space Phys., 101(A3), 5125–5132. Geophys. Res.: Space Phys., 83(A5), 2066–2070.
https://doi.org/10.1029/95ja03837 https://doi.org/10.1029/ja083ia05p02066
Ahn, B. H., Kamide, Y., Kroehl, H. W., and Gorney, D. J. (1992). Cross-polar cap Patra, A. K., Chaitanya, P. P., Dashora, N., Sivakandan, M., and Taori, A. (2016).
potential difference, auroral electrojet indices, and solar wind parameters. J. Highly localized unique electrodynamics and plasma irregularities linked
Geophys. Res.: Space Phys., 97(A2), 1345–1352. with the 17 March 2015 severe magnetic storm observed using
https://doi.org/10.1029/91JA02432 multitechnique common-volume observations from Gadanki, India. J.
Batista, I. S., de Medeiros, R. T., Abdu, M. A., de Souza, J. R., Bailey, G. J., and de Geophys. Res.: Space Phys., 121(11), 11518–11527.
Paula, E. R. (1996). Equatorial ionospheric vertical plasma drift model over https://doi.org/10.1002/2016JA023384
the Brazilian region. J. Geophys. Res.: Space Phys., 101(A5), 10887–10892. Richmond, D. A., Peymirat, C., and Roble, R. G. (2003). Long-lasting disturbances
https://doi.org/10.1029/95ja03833 in the equatorial ionospheric electric field simulated with a coupled
Fejer, B. G., Farley, D. T., Woodman, R. F., and Calderon, C. (1979). Dependence magnetosphere-ionosphere-thermosphere model. J. Geophys. Res.: Space
of equatorial F region vertical drifts on season and solar cycle. J. Geophys. Phys., 108(A3), 1118. https://doi.org/10.1029/2002JA009758
Res.: Space Phys., 84(A10), 5792–5796. Sahai, Y., Becker-Guedes, F., Fagundes, P. R., de Jesus, R., de Abreu, A. J., Otsuka,
https://doi.org/10.1029/JA084iA10p05792 Y., Shiokawa, K., Igarashi, K., Yumoto, K., … Bittencourt, J. A. (2009). Effects
Fejer, B. G., and Scherliess, L. (1995). Time dependent response of equatorial observed in the ionospheric F region in the east Asian sector during the
ionospheric electric fields to magnetospheric disturbances. Geophys. Res. intense geomagnetic disturbances in the early part of November 2004. J.
Lett., 22(7), 851–854. https://doi.org/10.1029/95GL00390 Geophys. Res.: Space Phys., 114(A3), A00A18.
Fejer, B. G., Jensen, J. W., and Su, S. Y. (2008a). Quiet time equatorial F region https://doi.org/10.1029/2008JA013053
vertical plasma drift model derived from ROCSAT-1 observations. J. Stolle, C., Lühr, H., Rother, M., and Balasis, G. (2006). Magnetic signatures of
Geophys. Res.: Space Phys., 113(A5), A05304. equatorial spread F as observed by the CHAMP satellite. J. Geophys. Res.:
https://doi.org/10.1029/2007JA012801 Space Phys., 111(A2), A02304. https://doi.org/10.1029/2005JA011184
Fejer, B. G., Jensen, J. W., and Su, S. Y. (2008b). Seasonal and longitudinal Stolle, C., Lühr, H., and Fejer, B. G. (2008). Relation between the occurrence rate
dependence of equatorial disturbance vertical plasma drifts. Geophys. Res. of ESF and the equatorial vertical plasma drift velocity at sunset derived
Lett., 35(20), L20106. https://doi.org/10.1029/2008GL035584 from global observations. Ann. Geophys., 26(12), 3979–3988.
Garcia, F. J., Taylor, M. J., and Kelley, M. C. (1997). Two-dimensional spectral https://doi.org/10.5194/angeo-26-3979-2008
analysis of mesospheric airglow image data. Appl. Opt., 36(29), 7374–7385. Su, S. Y., Liu, C. H., Ho, H. H., and Chao, C. K. (2006). Distribution characteristics of
https://doi.org/10.1364/ao.36.007374 topside ionospheric density irregularities: equatorial versus midlatitude
Huang, C. Y., Burke, W. J., Machuzak, J. S., Gentile, L. C., and Sultan, P. J. (2002). regions. J. Geophys. Res.: Space Phys., 111(A6), A06305.
Equatorial plasma bubbles observed by DMSP satellites during a full solar https://doi.org/10.1029/2005JA011330
cycle: toward a global climatology. J. Geophys. Res.: Space Phys., 107(A12), Su, S. Y., Chao, C. K., Liu, C. H., and Ho, H. H. (2007). Meridional wind effect on
1434. https://doi.org/10.1029/2002ja009452 anti-solar activity correlation of equatorial density irregularity distribution. J.
Huba, J. D., Joyce, G., and Krall, J. (2008). Three-dimensional equatorial spread F Geophys. Res.: Space Phys., 112(A10), A10305.
modeling. Geophys. Res. Lett., 35(10), L10102. https://doi.org/10.1029/2007ja012261
https://doi.org/10.1029/2008GL033509 Su, S. Y., Chao, C. K., and Liu, C. H. (2008). On monthly/seasonal/longitudinal
Kelley, M. C., Fejer, B. G., and Gonzales, C. A. (1979). An explanation for variations of equatorial irregularity occurrences and their relationship with
anomalous equatorial ionospheric electric fields associated with a the postsunset vertical drift velocities. J. Geophys. Res.: Space Phys., 113(A5),
northward turning of the interplanetary magnetic field. Geophys. Res. Lett., A05307. https://doi.org/10.1029/2007JA012809
6(4), 301–304. https://doi.org/10.1029/GL006i004p00301 Tsunoda, R. T., Livingston, R. C., McClure, J. P., and Hanson, W. B. (1982).
Kelley, M. C. (2009). The Earth’s Ionosphere: Plasma Physics and Electrodynamics Equatorial plasma bubbles: vertically elongated wedges from the
(2nd ed). San Diego: Academic Press. bottomside F layer. J. Geophys. Res.: Space Phys., 87(A11), 9171–9180.
Keskinen, M. J., Ossakow, S. L., Fejer, B. G., and Emmert, J. (2006). Evolution of https://doi.org/10.1029/ja087ia11p09171
equatorial ionospheric bubbles during a large auroral electrojet index Tsunoda, R. T. (1985). Control of the seasonal and longitudinal occurrence of
increase in the recovery phase of a magnetic storm. J. Geophys. Res.: Space equatorial scintillations by the longitudinal gradient in integrated E region
Phys., 111(A2), A02303. https://doi.org/10.1029/2005ja011352 pedersen conductivity. J. Geophys. Res.: Space Phys., 90(A1), 447–456.
Li, G. Z., Ning, B. Q., Patra, A. K., Wan, W. X., and Hu, L. H. (2011). Investigation of https://doi.org/10.1029/JA090iA01p00447
low-latitude E and valley region irregularities: their relationship to Vichare, G., and Richmond, A. D. (2005). Simulation study of the longitudinal
equatorial plasma bubble bifurcation. J. Geophys. Res.: Space Phys., 116(A11), variation of evening vertical ionospheric drifts at the magnetic equator
A11319. https://doi.org/10.1029/2011JA016895 during equinox. J. Geophys. Res.: Space Phys., 110(A5), A05304.
Makela, J. J., Kelley, M. C., and Nicolls, M. J. (2006). Optical observations of the https://doi.org/10.1029/2004JA010720
development of secondary instabilities on the eastern wall of an equatorial Woodman, R. F., & Hoz, C. L. (1976). Radar observations of f region equatorial
plasma bubble. J. Geophys. Res.: Space Phys., 111(A9), A09311. irregularities. J. Geophys. Res.: Space Phys., 81(31).
https://doi.org/10.1029/2006JA011646 https://doi.org/10.1029/JA081i031p05447
Makela, J. J., and Otsuka, Y. (2012). Overview of nighttime ionospheric Wu, K., Xu, J. Y., Wang, W. B., Sun, L. C., Liu, X., and Yuan, W. (2017). Interesting
instabilities at low-and mid-latitudes: coupling aspects resulting in equatorial plasma bubbles observed by all-sky imagers in the equatorial
structuring at the mesoscale. Space Sci. Rev., 168(1-4), 419–440. region of China. J. Geophys. Res.: Space Phys., 122(10), 10596–10611.
Wu K and Xu JY et al.: Occurrence characteristics of branching structures in equatorial plasma bubblesEarth and Planetary Physics doi: 10.26464/epp2021044 415
https://doi.org/10.1002/2017ja024561 Xiong, C., Park, J., Lühr, H., Stolle, C., and Ma, S. Y. (2010). Comparing plasma
Wu, K., Xu, J. Y., Xiong, C., and Yuan, W. (2018). Edge plasma enhancements of bubble occurrence rates at CHAMP and GRACE altitudes during high and
equatorial plasma depletions observed by all-sky imager and the C/NOFS low solar activity. Ann. Geophys., 28(9), 1647–1658.
satellite. J. Geophys. Res.: Space Phys., 123(10), 8835–8849. https://doi.org/10.5194/angeo-28-1647-2010
https://doi.org/10.1029/2018ja025809 Xiong, C., Lühr, H., and Fejer, B. G. (2015). Global features of the disturbance
Wu, K., Xu, J. Y., Yue, X. N., Xiong, C., Wang, W. B., Yuan, W., Wang, C., Zhu, Y. J., winds during storm time deduced from CHAMP observations. J. Geophys.
and Ji, L. (2020). Equatorial plasma bubbles developing around sunrise Res.: Space Phys., 120(6), 5137–5150. https://doi.org/10.1002/2015JA021302
observed by an all-sky imager and global navigation satellite system Yokoyama, T., Shinagawa, H., and Jin, H. (2014). Nonlinear growth, bifurcation,
network during storm time. Ann. Geophys., 38(1), 163–177. and pinching of equatorial plasma bubble simulated by three-dimensional
https://doi.org/10.5194/angeo-38-163-2020 high-resolution bubble model. J. Geophys. Res.: Space Phys., 119(12),
Wu, K., Xu, J. Y., Wang, W. B., Sun, L. C., and Yuan, W. (2021). Interaction of 10474–10482. https://doi.org/10.1002/2014JA020708
oppositely traveling medium-scale traveling ionospheric disturbances Zalesak, S. T., Ossakow, S. L., and Chaturvedi, P. K. (1982). Nonlinear equatorial
observed in low latitudes during geomagnetically quiet nighttime. J. spread F: the effect of neutral winds and background Pedersen
Geophys. Res.: Space Phys., 126(2), e2020JA028723. conductivity. J. Geophys. Res.: Space Phys., 87(A1), 151–166.
https://doi.org/10.1029/2020JA028723 https://doi.org/10.1029/JA087iA01p00151
Wu K and Xu JY et al.: Occurrence characteristics of branching structures in equatorial plasma bubblesYou can also read