Exploring Topics of Interest of Mendeley Users - Journal of Altmetrics
←
→
Page content transcription
If your browser does not render page correctly, please read the page content below
Zahedi, Z., & van Eck, N. J. (2018). Exploring Topics
of Interest of Mendeley Users. Journal of Altmetrics,
1(1): 5. DOI: https://doi.org/10.29024/joa.7
RESEARCH
Exploring Topics of Interest of Mendeley Users
Zohreh Zahedi and Nees Jan van Eck
Centre for Science and Technology Studies (CWTS), Leiden University, NL
Corresponding author: Zohreh Zahedi (z.zahedi.2@cwts.leidenuniv.nl)
This paper presents a fine-grained overview of the usage behavior and topics of interest of different
types of users in Mendeley. The analysis is based on 1.2 million Web of Science indexed publications
published in 2012. The disciplinary differences in the reading (saving) patterns of different types of
Mendeley users are identified and depicted using VOSviewer overlay visualizations. The findings show
that compared to other fields, publications from Mathematics & Computer Science have the lowest
coverage in Mendeley. Publications from the Social Sciences & Humanities receive on average the highest
number of readers in Mendeley. The highest uptake of Mendeley is by students, but this differs across
fields. Professors, students, and librarians are mainly active in the Social Sciences & Humanities, a field
of science with a relatively low citation density in Web of Science. In contrast, researchers and other
professionals are mainly active in fields with a relatively high citation density such as the Biomedical &
Health Sciences and the Life & Earth Sciences. In addition, it seems that researchers and professionals
are relatively more interested in practical, methodological, and technical oriented topics while professors
and students are attracted by the more educational and theoretical oriented topics. These different usage
patterns among user types possibly reflect the way in which scholarly publications are used for scientific,
educational, or other professional purposes. This information could inform relevant stakeholders, such as
researchers, librarians, publishers, funders, and policy makers of the scientific, educational, or professional
values of publications.
Keywords: Altmetrics; Fields of science; Mendeley; Publication-level classification; Readership statistics;
Topics; user behaviour; Visualization; VOSviewer
Introduction and Background
The social reference manager tool Mendeley is a prevalent source of altmetric data. It is known that the coverage,
density, and distribution of Mendeley readership1 varies substantially across disciplines (Costas, Zahedi, & Wouters
2015a). Depending on the field, Mendeley covers 45% to 90% of the publications in the Scopus database (Thelwall &
Sud 2016), 60% to 90% of the publications in the Web of Science (WoS) database (Zahedi, Costas & Wouters 2017), and
more than 80% of the publications published by PLOS (Priem, Piwowar & Hemminger 2012). Fields from the Social
Sciences & Humanities (such as Sociology, Communication, Business, Psychology, Anthropology, Educational Research,
and Linguistics) have a relatively high coverage and a relatively high number of readers in Mendeley (Costas, Zahedi &
Wouters 2015b; Hammarfelt 2014; Mohammadi & Thelwall 2014). In contrast, fields from Mathematics & Computer
Science (such as Analysis, Algebra and Number Theory, Geometry and Topology) show a relatively low coverage and a
relatively low number of readers (Thelwall 2017; Zahedi, Costas & Wouters 2014). Moreover, readership and citation
counts per publication have similar skewed distributions across different fields of science (Costas et al. 2016). Hence
similar to citations, normalization approaches for correcting field differences for Mendeley readership have been sug-
gested (Costas Perianes-Rodríguez & Ruiz-Castillo 2017; Haunschild & Bornmann 2016).
In some previous studies, the readership activity of Mendeley users has been analyzed based on the self-declared
academic disciplines of users. For example, co-readership based on the publications in the libraries of users and the
self-declared academic disciplines of users have been used to measure and depict the similarity of subject areas within
the field of Educational Technology (Kraker et al. 2015). The analysis of the network of co-readers in Mendeley also
showed that students and postdocs in Mendeley have more common topical interests than other types of users in
1
The act of saving a document by different users in Mendeley is commonly known as ‘readership’ and therefore the same terminol-
ogy is used in this paper to refer to this activity. Even though it does not always mean that the user who has ‘saved’ the document
in his/her own private library has already read the document or vice versa.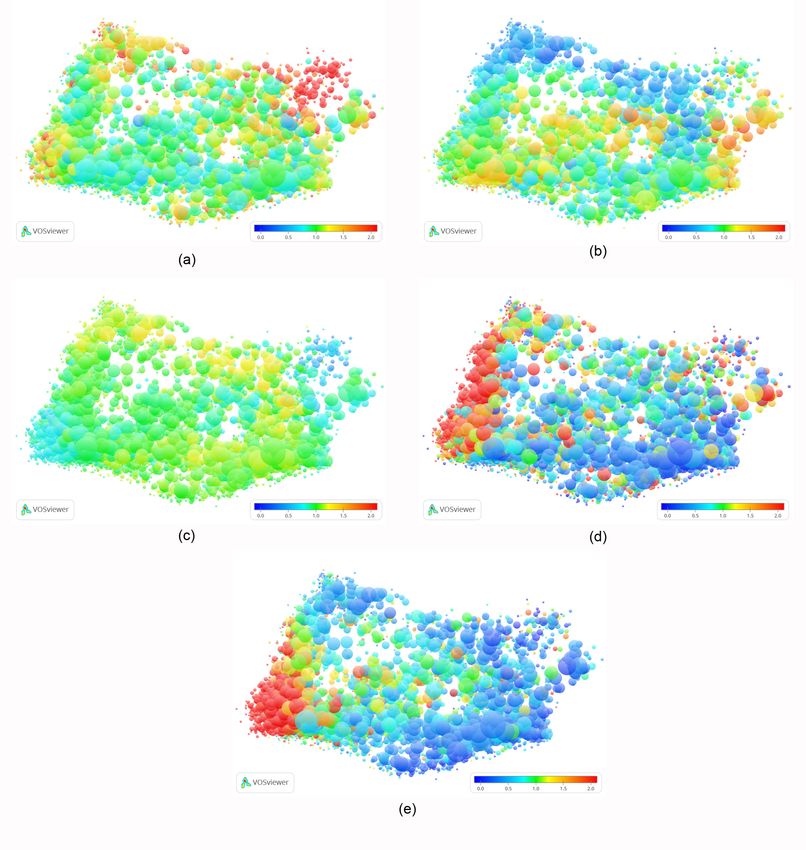
Art. 5, page 2 of 12                                               Zahedi and van Eck: Exploring Topics of Interest of Mendeley Users

Mendeley (Haunschild Bornmann & Leydesdorff 2015). In other studies, existing field classification systems have been
used to compare readership between different types of users across different fields of science. The readership activity
of Mendeley users has, for instance, been analyzed using the 5 main disciplines and 22 sub-disciplines from the NSF
classification system (Haustein & Larivière 2014; Mohammadi et al. 2015), the 250 subject categories available in the
WoS database (Zahedi & Van Eck 2015), and the 310 subject areas available in the Scopus database (Thelwall 2017). The
results of these studies show that substantial differences in readership practices between (sub)fields and user types
exist. Moreover, the extent to which the number of readers correlates with the number of citations varies across differ-
ent (sub)fields and between user types.
   Most of the previous studies are based on restricted Mendeley data (only top three user types per publication) and
focus on broad fields of science. It is not known yet how readership per user type varies across detailed micro-level
fields and how these user types differ in their topics of interest. This is the first large scale and systematic analysis of
readership activity across detailed micro-level fields in which complete data on the readership activities of Mendeley
users is taken into account. Also, in addition to the overall readership activities of Mendeley users, the relative activity
of different types of Mendeley users has been considered in this study. In this way, we have been able to uncover the
topics on which different types of users focus relatively strongly. Moreover, a new view on readership statistics has been
introduced by looking at the number of readers of publications normalized by the number of citations received by those
publications. Combining these different usage statistics and patterns among user types provides insight into the way
in which scholarly publications are used for scientific, educational, training, and other practical purposes. In this way,
readership statistics could be used by relevant stakeholders (researchers, librarians, publishers, funders, policy makers,
etc.) to get more insight into the full impact of scholarly publications. Hence, to determine whether information from
Mendeley would be helpful in this respect, we will address the following main research questions in this paper:

      1. What is the overall and relative readership activity of different types of Mendeley users across research fields? In
         which research fields are the different types of Mendeley users relatively most and least active?
      2. What are the topics of interest within research fields? Are there any differences between Mendeley user types?
         Could such differences reflect different types of usage of scholarly publications?

This paper is organized as follows. We first describe our dataset and analysis methods. Results are then reported. The
paper concludes with a summary, a discussion of some key observations, and suggestions for additional work.

Data and Methodology
This study is based on a dataset of 1,196,226 publications collected from the WoS database. The dataset includes all
publications of the document types ‘article’ and ‘review’ published in 2012 with a Digital Object Identifier (DOI).2 The
DOIs of the collected publications were used to retrieve readership data from Mendeley by using the Mendeley REST API
in July 2016.3 This readership data also includes information on the ‘academic status’ of users as indicated by the users
in their Mendeley profile.4 To minimize the effect of national and disciplinary differences between the designations of
academic and professional appointments and positions, users were grouped into five broad user types. Based on their
‘academic status’, users were grouped into the following user types:

  •    Students: students (Bachelor), students (Master), students (postgraduate), doctoral students, and PhD students.
  •    Researchers: postdocs, researchers (at non-academic institutions), and researchers (at academic institutions).
  •    Professors: assistant professors, associate professors, professor, lecturers, and senior lecturers.
  •    Librarians: librarians or other library professionals.
  •    Other professionals: other professionals (including medical doctors, nurses, nutritionists, lawyers, etc.).

For each publication, readership counts for all users and readership counts for individual user types were calculated.
Citations were counted until the end of week 26 (July) of 2016 using the in-house version of the WoS database of the
Centre for Science and Technology Studies of Leiden University.
  The publications in the dataset have been assigned to 4,113 micro-level fields and to five main fields of science.
The 4,113 micro-level fields have been constructed algorithmically based on 282.4 million citation relations between
17.8 million publications from the period 2000–2015 indexed in the WoS database (Waltman & Van Eck 2012). The

  2
      About 13% of the 2012 WoS indexed articles and reviews do not have a DOI and are therefore excluded from the analysis.
  3
      It is suggested in the literature (Zahedi, Haustein & Bowman, 2014) that the best strategy to retrieve readership data using the
      Mendeley API is to perform searches which are based on a combination of DOIs and article titles. In this paper, however, we have
      chosen to search and match publications based on DOI only in order to keep our data collection accurate and transparent. Match-
      ing based on DOI only may lead to missed matches but will avoid wrong matches.
  4
      The ‘academic status’ is self-declared by Mendeley users. It therefore may happen that users forget to update or simply do not
      update their ‘academic status’ in their Mendeley profile when it has been changed, e.g., due to a job change or promotion. This
      should be kept in mind while interpreting the results of this study.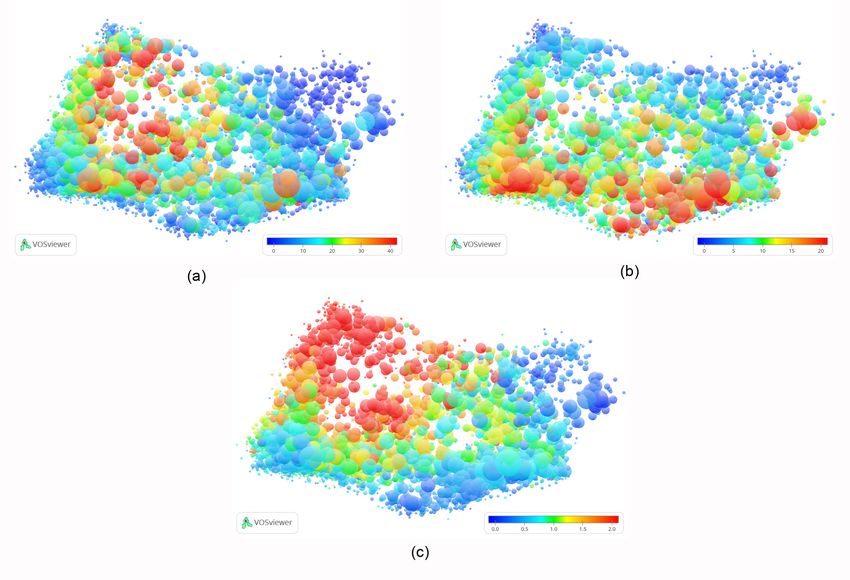
Zahedi and van Eck: Exploring Topics of Interest of Mendeley Users                                         Art. 5, page 3 of 12

definitions used in the 2016 version of the CWTS Leiden Ranking5 have been used to aggregate the 4,113 micro-level
fields into five main fields of science. Table 1 provides the number of publications in our dataset assigned to each of
the five main fields of science.
   Figure 1 shows a visualization that provides an overview of the 4,113 micro-level fields and the five main fields of
science used in this study. Each circle represents a micro-level field. The size of a circle indicates the number of publica-
tions in our dataset in a micro-level field. The larger the circle, the larger the number of publications in our dataset. The
distance between two circles approximately indicates the relatedness of two micro-level fields, where the relatedness
is determined by citation relations between the fields. In general, the smaller the distance between two circles, the
stronger the micro-level fields are related to each other. The color of a circle indicates the main field to which a micro-
level field belong. The color coding and positioning of the main fields is as follows. Mathematics & Computer Science
(purple) are located in the top-right, the Physical Sciences & Engineering (blue) are located in the bottom-right, the Life
& Earth Sciences (yellow) are located in the center, the Biomedical & Health Sciences (green) are located in the bottom-
left, and the Social Sciences & Humanities (red) are located in the top-left in the visualization.
   The 4,113 micro-level fields and the five main fields of science enabled us to analyze readership activity in Mendeley
at different levels of granularity. In order to analyze readership activity from different perspectives and to allow for ana-
lyzing differences between research fields and user types, the following statistics have been calculated for each of the
micro-level fields and main fields of science:

  • Publications: Number of publications.
  • Mendeley coverage (all users/user type): Total number and percentage of publications saved by all Mendeley users
    or a specific Mendeley user type.

Table 1: Description of the dataset.

                                                                             No. pub.
                                         All fields                          1,196,226
                                         Biomedical & Health Sciences            471,809
                                         Life & Earth Sciences                   172,260
                                         Mathematics & Computer Science           87,005
                                         Physical Sciences & Engineering         355,163
                                         Social Sciences & Humanities             91,953

Figure 1: Visualization of the CWTS publication-level classification system used in this study. Each circle represents one
  of the 4,113 micro-level fields. The size of a circle indicates the number of publications in our dataset in a micro-level
  field. The larger the circle, the larger the number of publications. The color of a circle indicates the main field to which
  a micro-level field belongs. The color coding is as follows: Biomedical & Health Sciences (green), Life & Earth Sciences
  (yellow), Mathematics & Computer Science (purple), Physical Sciences & Engineering (blue), and Social Sciences &
  Humanities (red).

 5
     See http://www.leidenranking.com/information/fields for more information.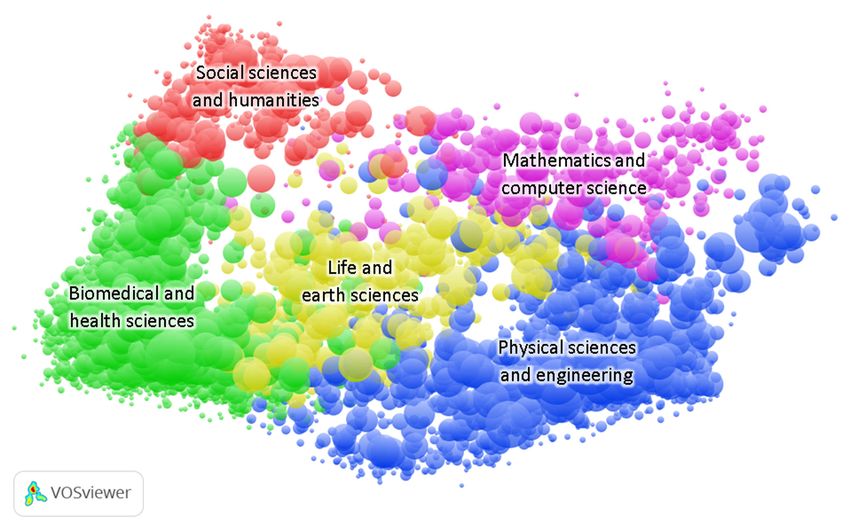
Art. 5, page 4 of 12 Zahedi and van Eck: Exploring Topics of Interest of Mendeley Users
• Citations (all users/user type): Total number and average number of citations of publications saved by all M endeley
users or a specific Mendeley user type.
• Readers (all users/user type): Total number and average number of readers per publication based on the activity of
all Mendeley users or a specific Mendeley user type.
• Normalized readers (all users/user type): Share of the number of readers based on the activity of all Mendeley users
or a specific Mendeley user type in a field divided by the share of the number of citations in a field.
• Relative activity (user type): Average number of readers per publication based on the activity of a specific Mendeley
user type divided by the average number of readers per publication based on the activity of all Mendeley users.
Visualizations providing overviews of the above described statistic at the level of 4,113 micro-level fields were con-
structed. The VOSviewer software tool (Van Eck & Waltman 2010) was used for this purpose. So-called overlay visualiza-
tions were constructed using version 1.6.6 of the VOSviewer software tool. These visualizations can be used to show
additional information on top of a base map (e.g. Leydesdorff & Rafols 2012; Van Eck et al. In this case, the visualization
of the 4,113 micro-level fields presented in Figure 1 was used as a base map. The constructed overlay visualizations
enabled us to analyze readership activity in Mendeley in a fine-grained way and to identify possible differences between
fields and user types.
Results
A number of different analyses were performed in order to answer the research questions stated in the introduction
of this paper. This section presents the results of these analyses. First, results on the coverage of publications by field
and user type are presented in order to provide a complete overview of the coverage of Mendeley. Then, results on the
readership activity in Mendeley by field and user type are presented. Finally, results on the topics of interest of Mende-
ley users are presented.
As already indicated in the Data and Methodology section, overlay visualizations of the 4,113 micro-level fields played
an important role in our analyses. In this section, static figures of the overlay visualizations are presented. The overlay
visualizations can also be explored interactively using the VOSviewer software tool.6 The interactive version of the
overlay visualizations is available online at https://goo.gl/CJVRzL. The interactive visualizations offer the possibility to
zoom in on a specific area in the visualizations and to explore in more detail the micro-level fields located in that area.
The interactive visualizations also offer additional information that is not visible in the static figures. By hovering the
mouse over a micro-level field, more detailed information on the field is presented.
Coverage of publications saved by Mendeley users across different fields
In this subsection, we analyze the coverage of our dataset in Mendeley. Table 2 presents the total number of publi-
cations in our dataset and the coverage of these publications in Mendeley. With coverage in Mendeley we mean the
percentage of publications with at least one reader in Mendeley. Table 2 also presents the breakdown of the coverage
by field and by user type. In Figure 2, the coverage of the 4,113 micro-level fields is visualized using VOSviewer overlay
visualizations. The coverage is shown for all Mendeley users (Figure 2a) and individual user types (Figure 2b, 2c, 2d,
2e, and 2f). As explained above, each circle represents a micro-level field. The size of a circle indicates the number of
publications in our dataset in a micro-level field. The larger the circle, the larger the number of publications. The color
of a circle indicates the percentage of publications in a micro-level field that is covered in Mendeley. The color ranges
from blue to green to red showing low, medium, and high coverage. The positions of the main fields are as explained
in the previous section.
As can be seen in Table 2 and Figure 2, publications from almost all fields are well covered in Mendeley. Publications
from the Biomedical & Health Sciences (96.3%) and the Life & Earth Sciences (95.7%) have the highest coverage in
Mendeley followed by those from the Social Sciences & Humanities (95.9%) and the Physical Sciences & Engineering
(90.2%). Publications from Mathematics & Computer Science have the lowest coverage (79.9%). This is also clearly vis-
ible in Figure 2a by looking at the top-right side of the visualization.
Considering user types, it is clear that students are very active in Mendeley. Table 2 shows that the coverage is the
highest for students (87.9%). This is followed by researchers (70.3%) and professors (63.6%). The lowest coverage is for
other professionals (33.2%) and librarians (10.0%). The order of user types regarding the coverage is identical in the
Biomedical & Health Sciences, the Life & Earth Sciences, and the Physical Sciences & Engineering. In Mathematics &
Computer Science and the Social Sciences & Humanities, slightly more publications are saved by Mendeley users clas-
sified as professors than those identified as researchers. If we look at the coverage at the more detailed level of micro-
level fields, we see that the visualization for students (Figure 2d) best resembles the general pattern based on all users
(Figure 2a). The visualizations for professors (Figure 2b) and researchers (Figure 2c) are fairly comparable. A lower
coverage can be observed for the peripheral micro-level fields and the micro-level fields from Mathematics & Computer
Science. The visualizations for librarians (Figure 2e) and other professionals (Figure 2f) are most different from the
6
Please note that Java needs to be installed on your computer in order to access the interactive overlay visualizations in VOSviewer.Table 2: Coverage of WoS publications in Mendeley.
All users Professors Researchers Students Librarians Other professionals
Total Covg. Total Covg. Total Covg. Total Covg. Total Covg. Total Covg.
All fields 1,108,574 92.7% 761,193 63.6% 840,955 70.3% 1,051,314 87.9% 119,276 10.0% 397,278 33.2%
Biomedical & Health Sciences 454,525 96.3% 323840 68.6% 371,405 78.7% 436,299 92.5% 63,908 13.5% 221,046 46.9%
Life & Earth Sciences 164,796 95.7% 123057 71.4% 140,964 81.8% 159,581 92.6% 18,812 10.9% 70,622 41.0%
Mathematics & Computer Science 69,524 79.9% 41773 48.0% 35,239 40.5% 61,389 70.6% 3,954 4.5% 11,227 12.9%
Physical Sciences & Engineering 320,342 90.2% 195276 55.0% 223,473 62.9% 299,027 84.2% 15,021 4.2% 59,974 16.9%
Social Sciences & Humanities 88,163 95.9% 72322 78.7% 65,566 71.3% 85,882 93.4% 16,769 18.2% 32,756 35.6%
Zahedi and van Eck: Exploring Topics of Interest of Mendeley Users
Art. 5, page 5 of 12Art. 5, page 6 of 12 Zahedi and van Eck: Exploring Topics of Interest of Mendeley Users Figure 2: VOSviewer overlay visualizations showing the coverage of WoS publications in Mendeley per micro-level field. The coverage is shown for (a) all Mendeley users, (b) professors, (c) researchers, (d) students, (e) librarians, and (f) other professionals. An interactive version of the overlay visualizations is available online at https://goo.gl/CJVRzL. general pattern (Figure 2a). Most micro-level fields show a relative low coverage for those user types. In the case of librarians, we see a somewhat higher coverage for micro-level fields at the intersection of the Biomedical & Health Sciences and the Social Sciences & Humanities. In the case of other professionals, micro-levels fields with the highest coverage are from the Biomedical & Health Sciences and the Life & Earth Sciences. Reader and citation counts of publications In this subsection, we analyze the reader counts and the citation counts of the publications in our dataset and we make comparisons across fields and between Mendeley user types. Table 3 presents the total and average number of readers per publication in Mendeley by main field and by Mendeley user type. Similarly, Table 4 presents the total and average number of citations per publication in WoS by main field and by Mendeley user type. Table 5 presents the normalized readership activity by main field and by Mendeley user type. Here, the number of readers in Mendeley are normalized by the number of citations in WoS. In Figure 3, the same statistics are presented at the level of the 4,113 micro-level fields using VOSviewer overlay visualizations. Each circle represents again a micro-level field and the size of a circle indicates the number of publications in our dataset in the corresponding micro-level field. The color of a circle indicates the aver- age number of readers per publication (Figure 3a), the average number of citations per publication (Figure 3b), and the normalized number of readers in a micro-level field (Figure 3c).
Table 3: Reader statistics (total number and average number of readers per publication in Mendeley).

                                                      All users            Professors           Researchers             Students            Librarians         Other professionals
                                                    Total      Avg.       Total       Avg.      Total       Avg.       Total       Avg.     Total     Avg.        Total        Avg.
              All fields                          21,018,929      19.0   2,564,289      3.4    4,228,402     5.0     13,253,718    12.6     155,441      1.3       813,505      2.0
              Biomedical & Health Sciences         9,324,273      20.5   1,124,167      3.5    2,048,169     5.5     5,569,493     12.8      84,078      1.3       496,042      2.2
              Life & Earth Sciences                4,033,234      24.5    447,990       3.6     920,281      6.5      2,489,761    15.6      22,858      1.2        151,851     2.2
              Mathematics & Computer Science        755,850       10.9     101,849      2.4      96,154      2.7       536,024      8.7       4,701      1.2         17,046     1.5
              Physical Sciences & Engineering      4,366,395      13.6    531,560       2.7     864,154      3.9     2,868,858      9.6      16,912      1.1        84,526      1.4
              Social Sciences & Humanities         2,482,076      28.2    349,830       4.8     290,637      4.4     1,753,882     20.4      25,809      1.5         61,632     1.9

Table 4: Citation statistics (total number and average number of citations per publication in WoS).

                                                      All users            Professors            Researchers              Students            Librarians           Professionals
                                                    Total         Avg.     Total      Avg.       Total       Avg.       Total       Avg.      Total      Avg.       Total      Avg.
              All fields                          12,689,428      11.4   10,645,127     14.0   11,367,502    13.5     12,474,552     11.9    1,907,387    16.0    6,739,679     17.0
              Biomedical & Health Sciences         5,822,784      12.8   5,000,332      15.4    5,390,883    14.5      5,744,959     13.2   1,079,625     16.9    3,905,394     17.7
                                                                                                                                                                                       Zahedi and van Eck: Exploring Topics of Interest of Mendeley Users

              Life & Earth Sciences                1,761,887      10.7    1,544,610     12.6    1,659,639     11.8     1,745,320     10.9     291,260     15.5    1,042,447    14.8
              Mathematics & Computer Science         400,029       5.8     293,746       7.0     261,607       7.4       376,936      6.1      30,541      7.7      102,194      9.1
              Physical Sciences & Engineering      4,140,132      12.9   3,280,621      16.8    3,545,982    15.9      4,046,573     13.5     350,178     23.3     1,355,217   22.6
              Social Sciences & Humanities           557,995       6.3     520,731       7.2     504,278       7.7       554,595      6.5     155,091      9.2      330,799    10.1
                                                                                                                                                                                       Art. 5, page 7 of 12
Art. 5, page 8 of 12 Zahedi and van Eck: Exploring Topics of Interest of Mendeley Users
Figure 3: VOSviewer overlay visualizations showing per micro-level field (a) the average number of readers in Mendeley,
(b) the average number of citations in WoS, and (c) the number of readers in Mendeley normalized by the number
of citations in WoS. An interactive version of the overlay visualizations is available online at https://goo.gl/CJVRzL.
Table 5: Normalized reader statistics (number of readers in Mendeley normalized by the number of citations in WoS).
All users Professors Researchers Students Librarians Other professionals
All fields 1.7 0.2 0.4 1.1 0.1 0.1
Biomedical & Health Sciences 1.0 1.0 1.1 0.9 1.2 1.3
Life & Earth Sciences 1.4 1.3 1.6 1.4 1.1 1.4
Mathematics & Computer Science 1.1 1.2 0.7 1.2 0.9 0.6
Physical Sciences & Engineering 0.6 0.6 0.6 0.7 0.3 0.3
Social Sciences & Humanities 2.7 3.1 1.6 3.0 3.8 1.7
Based on the results in Tables 3 and 4, differences between the number of readers and the number of citations
across fields can be detected. It can be seen in Table 3 that publications from the Social Sciences & Humanities have
on average the highest number of readers followed by publications from the Life & Earth Sciences, the Biomedical &
Health Sciences, and the Physical Sciences & Engineering. In contrast, it can be seen in Table 4 that publications from
the Physical Sciences & Engineering and the Biomedical & Health Sciences have on average the highest number of
citations, followed by publications from the Life & Earth Sciences and the Social Sciences & Humanities. Publications
from Mathematics & Computer Science have on average both the lowest number of readers and the lowest number
of citations. Nearly the same ordering of main fields can be observed for individual Mendeley user types. Researchers,
librarians, and other professionals show some exceptions. In the case of researchers and other professionals, publica-
tions from the Life & Earth Sciences and the Biomedical & Health Sciences have on average a higher number of read-
ers compared to publications from the Social Sciences & Humanities. In the case of librarians, publications from the
Biomedical & Health Sciences have on average a slightly higher number of readers than publications from the Life &
Earth Sciences.
If we look at the more detailed level of micro-level fields, we see that the visualization based on reader counts
(Figure 3a) differs significantly from the visualization based on citation counts (Figure 3b). The differences that are vis-
ible in these visualizations are in line with the results at the level of main fields discussed previously. The highest aver-
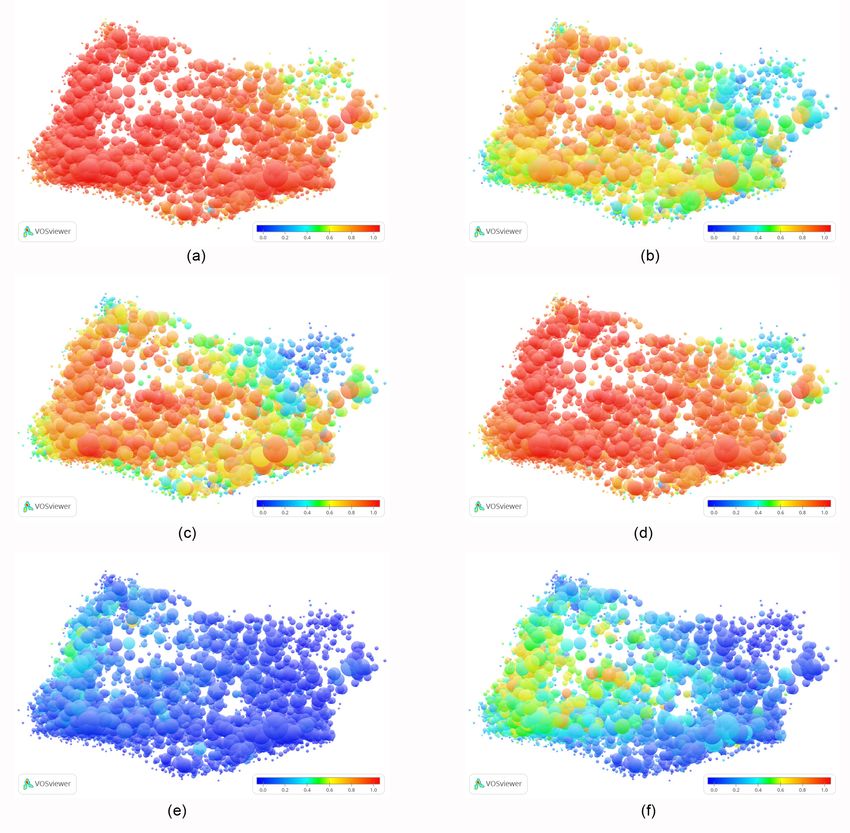
age number of readers can be observed for micro-level fields from the Social Sciences & Humanities and the Life & EarthZahedi and van Eck: Exploring Topics of Interest of Mendeley Users Art. 5, page 9 of 12 Sciences, while the highest average number of citations can be observed for micro-level fields from the Biomedical & Health Sciences and the Physical Sciences & Engineering. Table 5 and Figure 3c show that particularly when the citation density of each main field and each micro-level field is considered, an above average number of readers for publications from the Social Sciences & Humanities is observ- able. This emphasizes the fact that fields with a relatively low citation density in WoS receive a relatively high number of readers in Mendeley. This is in particular observable for publications saved by librarians, professors, and students and could reflect the usefulness of these publications in practical, training, or educational contexts. Relative activity of Mendeley user types In this subsection, the relative activity of Mendeley users is presented. Figure 4 provides visualizations of the relative activity of the different Mendeley user types at the level of the micro-level fields. As explained in the Data and Method- ology section, the relative activity of a Mendeley user type in a field is calculated as the average number of readers per publication based on the activity of the Mendeley user type in the field divided by the average number of readers per publication based on the activity of all Mendeley users in the field. This approach provides us with a detailed overview of the micro-level fields in which different user types are relatively most and least active. Figure 4: VOSviewer overlay visualizations showing the relative activity of Mendeley users across all micro-level fields. The relative activity is shown for (a) professors, (b) researchers, (c) students, (d) librarians, and (e) other professionals. An interactive version of the overlay visualizations is available online at https://goo.gl/CJVRzL.
Art. 5, page 10 of 12 Zahedi and van Eck: Exploring Topics of Interest of Mendeley Users Based on the results in Figure 4 and in answer to the first main research question, it seems that professors (Figure 4a) are relatively seen by the most active users in micro-level fields from Mathematics & Computer Science and some micro- level fields from the Social Sciences & Humanities and the Biomedical & Health Sciences. In contrast to professors, researchers (Figure 4b) are relatively more focused on micro-level fields from the Physical Sciences & Engineering, the Life & Earth Sciences, and the Biomedical & Health Sciences. Students (Figure 4c) mainly focus on the micro-level fields from the Social Sciences & Humanities, Mathematics & Computer Science, and the Physical Sciences & Engineering. Librarians (Figure 4d) are relatively most active in micro-level fields from the Biomedical & Health Sciences and the Social Sciences & Humanities, but their activity is also scattered across other micro-level fields. Other professionals (Figure 4e) are relatively most focused on micro-level fields from the Biomedical & Health Sciences and the Life & Earth Sciences. Topics of interest of Mendeley user types In this subsection, we present an overview of specific topics of interest of different Mendeley user types. For each user type, we identified the micro-level fields in which the users are relatively seen most active. The identification of the micro-level fields was done based on the relative activity of the users of a user type. Micro-level fields with a small abso- lute number of readers have been filtered out. To get an impression of the topics of the micro-level fields that have been selected in this way, a summary of the top 5 micro-level fields per Mendeley user type is provided in Tables A1 to A5 in the Appendix. For each micro-level field, the tables list the number of readers based on the activity of the corresponding user type, five characteristic terms, the three journals with the largest number of publications, and the most frequently saved publication. By analyzing the micro-level fields listed in Tables A1 to A5 in the Appendix, differences between topics of interests of different Mendeley user types can be observed. Based on the results and in answer to the second main research question, it is interesting to see that professors have a relatively strong focus on topics related to teaching and educa- tion, like higher education, medical education, and second language acquisition (Table A1). Researchers seem to be interested in a broad range of topics. Their topics of interest range from climate research, pharmaceutical research, and biotechnology to astronomy and astrophysics (Table A2). Students seem to be biased towards topics such as b usiness, management, and leadership (Table A3). Librarians show relatively most interest in topics that seem to be directly related to their work, namely bibliometrics and scientometrics, library science, and research utilization (Table A4). Other professionals seem to be mostly focused on biological, medical, and clinical oriented topics (Table A5). Below we further elaborate on the way in which different topic interests of different Mendeley user types could indicate different types of usage of scholarly publications. Discussion and Conclusions Mendeley is known as a promising source for altmetrics. Readership data from Mendeley can be used to reveal differences in reading (saving) behavior of different types of users. In this study, we have explored the usage of 1.2 million WoS indexed publications by different user types in Mendeley. The aim was to see if there are any differences in readership activity and topics of interest. VOSviewer overlay visualizations have been used to identify and depict these differences. The findings of this study show that there are quite some disciplinary differences in terms of readership activity and in terms of the topics of interest among different user types in Mendeley. Publications from the Social Sciences & Humanities receive on average the highest number of readers, which may indicate that Mendeley is relatively more popular in this field than in other fields. It is interesting to see that this is in sharp contrast to citations, which are typi- cally less concentrated in the Social Sciences & Humanities and most concentrated in the Biomedical & Health Sciences, the Life & Earth Sciences, and the Physical Sciences & Engineering. The purpose for which Mendeley is used by different user types could help to explain the disciplinary differences. A recent study (Thelwall 2017), for instance, found that professional health-related areas receive high readership in Mendeley due to the usage of the tool in training, while mathematics and high energy physics receive low readership due to use of other tools such as LaTeX. Another study showed that F1000 publications with the tag ‘good for teaching’ (publications that provide a good overview of a par- ticular topic) receive most attention by Mendeley users classified as lecturers and publications with the tag ‘new find- ings’ receive most attention by users classified as researcher (Bornmann & Haunschild 2015). It indicates that Mendeley is used for different purposes. The results of a survey among Mendeley users show that most of the respondents use Mendeley as a tool to cite literature in their publications, to keep track of relevant publications for their jobs, and to teach (Mohammadi et al. 2014). Another recent survey shows that browsing papers and groups and connecting with other users are among the motivations of Mendeley users. Most of these users reported that they have read and cited or intended to cite most of the items in their Mendeley library (Chen et al. 2018). Moreover, research-based features (man- aging documents and citations) in Mendeley are more popular by members of online groups than social-based features (making friends and connections) (Jeng, He & Jiang 2015). The results from these previous studies coincide with the results of a recent survey (Tenopir et al. 2015) which indicates that the main reason for reading scientific publications in general for US faculty members is research and writing, teaching, current awareness, and education. In terms of the topics of interest, the results of this study indeed indicate that different user types have relatively more attention for publications related to their role and the purpose for which they use Mendeley. This could range from con- ducting (literature) research, writing articles, training or (self) education, or the usage of a device or method. We have, for example, found that publications related to teaching and education show high readership among professors. This
Zahedi and van Eck: Exploring Topics of Interest of Mendeley Users                                      Art. 5, page 11 of 12

may be expected since professors use Mendeley among other things to organize literature for teaching and publishing.
It assumes that professors reflect both educational and research use. Furthermore, the results seem to suggest that
students focus on more general and fundamental topics. Although the fact that a publication is frequently saved by stu-
dents does not provide conclusive evidence of its educational impact (Thelwall 2016), students seem to frequently save
fundamental and basic methodological publications that they read for educational purposes and this could reflect the
use of Mendeley by students as a source for course material or as a source for their master or doctoral thesis. The strong
interest of researchers in publications about applied sciences could show the scientific impact of these publications in
an applied context. Researchers seem to focus on the research front and seem to use Mendeley mostly in a pre-citation
context. Other professionals which may, for example, include medical doctors, nutritionists, and lawyers seem to be
mostly interested in publications about diagnosis, treating, tools, and devices. In other words, other professionals are
more likely to show interest in publications that have practical relevance in their work. It is also interesting to see that
publications related to library and information sciences or clinical guidelines show high readership among librarians.
   In conclusion, the various patterns of usage of scientific publications observed among the different user types in
Mendeley could be an indication of the importance of these publications in research, training, (self) education, or in
any professional, practical or applied context. Exploring how the topical interests of users differ across various fields
provides useful information on who use scientific outputs, from which fields, and for what purposes. The possibility
offered by Mendeley to track the use of scholarly publications by different types of users is an advantage that citation
databases lack. Readership statistics based on different user types provide a broad overview of the usage of scholarly
publications by a wide range of audiences including non-publishing users. This is important information in addition to
information on citations, especially in fields with a low citation density or fields in which citations accumulate slowly.
Detailed information on the usage of scholarly publications could help relevant stakeholders, such as researchers,
librarians, publishers, funders, and policy makers to get more insight into the full impact of publications.
   In addition to the number of users that have saved a publication, more information on specific activities of users in
Mendeley could help to get a more accurate and comprehensive picture of the actual usage and impact of scholarly
publications. For instance, it would be interesting to have more information on user actions such as assigned tags, notes
that are added or parts that are highlighted in the full-text, and time spent on a saved publication. This type of informa-
tion is not disclosed at the moment for Mendeley. More research is needed to find out whether and how this type of
information can be useful in any practical application.

Additional Files
The additional file for this article can be found as follows:

  • Appendix. Tables A1 to A5: Summary of the top 5 micro-level fields per Mendeley user type. DOI: https://doi.
    org/10.29024/joa.7.s1

Competing Interests
The authors have no competing interests to declare.

References
Bornmann, L., & Haunschild, R. (2015). Which people use which scientific papers? An evaluation of data from F1000.
   Journal of Informetrics, 9(3), 477–487. DOI: https://doi.org/10.1016/j.joi.2015.04.001
Chen, P.-Y., Hayes, E., Larivière, V., & Sugimoto, C. R. (2018). Social reference managers and their users: A survey of
   demographics and ideologies. PLOS ONE, 13(7), e0198033. DOI: https://doi.org/10.1371/journal.pone.0198033
Costas, R., Haustein, S., Zahedi, Z., & Larivière, V. (2016). Exploring paths for the normalization of altmetrics:
   Applying the Characteristic Scores and Scales. In: altmetrics16. Moving Beyond Counts: Integrating Context, 1–8.
   Bucharest.
Costas, R., Perianes-Rodríguez, A., & Ruiz-Castillo, J. (2017). On the quest for currencies of science: Field ‘exchange
   rates’ for citations and Mendeley readership. Aslib Journal of Information Management. DOI: https://doi.org/10.1108/
   AJIM-01-2017-0023
Costas, R., Zahedi, Z., & Wouters, P. (2015a). Do ‘altmetrics’ correlate with citations? Extensive comparison of altmetric
   indicators with citations from a multidisciplinary perspective. Journal of the Association for Information Science and
   Technology, 66(10), 2003–2019. DOI: https://doi.org/10.1002/asi.23309
Costas, R., Zahedi, Z., & Wouters, P. (2015b). The thematic orientation of publications mentioned on social media:
   Large-scale disciplinary comparison of social media metrics with citations. Aslib Journal of Information Management,
   67(3), 260–288. DOI: https://doi.org/10.1108/AJIM-12-2014-0173
Hammarfelt, B. (2014). Using altmetrics for assessing research impact in the humanities. Scientometrics, 101(2), 1419–
   1430. DOI: https://doi.org/10.1007/s11192-014-1261-3
Haunschild, R., & Bornmann, L. (2016). Normalization of Mendeley reader counts for impact assessment. Journal of
   Informetrics, 10(1), 62–73. DOI: https://doi.org/10.1016/j.joi.2015.11.003
Haunschild, R., Bornmann, L., & Leydesdorff, L. (2015). Networks of reader and country status: an analysis of
   Mendeley reader statistics. PeerJ Computer Science, 1, e32. DOI: https://doi.org/10.7717/peerj-cs.32
Art. 5, page 12 of 12 Zahedi and van Eck: Exploring Topics of Interest of Mendeley Users
Haustein, S., & Larivière, V. (2014). Mendeley as a source of global readership by students and postdocs? Evaluating
article usage by academic status. In: In 35th International Association of Technological University Libraries (IATUL),
2–5 June 2014, Aalto University, Helsinki, Finland. Helsinki, 1–10. Helsinki, Finland. Retrieved from: http://docs.lib.
purdue.edu/iatul/2014/altmetrics/2.
Jeng, W., He, D., & Jiang, J. (2015). User participation in an academic social networking service: A survey of open group
users on Mendeley. Journal of the Association for Information Science and Technology, 66(5): 890–904. DOI: https://
doi.org/10.1002/asi.23225
Kraker, P., Schlögl, C., Jack, K., & Lindstaedt, S. (2015). Visualization of co-readership patterns from an online reference
management system. Journal of Informetrics, 9(1), 169–182. DOI: https://doi.org/10.1016/j.joi.2014.12.003
Leydesdorff, L., & Rafols, I. (2012). Interactive overlays: A new method for generating global journal maps from Web-
of-Science data. Journal of Informetrics, 6(2), 318–332. DOI: https://doi.org/10.1016/j.joi.2011.11.003
Mohammadi, E., & Thelwall, M. (2014). Mendeley readership altmetrics for the social sciences and humanities:
Research evaluation and knowledge flows. Journal of the Association for Information Science and Technology, 65(8),
1627–1638. DOI: https://doi.org/10.1002/asi.23071
Mohammadi, E., Thelwall, M., Haustein, S., & Larivière, V. (2015). Who reads research articles? An altmetrics analysis
of Mendeley user categories. Journal of the Association for Information Science and Technology, 66(9), 1832–1846.
DOI: https://doi.org/10.1002/asi.23286
Mohammadi, E., Thelwall, M., Kousha, K., Cybermetrics, S., Science, C., & Street, W. (2014). Can Mendeley Bookmarks
Reflect Readership? A Survey of User Literature review Changes in scholarly reading habits in the digital era.
Priem, J., Piwowar, H. A., & Hemminger, B. M. (2012). Altmetrics in the wild: Using social media to explore scholarly
impact. Retrieved from: http://arxiv.org/abs/1203.4745.
Tenopir, C., King, D. W., Christian, L., & Volentine, R. (2015). Scholarly article seeking, reading, and use: A continuing
evolution from print to electronic in the sciences and social sciences. Learned Publishing, 28(2), 93–105. DOI:
https://doi.org/10.1087/20150203
Thelwall, M. (2016). Does Mendeley provide evidence of the educational value of journal articles? Learned Publishing,
(August), 1–7. DOI: https://doi.org/10.1002/leap.1076
Thelwall, M. (2017). Are Mendeley reader counts useful impact indicators in all fields? Scientometrics, 113(3), 1721–
1731. DOI: https://doi.org/10.1007/s11192-017-2557-x
Thelwall, M., & Sud, P. (2016). Mendeley readership counts: An investigation of temporal and disciplinary differences.
Journal of the Association for Information Science and Technology, 67(12), 3036–3050. DOI: https://doi.org/10.1002/
asi.23559
Van Eck, N. J., & Waltman, L. (2010). Software survey: VOSviewer, a computer program for bibliometric mapping.
Scientometrics, 84(2), 523–538. DOI: https://doi.org/10.1007/s11192-009-0146-3
Waltman, L., & Van Eck, N. J. (2012). A New Methodology for Constructing a Publication-Level Classification System
of Science, 63(12), 2378–2392. DOI: https://doi.org/10.1002/asi.22748
Zahedi, Z., Costas, R., & Wouters, P. (2014). How well developed are altmetrics? A cross-disciplinary analysis of the
presence of ‘alternative metrics’ in scientific publications. Scientometrics, 101(2), 1491–1513. DOI: https://doi.
org/10.1007/s11192-014-1264-0
Zahedi, Z., Costas, R., & Wouters, P. (2017). Mendeley readership as a filtering tool to identify highly cited publications.
Journal of the Association for Information Science and Technology, 68(10), 2511–2521. DOI: https://doi.org/10.1002/
asi.23883
Zahedi, Z., & Van Eck, N. (2015, 2–4 September). Identifying topics of interest of Mendeley users using the text mining
and overlay visualization functionality of VOS viewer. In: 20th International Conference in Science & Technology
Indicators, Lugano, Switzerland.
Zahedi, Z., Haustein, S., & Bowman, T. (2014, 5 November). Exploring data quality and retrieval strategies for Mendeley
reader counts. Presentation at: SIGMET Metrics 2014 workshop. Available from: http://www.asis.org/SIG/SIGMET/
data/uploads/sigmet2014/zahedi.pdf.
How to cite this article: Zahedi, Z., & van Eck, N. J. (2018). Exploring Topics of Interest of Mendeley Users. Journal of
Altmetrics, 1(1): 5. DOI: https://doi.org/10.29024/joa.7
Submitted: 29 August 2018 Accepted: 20 October 2018 Published: 28 November 2018
Copyright: © 2018 The Author(s). This is an open-access article distributed under the terms of the Creative Commons
Attribution 4.0 International License (CC-BY 4.0), which permits unrestricted use, distribution, and reproduction in any medium,
provided the original author and source are credited. See http://creativecommons.org/licenses/by/4.0/.
Journal of Altmetrics is a peer-reviewed open access journal published by Levy Library Press. OPEN ACCESSYou can also read