2019 POINT IN TIME COUNT - SUMMARY REPORT - EVERYONE
←
→
Page content transcription
If your browser does not render page correctly, please read the page content below

EVERYONE
                  COUNTS

2019 POINT IN TIME COUNT
SUMMARY REPORT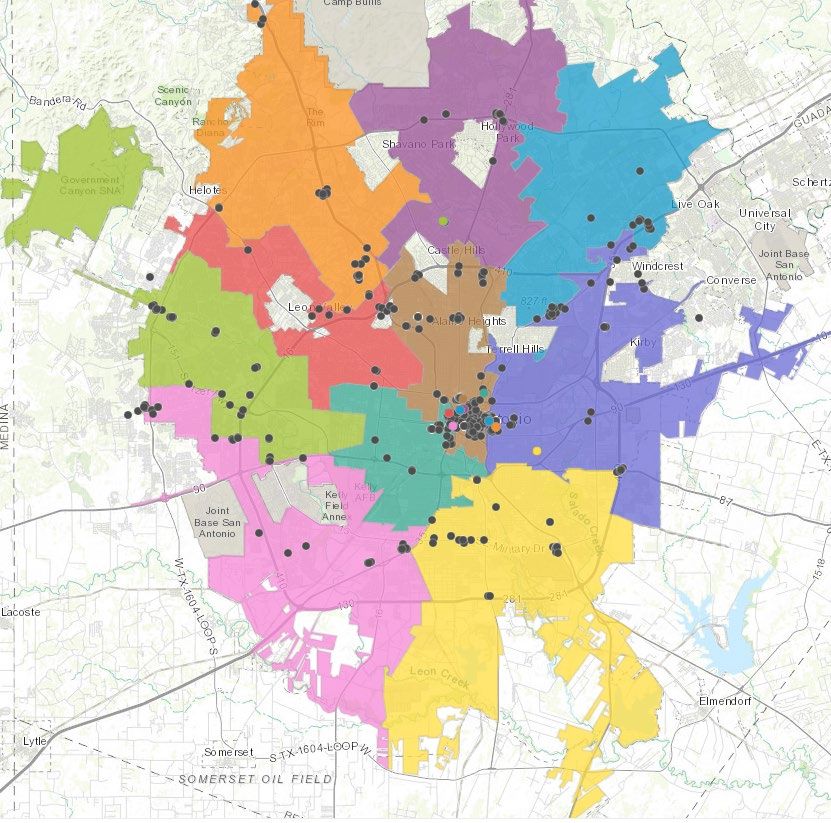
1

THANK YOU TO ALL OF OUR SPONSORS:
2

CONTENTS
What is the Point in Time Count? .................................................................................................................................3
Key Findings ..................................................................................................................................................................4
Point in Time Count: Snap Shot ....................................................................................................................................6
Unsheltered & Sheltered Count Overview ...................................................................................................................7
2019 PIT Count by City Council District ........................................................................................................................8
Gender ...........................................................................................................................................................................9
Ethnicity.......................................................................................................................................................................10
Race .............................................................................................................................................................................11
Age ...............................................................................................................................................................................12
Special Populations .....................................................................................................................................................13
Mental Heath ..............................................................................................................................................................14
Substance Use .............................................................................................................................................................15
Domestic Violence ......................................................................................................................................................16
Aging Adults ................................................................................................................................................................17
Youth & Young Adults .................................................................................................................................................18
Length of Time Homeless............................................................................................................................................19
Street Medicine Data ..................................................................................................................................................20
Methodology Notes ....................................................................................................................................................21
Key Terms ....................................................................................................................................................................24
Appendix A ..................................................................................................................................................................26
Appendix B ..................................................................................................................................................................28
Official HDX Report Submissions ................................................................................................................................30
3

      WHAT IS THE POINT IN TIME COUNT?
Every year, during the last 10
days of January, more than 400
Continuums of Care (CoC),
covering over 3,000 cities and
counties across the country
organize tens of thousands of
volunteers in a national effort to
measure the scale of
homelessness in the United
States. This nationwide effort is
called “the Point in Time (PIT)
Count”.

The PIT Count reveals the number
of homeless persons in our
shelters and on our streets at a single point-in-time. These one-night snapshot
counts also provide local planners with data they need to understand the number
and characteristics of persons who are homeless so they, in turn, can develop a
thoughtful response.

The data collected during these annual counts allows communities to find out not
just how many people are homeless, but who is homeless and more importantly,
why they are homeless. Being able to answer these important questions is critical
in our mission to end homelessness.

The following report is an overview of what we’ve learned from the most recent
Point in Time Count that took place on January 24th, 2019.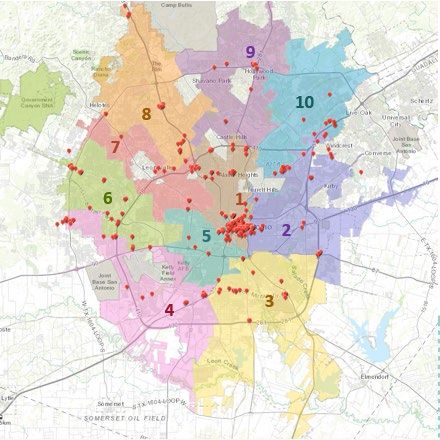
4

                                  KEY FINDINGS
The 2019 PIT Count revealed a significant reduction in unsheltered homelessness. There was a
6% reduction in overall homelessness, and a 12% reduction in unsheltered homelessness. As a
community, San Antonio/Bexar County housed 759 people experiencing homelessness in the
2018 PIT Count prior to the 2019 PIT Count. Although the population experiencing
homelessness constantly fluctuates, there was an overall reduction in homelessness due to
increased outreach coordination efforts with a focus on serving chronically homeless individuals
as well as the City of San Antonio’s Department of Human Services (COSA DHS) initiative to
reach people living in encampments. The Courtyard at Haven for Hope, an outdoor sleeping
facility included in the unsheltered count, saw a significant reduction due to a collaboration of
housing partners concentrating on this population along with a new Direct Referral Program at
Haven for Hope coming online to move individuals into shelter from The Courtyard.

28% reduction in the number experiencing Chronic Homelessness. Chronically Homeless
individuals and families are defined as having a long-term disabling condition and have
experienced at least one year of homelessness. The reduction in this population is tied to a
coordinated effort among housing providers in the Continuum of Care (CoC) to work with this
vulnerable population and the creation of additional units of Permanent Supportive Housing
programs targeting chronic homelessness. There are currently 19 Permanent Supportive
Housing programs in San Antonio/Bexar County including San Antonio Metropolitan Ministries
(SAMM), The Salvation Army (TSA), The Center for Healthcare Services (CHCS), American GI
Forum-National Veterans Outreach Program (AGIF NVOP), Endeavors, San Antonio AIDS
Foundation (SAAF), and Haven for Hope (H4H) with an average inventory utilization of 93% and
an average housing sustainment rate of 98%. This limited resource is critical to continue a
positive trend for the chronically homeless population. Our CoC and Chronic Homelessness
Workgroup lead by COSA DHS are excited to initiate a “move-on” pilot with the San Antonio
Housing Authority (SAHA) this year to help create additional resources.
6% reduction in the number of Veterans experiencing homelessness. San Antonio/Bexar
County achieved the United States Interagency Council on Homelessness (USICH) federal
benchmarks to effectively end veteran homelessness in May of 2016. The initiative was jump
started by COSA DHS, SARAH, and a $2.1 Million gift from USAA to house every homeless
veteran seeking housing in our community. These benchmarks are monitored by our veteran
service providers including COSA DHS, SARAH, AGIF NVOP, Endeavors, Veterans Affairs, Haven
5

for Hope, and other partners on a monthly basis to ensure every veteran is housed within 90
days and that there is available housing capacity for every newly homeless veteran. Increased
coordination and navigation has facilitated the move of even more veterans experiencing
homelessness into housing.
18% increase in the number of Families experiencing homelessness. This finding is consistent
with ongoing trends and reports from homeless service providers. SARAH established a Family
Homelessness Workgroup this year to increase coordination efforts for families experiencing
homelessness in San Antonio/Bexar County. Rent affordability is an issue impacting our
families. Homelessness Prevention and Diversion funding should be expanded to help mitigate
this growing issue. SARAH is creating a Prevention/Diversion position in 2019 to work in these
critical areas.
Improved and expanded health and housing
data. National research has shown that
individuals experiencing homelessness have
greater morbidity and mortality rates than the
general population and experience more co-
morbidities than their housed counterparts.
When compared to non-homeless populations,
individuals experiencing homelessness face a
multitude of complex health and social issues
that are often integrated with past, present, and
daily trauma that impact these individuals’
prioritization and decision-making efforts. Based on data from County Health Rankings, Bexar
County is doing better at addressing mental health compared to other Texas Counties.
However, lack of health insurance and/or access to mental health care providers that
specifically serve special populations, such as those experiencing homelessness, continues to be
a challenge.

   •   Of those who are experiencing homelessness and reported having a serious mental
       illness, 46% were unsheltered individuals.
   •   Furthermore, data collected by the UIW medical students who participated in the PIT
       Count for the first time this year found that approximately 68% of unsheltered
       individuals reported having no health insurance coverage, and
   •   60% of unsheltered individuals reported having no easy access to transportation for
       their medical appointments.
6
POINT IN TIME COUNT: SNAP SHOT
SAN ANTONIO / BEXAR COUNTY JANUARY 24 TH , 2019
Total Count
2018 2019
Sheltered Count 1,713 1,685 -2%
(56% of total count) (59% of total count)
Haven for Hope Count 858 853
(50% of sheltered count) (30% of total count)
Unsheltered Count 1,353 1,187 -12%
(44% of total count) (41% of total count)
Courtyard Count 648 565
(48% of unsheltered count) (20% of total count)
Total Count: 3,066 2,872 -6%
10 PM Unaccompanied
Veterans Chronic Homeless Families
Downtown Count Youth
2018 2019 2018 2019 2018 2019 2018 2019 2018 2019
197 141 228 215 479 343 232 274 162 98
-28% -6% -28% +18% -40%
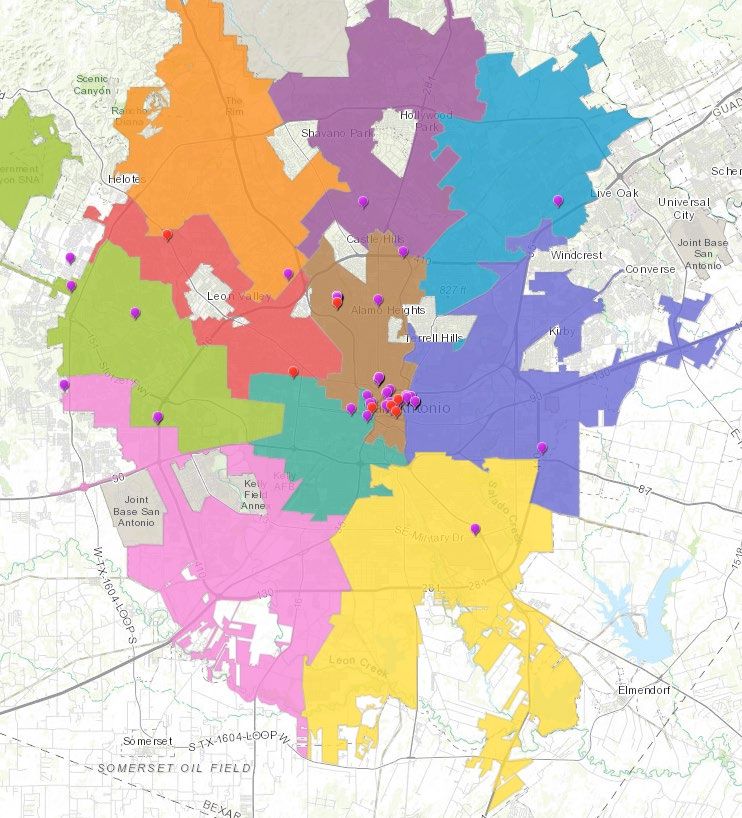
District Number of Persons
1 260
2 130
3 42
4 38
5 45
6 34
7 13
8 30
9 16
10 14
7

UNSHELTERED & SHELTERED COUNT OVERVIEW
On January 24, 2019, more than 400 volunteers counted the number of children,
families, and adults experiencing homelessness throughout San Antonio / Bexar
County. Volunteers counted people in cars, tents, parks, under bridges, and on
the streets using a mobile application called “Counting Us”.

On the same day, people who were sleeping in emergency shelters and
transitional housing programs were counted using the Homeless Management
Information System (HMIS).

The total number of individuals experiencing homelessness that day was 2,872, a
6% decrease from the 2018 PIT Count.

        PERSONS COUNTED EXPERIENCING HOMELESSNESS
                IN POINT-IN-TIME COUNTS (PIT)
                                    Unsheltered     Sheltered
                    3,670
3,291
        3,222
                            2,980     2,892       2,891                         3,066
                                                                2,781   2,743           2,872
                    2043
1674
        2046                1737                                                1713
                                       1970       1733          1644    1641            1685

1617                1627                                                        1353
        1176                1243                  1158          1137    1102            1187
                                       922

2010    2011        2012    2013      2014        2015          2016    2017    2018    2019
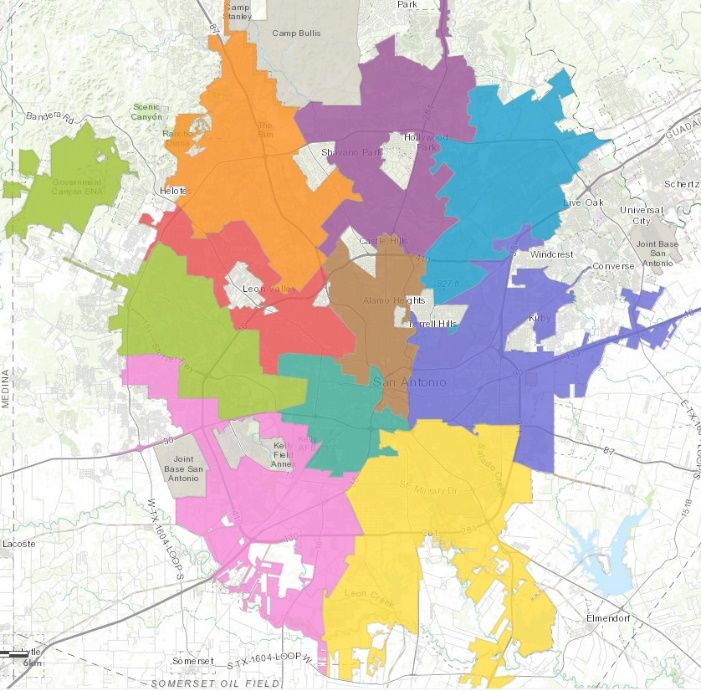
8

2019 PIT COUNT BY CITY COUNCIL DISTRICT

9

                                           GENDER
                       Emergency Shelter    Transitional Housing         Unsheltered        Total
Female                       618                     154                    277             1,049
Male                         740                     167                    906             1,813
Transgender                   6                       0                      4               10

               Children (under age 18)       Youth (18 to 24)       Adults (over age 24)

                                                                                    0.3%
         30%

                                               69%
                                                     1
         40%
                                                                     2
                                                5                                      3%
                                               57%
         74%

                                               26%              3                                   0%

       F E MA LE                             MA LE                           T RA N SG E N D E R
10
ETHNICITY
Emergency Transitional Unsheltered Total
Shelter Housing
Non-Hispanic /
732 162 667 1,561
Non-Latino
Hispanic / Latino 632 159 520 1,311
Non-Hispanic / Non-Latino Hispanic / Latino
42% 45% 46%
58% 55% 54%
2017 2018 201911
RACE
Emergency Transitional Unsheltered Total
Shelter Housing
White 1,032 226 847 2,105
Black or African
293 83 256 632
American
Asian 3 5 8 16
American Indian or
8 0 17 25
Alaska Native
Native Hawaiian or
3 2 4 9
Other Pacific Islander
Multiple Races 25 5 55 85
White Black or African American Other*
5%
22%
*“Other” Includes: Asian, American
73% Indian or Alaska Native, Native
Hawaiian or Other Pacific Islander, &
Multiple Races.12
AGE
Emergency Transitional
Unsheltered Total
Shelter Housing
Children
383 135 5 523
(under age 18)
Youth
63 15 50 128
(18 to 24)
Adults
918 171 1,132 2,221
(over age 24)
Children (under age 18) Youth (18 to 24) Adults (over age 24)
78% 76% 77%
5% 7% 5%
17% 17% 18%
2017 2018 201913
SPECIAL POPULATIONS
Emergency Transitional
Unsheltered Total
Shelter Housing
Chronically Homeless 183 N/A 160 343
Families 210 60 4 274
Parenting Youth 13 2 0 15
Adult Survivors of
324 74 82 480
Domestic Violence
Veterans 88 66 61 215
2017 2018 2019
651
489
480
479
343
274
242
232
228
228
215
204
37
32
15
CHRONICALLY FAMILIES PARENTING YOUTH DOMESTIC VETERANS
HOMELESS VIOLENCE
SURVIVORS
VETERANS
284
263 263
228 228 215
122
2013 2014 2015 2016 2017 2018 201914
MENTAL HEATH
Emergency Transitional
Unsheltered Total
Shelter Housing
Developmental Disorder 21 2 42 65
Serious Mental Illness (SMI) 373 36 328 737
Children (under age 18) Youth (18 to 24) Adults (over age 24)
78%
88%
14%
8% 7% 3%
D E VE LO PME N TA L DI SO RDE RS SE RI O US ME N TA L I LLN ESS (SMI )
1%
GENDER
36%
Female
63%
Male
Transgender15
SUBSTANCE USE
Emergency Shelter Transitional Housing Unsheltered
244
185
0 0 15
1 1 9 33
CHILDREN (UNDER AGE 18) YOUTH (18 TO 24) ADULTS (OVER AGE 24)
GENDER
0%
24%
76% Female
Male
Transgender16
DOMESTIC VIOLENCE
Children Youth Adults
(under age 18) (18 to 24) (over age 24)
63 27 318
SHELTERED VS. UNSHELTERED
17%
GENDER
15% 0.49%
68%
Emergency Shelter 30%
Transitional Housing
Unsheltered 70%
Female
Male
Transgender17
AGING ADULTS
More adults are aging into poverty and are at greater risk of homelessness now than at any
other time in recent history. Simultaneously, housing is becoming more unaffordable and the
costs of necessities like health care are rising, leaving older adults at risk of poverty and
homelessness.
While people experiencing homelessness of all ages suffer from the effects of poor nutrition,
limited health care access, and high stress levels, experiencing homelessness compounds these
effects for aging adults.
Prolonged exposure to stress often leads to “weathering”, meaning that those who are unstably
housed age 10 to 20 years beyond their chronological age. According to the National Health
Care for the Homeless Council, visits to the emergency department by older patients without
stable housing accounted for over 30% of the visits made by all homeless adults.
Designing policies and programs, like The Hearth Act, with the medical and accessibility needs
of older Americans in mind is vital to ensuring the elderly can age with dignity.
275
Adults Over Age 50 256 258
2019 PIT Count
521
47% 44%
14
9%
CHRONIC SERIOUS PHYSICAL HIV/AIDS
Emergency Shelter ILLNESS MENTAL ISSUES DISABILITY
Transitional Housing (SMI)
Unsheltered18
YOUTH & YOUNG ADULTS
Adolescence and young adulthood are crucial windows of development. One day of housing-
instability and the associated stress represents a missed opportunity to foster healthy
development and transitions to productive adulthood. According to national estimates,
approximately 550,000 unaccompanied youth and young adults up to age 24 experience a
homelessness episode of longer than one week over the course of 12 months, and more than
half are under the age of 18.
Youth experiencing homelessness
have a different subset of needs
compared to the general homeless
population because of their limited
experience using essential
independent living skills, paying for
transportation, gaining employment,
or managing finances. Additionally,
youth experiencing homelessness
are more likely to engage in high-risk
behaviors than youth who are stably
housed. Data shows that youth
experiencing homelessness
experience increased mental health
symptoms, decreased physical
health, decreased level of education,
and increased involvement with the
criminal justice system.
Properly identifying youth and young adults experiencing homelessness has been a consistent
challenge for communities across the country. In San Antonio / Bexar County, this is particularly
true. Much like the national estimates, these numbers are imprecise, and the single night
number is likely an undercount. Continuing to work to improve the way San Antonio / Bexar
County collects youth and young adult PIT data is critical in order to more accurately reflect the
numbers of unaccompanied young people experiencing homelessness19
LENGTH OF TIME HOMELESS
Children (under age 18) Children (under age 18)
Youth (18 to 24) Youth (18 to 24)
Adults (over age 24) Adults (over age 24)
317
615
294
78
67 17
6 MONTHS (0 - 180 DAYS) 6 TO 12 MONTHS (181 - 365 DAYS)
Children (under age 18)
Children (under age 18)
Youth (18 to 24)
Youth (18 to 24)
Adults (over age 24) 274
Adults (over age 24) 337
45
10
3 2
13 TO 24 MONTHS (366 - 730 DAYS)
> 2 YEARS
6 MONTHS 6 TO 12 MONTHS 13 TO 24 MONTHS
3% 3% 2%
28% 31% 23% 32% 21% 34%
38% 42% 43%
> 2 YEARS
0%
26% 29%
45%20
STREET MEDICINE DATA
Volunteers & community partnership are instrumental in San Antonio / Bexar County’s ability to
carry out a successful count each year. Each year we try to find new, innovative ways to
collaborate with different service organizations and systems of care to help improve
connections between those that are the most vulnerable that are experiencing homelessness
with the right supports as quickly as possible.
For the 2019 PIT Count we collaborated with the University of the Incarnate Word School of
Osteopathic Medicine (UIWSOM) by matching 35 medical students with 12 teams of volunteers
so that they could provide basic medical care to individuals experiencing unsheltered
homelessness. In addition to providing basic medical care, the medical students collected non-
PHI health data for the individuals they served. This was the first time that our local PIT count
included volunteers providing basic medical care and captured this new data.
Medication Compliance
Emergency Room (ER) Visit
Frequency 0%
15% Very
34% 35%
Somewhat
56% 29%
< 1 Week Ago Not Very
1 - 2 Weeks Ago 19% 12%
2 - 6 Months Ago
Not Applicable / Not Taking
> 6 Months Ago
Medications
Health Insurance Coverage Access to Transportation
Medicaid
18%
Medicare
6% 40%
Private
2%
Insurance 60%
Other 6% Yes
68%
No
No Insurance21
METHODOLOGY NOTES
PIT counts are a critical source of data on the number and characteristics of people who are homeless in
the United States. These data are used to measure homelessness on a local and national level and are
published annually on HUD’s HUD Exchange website, which can be viewed by Continuum of Care agencies
and the general public. HUD’s PIT count data has become increasingly important as a measure of our local
and national progress related to preventing and ending homelessness, especially with relation to our
progress towards meeting the goals of Opening Doors: Federal Strategic Plan to Prevent and End
Homelessness. Therefore, it has become necessary to ask for more detailed information and to ensure
that the data submitted to HUD are as complete and accurate as possible. Additionally, collecting valid
and reliable data and making progress on reducing homelessness are scoring factors in HUD’s CoC
Program Competition and can influence CoC Program funding awards. CoCs are required to submit their
PIT count data through the HUD HDX website.
It is important to note that the PIT count only identifies a subset of individuals and families that meet
HUD’s definition of homeless. As such, the PIT count does not capture everybody who is eligible for
homeless assistance through other homeless assistance funding sources.
LEGAL REQUIREMENTS
The McKinney-Vento Homeless Assistance Act authorized HUD to require CoCs to conduct PIT counts.
Section 427(b)(3) states:
“Homelessness Counts. – The Secretary shall not require that communities conduct an actual count of homeless
people other than those described in paragraphs (1) through (4) of section 103(a) of this Act.”
This statutory language establishes HUD’s authority to require PIT counts but limits the count to persons who are
defined as living on the streets or in shelters (which is what section 103(a) paragraphs 1 through 4 define).
In the CoC Program interim rule HUD further clarified the requirements for conducting PIT counts. In the definition
section HUD defines the PIT count as “count of sheltered and unsheltered homeless persons carried out on one night
in the last 10 calendar days of January or at such other time as required by HUD” (24 CFR 578.3). HUD outlined CoC
planning requirements in 24 CFR 578.7(c)(2):
“(2) Planning for and conducting, at least biennially, a point-in-time count of homeless persons within the geographic
area that meets the following requirements:
i. Homeless persons who are living in a place not designed or ordinarily used as a regular sleeping
accommodation for humans must be counted as unsheltered homeless persons.22
ii. Persons living in emergency shelters and transitional housing projects must be counted as sheltered
homeless persons.
iii. Other requirements established by HUD by Notice.”
PIT COUNT APPROACH
HUD requires CoCs to collect reliable data on the total number and characteristics of all people (i.e.,
sheltered and unsheltered) residing in the CoCs’ geographic area who are homeless on a single night and
report these data to HUD. HUD allows CoCs to use multiple approaches to complete their count, including
a census approach, sample, or a combination of census and sampling approaches.
A census approach was used for the San Antonio / Bexar County PIT Count. This counting approach
provides a direct and complete count of all people and their characteristics, does not require any total
count estimates, and can be used as a benchmark for future PIT counts.
POPULATION DATA
HUD requires CoCs to collect and report information on the demographic characteristics of all people
reported as sheltered or unsheltered by household type and, within each household type, by age category,
gender, race, and ethnicity. CoCs must also report information by household type for veteran and youth
households.
CoCs must provide demographic data for both sheltered and unsheltered persons according to the
following three household types:
a. Persons in households with at least one adult and one child. This category includes households
with one adult and at least one child under age 18.
b. Persons in households without children. This category includes single adults, adult couples with
no children, and groups of adults (including adult parents with their adult children).
c. Persons in households with only children. This category includes persons under age 18, including
children in one-child households, adolescent parents (under age 18) and their children, adolescent
siblings, or other household configurations composed only of children.
In some instances, a CoC may not have certain demographic data for a homeless person. This may be
because the person refused to provide the information, or it was not possible to collect it during the PIT
count. In these instances, a CoC can estimate the missing demographic information using available data
and a methodology consistent with HUD PIT methodology standards and guidance.
Appendix A illustrates the populations data reporting requirements in a table format for reference.23
DATA COLLECTION METHODLOGY
Three data collection methodologies were used to capture a complete count of all people and their
demographic characteristics.
Appendix B illustrates a complete list of all the organizations and projects and the methodology that was used.
Sheltered Count Methodology
HUD requires that CoCs count all people who are homeless and staying in shelter (emergency shelter,
safe haven, or transitional housing project) on the night of the count.
For projects that participate in the Homeless Management Information System (HMIS), the census was
conducted using a service-based count and then extracting all the necessary information from the HMIS.
Unsheltered Count Methodology
To capture the necessary information for individuals not staying in a shelter or for organizations and
projects that do not participate in the Homeless Management Information System (HMIS), the necessary
information was collected by volunteers using the mobile application “Counting Us” developed by
Simtech Solutions. The “Regional Command Center” receives data gathered by volunteers using the
Counting Us app and displays the results as they change throughout the count.
Domestic Violence Organizations
For organizations that are classified as Domestic Violence service providers, or receive VAWA funding,
shelter data was captured through de-identified aggregated reports provided to the CoC by the DV
provider.
DEDUPLICAITON METHODOLOGY
After the count was conducted, data was extracted from the HMIS and the mobile app Regional
Command Center and combined into one excel file. Finding and removing duplicate records that relate
to the same person in the PIT count is an essential component in getting an accurate count of persons
who are homeless within a community. Duplicate counting is especially likely to occur when there are
opportunities to count people at various locations at different times.
Duplicate records were identified based on personal identifying information (PII). Identifying data
elements used:
1. First Name 6. Geospatial data
2. Last Name 7. Veteran Status
3. DOB 8. Additional Identifying Information
4. Gender (i.e. Demographics & Case Notes)
5. SSN24
KEY TERMS
NOTE: These definitions do not fully correspond to the program requirements of HUD funding streams
and must only be used for the purposes of the PIT.
Adults – Persons age 18 and older.
Child – Persons under age 18.
Chronically Homeless Person - A person who:
A. Is homeless and lives in a place not meant for human habitation, a safe haven, or in an emergency
shelter; and
B. Has been homeless and living or residing in a place not meant for human habitation, a safe haven, or in
an emergency shelter continuously for at least 1 year or on at least four separate occasions in the last 3
years where the combined length of time homeless in those occasions is at least 12 months; and
C. Has a disability.
Disability – An individual with one or more of the following conditions:
A. A physical, mental, or emotional impairment, including an impairment caused by alcohol or drug abuse,
post-traumatic stress disorder, or brain injury that:
(1) Is expected to be long-continuing or of indefinite duration;
(2) Substantially impedes the individual's ability to live independently; and
(3) Could be improved by the provision of more suitable housing conditions.
B. A developmental disability, as defined in section 102 of the Developmental Disabilities Assistance and
Bill of Rights Act of 2000 (42 U.S.C. 15002); or
C. The disease of acquired immunodeficiency syndrome (AIDS) or any condition arising from the etiologic
agency for acquired immunodeficiency syndrome (HIV).
Adults with HIV/AIDS – This population category of the PIT includes adults who have been diagnosed
with AIDS and/or have tested positive for HIV.
Adults with a Serious Mental Illness (SMI) – This population category of the PIT includes adults with a
severe and persistent mental illness or emotional impairment that seriously limits a person's ability to
live independently. Adults with SMI must also meet the qualifications identified in the term for
“disability” (e.g., “is expected to be long-continuing or indefinite duration”).
Adults with a Substance Use Disorder–This population category of the PIT includes adults with a
substance use problem (alcohol abuse, drug abuse, or both). Adults with a substance use disorder must
also meet the qualifications identified in the term for “disability” (e.g., “is expected to be long-
continuing or indefinite duration”).25 Survivors of Domestic Violence–This population category of the PIT includes adults who are currently experiencing homelessness because they are fleeing domestic violence, dating violence, sexual assault, or stalking. Veteran–This population category of the PIT includes adults who have served on active duty in the Armed Forces of the United States. This does not include inactive military reserves or the National Guard unless the person was called up to active duty. Victim Service Provider – A private nonprofit organization whose primary mission is to provide services to survivors of domestic violence, dating violence, sexual assault, or stalking. This term includes rape crisis centers, battered women’s shelters, domestic violence transitional housing programs, and other programs. Youth – Persons under age 25. HUD collects and reports youth data based on persons under 18 and persons between ages 18 and 24. Parenting Youth – A youth who identifies as the parent or legal guardian of one or more children who are present with or sleeping in the same place as that youth parent, where there is no person over age 24 in the household. Unaccompanied Youth – Unaccompanied youth are persons under age 25 who are not accompanied by a parent or guardian and are not a parent presenting with or sleeping in the same place as his/her child(ren). Unaccompanied youth are single youth, youth couples, and groups of youth presenting together as a household.
26

                                            APPENDIX A

    POPULATION REPORTING REQUIREMENTS FOR THE PIT COUNT: FOR ALL HOUSEHOLD TYPES
                                             Emergency Shelter   Transitional Housing   Unsheltered   Total
Total number of households                          Y                     Y                  Y          Y
Total number of persons (adults &                   Y                     Y                  Y          Y
children)
Number of children (under age 18)                   Y                     Y                  Y          Y
Number of young adults (age 18 to 24)               Y                     Y                  Y          Y
Number of adults (over age 24)                      Y                     Y                  Y          Y
GENDER (adults & children)                  Emergency Shelter    Transitional Housing   Unsheltered   Total
Female                                              Y                     Y                  Y          Y
Male                                                Y                     Y                  Y          Y
Transgender                                         Y                     Y                  Y          Y
Gender Non-Conforming                               Y                     Y                  Y          Y
ETHNICITY (adults & children)               Emergency Shelter    Transitional Housing   Unsheltered   Total
Non-Hispanic / Non-Latino                           Y                     Y                  Y          Y
Hispanic / Latino                                   Y                     Y                  Y          Y
RACE (adults & children)                     Emergency Shelter   Transitional Housing   Unsheltered   Total
White                                               Y                     Y                  Y          Y
Black or African American                           Y                     Y                  Y          Y
Asian                                               Y                     Y                  Y          Y
American Indian or Alaska Native                    Y                     Y                  Y          Y
Native Hawaiian or Other Pacific Islander           Y                     Y                  Y          Y
Multiple Races                                      Y                     Y                  Y          Y
CHRONICALLY HOMELESS                         Emergency Shelter   Transitional Housing   Unsheltered   Total
Total Number of Households                          Y                     N                  Y          Y
Total Number of Persons                             Y                     N                  Y          Y
27
ADDITIONAL HOMELESS POPULATION REPORTING REQURIEMENTS FOR THE PIT COUNT
Emergency Shelter Transitional Housing Unsheltered Total
Adults w/ a Serious Mental Illness Y Y Y Y
Adults w/ a Substance Use Disorder Y Y Y Y
Adults with HIV/AIDS Y Y Y Y
Adult Survivors or Domestic Violence O O O O
(optional)28
APPENDIX B
American GI Forum-National Veteran's Out
Project Project Classification Data Collection Methodology Used
AGIF VA GPD BRIDGE TH Transitional Housing HMIS
AGIF VA GPD SITH TH Transitional Housing HMIS
AGIF NVOP RC TH Transitional Housing HMIS
BEAT AIDS
Project Project Classification Data Collection Methodology Used
BEAT AIDS N.E.W. HOPWA TH Transitional Housing HMIS
BEAT AIDS N.E.W. Non-HOPWA TH Transitional Housing HMIS
Catholic Charities
Project Project Classification Data Collection Methodology Used
Guadalupe Home Catholic Charities TH Transitional Housing HMIS
Center for Health Care Services
Project Project Classification Data Collection Methodology Used
CHCS COSA ITP Female Emergency Shelter HMIS
CHCS COSA ITP Male Emergency Shelter HMIS
Crosspoint Inc.
Project Project Classification Data Collection Methodology Used
Crosspoint Inc ES Emergency Shelter HMIS
Haven for Hope
Project Project Classification Data Collection Methodology Used
H4H Courtyard Unsheltered HMIS
H4H CY COSA DRP ES Emergency Shelter HMIS
H4H Master Enrollment Emergency Shelter HMIS
Pay it Forward NRS ES Emergency Shelter HMIS
THRIVE Emergency Shelter HMIS
Family Violence Prevention Services
Project Project Classification Data Collection Methodology Used
Battered Women & Children’s Shelter Emergency Shelter Encrypted, De-identified Report
La Paloma Transitional Housing Transitional Housing Encrypted, De-identified Report
FEMA Cottages Transitional Housing Encrypted, De-identified Report
Roy Maas Youth Alternatives
Project Project Classification Data Collection Methodology Used
Centro Seguro Emergency Shelter Mobile App
RHY Turning Point TLP Emergency Shelter Mobile App
San Antonio AIDS Foundation
Project Project Classification Data Collection Methodology Used
SAAF TH Transitional Housing HMIS29 San Antonio Metropolitan Ministries (SAMM) Project Project Classification Data Collection Methodology Used SAMM TH Transitional Housing HMIS Strong Foundation Project Project Classification Data Collection Methodology Used Strong Foundation ES Emergency Shelter HMIS Strong Foundation HomeBase Emergency Shelter HMIS The Salvation Army Project Project Classification Data Collection Methodology Used TSA Emergency Women and Family Shelter ES Emergency Shelter HMIS TSA Dave Coy Men Transient ES Emergency Shelter HMIS TSA Dave Coy Men SSI Dormitory TH Transitional Housing HMIS TSA Dave Coy Men Workers TH Transitional Housing HMIS TSA Stepping Forward TH Transitional Housing HMIS Visitation House Ministries Project Project Classification Data Collection Methodology Used Transitional Housing Program Transitional Housing De-identified Report
30

OFFICIAL HDX REPORT SUBMISSIONS
Point-in-Time Count TX-500 San Antonio/Bexar County CoC

Population: Sheltered and Unsheltered Count
Persons in Households with at least one Adult and one Child
                                    Sheltered            Unsheltered   Total
                              Emergency   Transitional
         Total Number of
                                    210            60             4       274
              Households
         Total Number of
                  persons           598           200             8       806
      (Adults & Children)
      Number of Persons
                                    381           135             4       520
          (under age 18)
      Number of Persons
                                     26             7             0        33
                 (18 - 24)
      Number of Persons
                                    191            58             4       253
            (over age 24)

                                    Sheltered            Unsheltered   Total
Gender
(adults and children)         Emergency   Transitional

                   Female           359           130             5       494

                       Male         238            70             3       311

             Transgender              1             0             0            1

           Gender Non-
     Conforming (i.e. not
                                      0             0             0            0
     exclusively male or
                 female)

                                    Sheltered            Unsheltered   Total
Ethnicity
(adults and children)         Emergency   Transitional
      Non-Hispanic/Non-
                                    257            80             8       345
                 Latino
          Hispanic/Latino           341           120             0       461

4/13/2019 1:08:31 AM                                                           1
Point-in-Time Count TX-500 San Antonio/Bexar County CoC
Sheltered Unsheltered Total
Race
(adults and children) Emergency Transitional
White 438 138 5 581
Black or African-
138 50 0 188
American
Asian 1 5 0 6
American Indian or
2 0 0 2
Alaska Native
Native Hawaiian or
2 2 0 4
Other Pacific Islander
Multiple Races 17 5 3 25
Chronically Sheltered Unsheltered Total
Homeless
(adults and children) Emergency Transitional
Total number of
6 0 6
households
Total number of
13 0 13
persons
4/13/2019 1:08:31 AM 2Population: Sheltered and Unsheltered Count
Persons in Households with only Children
Sheltered Unsheltered Total
Emergency Transitional Safe Haven
Total Number of
2 0 0 1 3
Households
Total Number of
2 0 0 1 3
children (under age 18)
Sheltered Unsheltered Total
Gender
(adults and children) Emergency Transitional Safe Haven
Female 1 0 0 1 2
Male 1 0 0 0 1
Transgender 0 0 0 0 0
Gender Non-
Conforming (i.e. not
0 0 0 0 0
exclusively male or
female)
Sheltered Unsheltered Total
Ethnicity
(adults and children) Emergency Transitional Safe Haven
Non-Hispanic/Non-
1 0 0 0 1
Latino
Hispanic/Latino 1 0 0 1 2
4/13/2019 1:08:31 AM 3Sheltered Unsheltered Total
Race
(adults and children) Emergency Transitional
White 1 0 0 0 1
Black or African-
1 0 0 0 1
American
Asian 0 0 0 0 0
American Indian or
0 0 0 0 0
Alaska Native
Native Hawaiian or
0 0 0 0 0
Other Pacific Islander
Multiple Races 0 0 0 1 1
Chronically Sheltered Unsheltered Total
Homeless
(adults and children) Emergency Transitional Safe Haven
Total number of
0 0 0 0
persons
4/13/2019 1:08:31 AM 4Point-in-Time Count TX-500 San Antonio/Bexar County CoC
Population: Sheltered and Unsheltered Count
Persons in Households without Children
Sheltered Unsheltered Total
Emergency Transitional Safe Haven
Total Number of
764 121 0 1,177 2,062
Households
Total Number of
persons 764 121 0 1,178 2,063
(Adults)
Number of Persons
37 8 0 50 95
(18 - 24)
Number of Persons
727 113 0 1,128 1,968
(over age 24)
Sheltered Unsheltered Total
Gender
(adults and children) Emergency Transitional Safe Haven
Female 258 24 0 271 553
Male 501 97 0 903 1,501
Transgender 5 0 0 4 9
Gender Non-
Conforming (i.e. not
0 0 0 0 0
exclusively male or
female)
Sheltered Unsheltered Total
Ethnicity
(adults and children) Emergency Transitional Safe Haven
Non-Hispanic/Non-
474 82 0 659 1,215
Latino
Hispanic/Latino 290 39 0 519 848
4/13/2019 1:08:31 AM 5Point-in-Time Count TX-500 San Antonio/Bexar County CoC
Sheltered Unsheltered Total
Race
(adults and children) Emergency Transitional Safe Haven
White 593 88 0 842 1,523
Black or African-
154 33 0 256 443
American
Asian 2 0 0 8 10
American Indian or
6 0 0 17 23
Alaska Native
Native Hawaiian or
1 0 0 4 5
Other Pacific Islander
Multiple Races 8 0 0 51 59
Chronically Sheltered Unsheltered Total
Homeless
(adults and children) Emergency Transitional Safe Haven
Total number of
170 0 160 330
persons
4/13/2019 1:08:31 AM 6Date of PIT Count: 1/24/2019
Population: Sheltered and Unsheltered Count
Total Households and Persons
Sheltered Unsheltered Total
Emergency Transitional Safe Haven
Total Number of
976 181 0 1,182 2,339
Households
Total Number of
1,364 321 0 1,187 2,872
Persons
Number of Children
383 135 0 5 523
(under age 18)
Number of Persons
63 15 0 50 128
(18 to 24)
Number of Persons
918 171 0 1132 2,221
(over age 24)
Gender
Sheltered Unsheltered Total
Emergency Transitional Safe Haven
Female 618 154 0 277 1,049
Male 740 167 0 906 1,813
Transgender 6 0 0 4 10
Gender Non-
Conforming (i.e. not
0 0 0 0 0
exclusively male or
female)
Ethnicity
Sheltered Unsheltered Total
Emergency Transitional Safe Haven
Non-Hispanic/Non-
732 162 0 667 1,561
Latino
Hispanic/Latino 632 159 0 520 1,311
Race
4/13/2019 1:08:31 AM 7Point In Time Summary for TX-500 - San Antonio/Bexar County CoC
Sheltered Unsheltered Total
Emergency Transitional Safe Haven
White 1032 226 0 847 2,105
Black or African-
293 83 0 256 632
American
Asian 3 5 0 8 16
American Indian or
8 0 0 17 25
Alaska Native
Native Hawaiian or
3 2 0 4 9
Other Pacific Islander
Multiple Races
Chronically 25 5 0 55 85
Sheltered Unsheltered Total
Homeless
Emergency Transitional Safe Haven
Total number of
183 0 160 343
persons
4/13/2019 1:08:31 AM 8Inventory Count Date: 1/24/2019
Population: Sheltered and Unsheltered Count
Unaccompanied Youth Households
Sheltered Unsheltered Total
Emergency Transitional Safe Haven
Total Number of
unaccompanied youth 39 8 0 50 97
households
Total number of
39 8 0 51 98
unaccompanied youth
Number of
unaccompanied 2 0 0 1 3
children (under age 18)
Number of
unaccompanied young 37 8 0 50 95
adults (age 18 to 24)
Sheltered Unsheltered Total
Gender
(unaccompanied
youth) Emergency Transitional Safe Haven
Female 20 7 0 4 31
Male 17 1 0 47 65
Transgender 2 0 0 0 2
Gender Non-
Conforming (i.e. not
0 0 0 0 0
exclusively male or
female)
Sheltered Unsheltered Total
Ethnicity
(unaccompanied
youth) Emergency Transitional Safe Haven
Non-Hispanic/Non-
6 3 0 21 30
Latino
Hispanic/Latino 33 5 0 30 68
4/13/2019 1:08:52 AM 1Point-in-Time Count TX-500 San Antonio/Bexar County CoC
Sheltered Unsheltered Total
Race
(unaccompanied
youth) Emergency Transitional Safe Haven
White 25 6 0 37 68
Black or African-
12 2 0 6 20
American
Asian 1 0 0 1 2
American Indian or
1 0 0 1 2
Alaska Native
Native Hawaiian or
0 0 0 0 0
Other Pacific Islander
Multiple Races 0 0 0 6 6
Chronically Sheltered Unsheltered Total
Homeless
(unaccompanied Safe
Emergency Transitional
youth) Haven
Total number of persons 0 0 0 0
4/13/2019 1:08:52 AM 2Inventory Count Date: 1/24/2019
Population: Sheltered and Unsheltered Count
Parenting Youth Households
Sheltered Unsheltered Total
Emergency Transitional
Total number of parenting
13 2 0 15
youth households
Total number of persons in
26 9 0 35
parenting youth households
Total Parenting Youth (youth
13 2 0 15
parents only)
Total Children in Parenting
13 7 0 20
Youth Households
Number of parenting youth
0 0 0 0
(under age 18)
Children in households with
parenting youth under age
0 0 0 0
18 (children under age 18
with parent under 18)
Number of parenting youth
13 2 0 15
(age 18 to 24)
Children in households with
parenting youth age 18 to
13 7 0 20
24 (children under age 18
with parents under age 25)
4/13/2019 1:08:52 AM 3Point-in-Time Count TX-500 San Antonio/Bexar County CoC
Sheltered Unsheltered Total
Gender
(parenting youth)
Emergency Transitional
Female 12 2 0 14
Male 1 0 0 1
Transgender 0 0 0 0
Gender Non-Conforming
(i.e. not exclusively male or 0 0 0 0
female)
Sheltered Unsheltered Total
Ethnicity
(parenting youth)
Emergency Transitional
Non-Hispanic/Non-Latino 7 1 0 8
Hispanic/Latino 6 1 0 7
Sheltered Unsheltered Total
Race
(parenting youth)
Emergency Transitional
White 6 2 0 8
Black or African-American 7 0 0 7
Asian 0 0 0 0
American Indian or Alaska
0 0 0 0
Native
Native Hawaiian or Other
0 0 0 0
Pacific Islander
Multiple Races 0 0 0 0
4/13/2019 1:08:52 AM 4Point-in-Time Count TX-500 San Antonio/Bexar County CoC
Sheltered Unsheltered Total
Chronically Homeless
(parenting youth) Emergency Transitional
Total number of households 0 0 0
Total number of persons 0 0 0
4/13/2019 1:08:52 AM 5Point-in-Time Count Veterans TX-500 San Antonio/Bexar
County CoC
Inventory Count Date: 1/24/2019
Population: Sheltered and Unsheltered Count
Persons in Households with at least one Adult and one Child
Sheltered Unsheltered Total
Emergency Transitional
Total Number of
7 0 0 7
Households
Total Number of
24 0 0 24
Persons
Total Number of
7 0 0 7
Veterans
Sheltered Unsheltered Total
Gender
(veterans only) Emergency Transitional
Female 2 0 0 2
Male 4 0 0 4
Transgender 1 0 0 1
Gender Non-
Conforming (i.e. not
0 0 0 0
exclusively male or
female)
Sheltered Unsheltered Total
Ethnicity
(veterans only) Emergency Transitional
Non-Hispanic/Non-
7 0 0 7
Latino
Hispanic/Latino 0 0 0 0
4/13/2019 1:09:16 AM 1Point-in-Time Count Veterans TX-500 San Antonio/Bexar County CoC
Sheltered Unsheltered Total
Race
(veterans only) Emergency Transitional
White 1 0 0 1
Black or African-
6 0 0 6
American
Asian 0 0 0 0
American Indian or
0 0 0 0
Alaska Native
Native Hawaiian or
0 0 0 0
Other Pacific Islander
Multiple Races 0 0 0 0
Chronically Sheltered Unsheltered Total
Homeless
(veterans only) Emergency Transitional
Total number of
0 0 0
households
Total number of
0 0 0
persons
4/13/2019 1:09:16 AM 2Inventory Count Date: 1/24/2019
Population: Sheltered and Unsheltered Count
Persons in Households without Children
Sheltered Unsheltered Total
Emergency Transitional Safe Haven
Total Number of
81 66 0 61 208
Households
Total Number of
81 66 0 61 208
Persons
Total Number of
81 66 0 61 208
Veterans
Sheltered Unsheltered Total
Gender
(veterans only) Emergency Transitional Safe Haven
Female 5 4 0 8 17
Male 75 62 0 53 190
Transgender 1 0 0 0 1
Gender Non-
Conforming (i.e. not
0 0 0 0 0
exclusively male or
female)
Sheltered Unsheltered Total
Ethnicity
(veterans only) Emergency Transitional Safe Haven
Non-Hispanic/Non-
59 51 0 43 153
Latino
Hispanic/Latino 22 15 0 18 55
4/13/2019 1:09:17 AM 3Point-in-Time Count TX-500 San Antonio/Bexar County CoC
Sheltered Unsheltered Total
Race
(veterans only) Emergency Transitional Safe Haven
White 53 50 0 43 146
Black or African-
25 16 0 11 52
American
Asian 0 0 0 1 1
American Indian or
2 0 0 2 4
Alaska Native
Native Hawaiian or
0 0 0 0 0
Other Pacific Islander
Multiple Races 1 0 0 4 5
Chronically Sheltered Unsheltered Total
Homeless
(veterans only) Emergency Transitional Safe Haven
Total number of
9 0 27 36
persons
4/13/2019 1:09:17 AM 4Point-in-Time Summary Veterans for TX-500 - San
Antonio/Bexar County CoC
Date of PIT Count: 1/24/2019
Population: Sheltered and Unsheltered Count
Total Households and Persons
Sheltered Unsheltered Total
Emergency Transitional Safe Haven
Total Number of
88 66 0 61 215
Households
Total Number of
105 66 0 61 232
Persons
Total Number of
88 66 0 61 215
Veterans
Gender
Sheltered Unsheltered Total
Emergency Transitional Safe Haven
Female 7 4 0 8 19
Male 79 62 0 53 194
Transgender
2 0 0 0 2
(male to female)
Transgender
0 0 0 0 0
(female to male)
Ethnicity
Sheltered Unsheltered Total
Emergency Transitional Safe Haven
Non-Hispanic/Non-
66 51 0 43 160
Latino
Hispanic/Latino 22 15 0 18 55
Race
Sheltered Unsheltered Total
Emergency Transitional Safe Haven
4/13/2019 1:09:17 AM 5Point In Time Summary for TX-500 - San Antonio/Bexar County CoC
White 54 50 0 43 147
Black or African-
31 16 0 11 58
American
Asian 0 0 0 1 1
American Indian or
2 0 0 2 4
Alaska Native
Native Hawaiian or
0 0 0 0 0
Other Pacific Islander
Multiple Races 1 0 0 4 5
Chronically Sheltered Unsheltered Total
Homeless
Emergency Transitional Safe Haven
Total number of
9 0 27 36
persons
4/13/2019 1:09:17 AM 6Additional Homeless Populations Summary for TX-500 -
San Antonio/Bexar County CoC
Date of PIT Count: 1/24/2019
Population: Sheltered and Unsheltered Count
Other Homeless
Subpopulations
Unsheltere
Sheltered Total
d
Safe
Emergency Transitional
Haven
Adults with a Serious
373 36 0 328 737
Mental Illness
Adults with a Substance
260 34 0 194 488
Use Disorder
Adults with HIV/AIDS 11 8 0 18 37
Adult Survivors of
324 74 0 82 480
Domestic Violence
4/13/2019 1:09:32 AM 1You can also read


