Mollymawk Chick Numbers and Survival on Campbell Island, November 2019-March 2020
←
→
Page content transcription
If your browser does not render page correctly, please read the page content below
Mollymawk Chick Numbers and Survival
          on Campbell Island,
     November 2019–March 2020

      Peter G.H. Frost 1 and Claudia Mischler 2
           1
               Science Support Service,
               87 Ikitara Road, Whanganui 4500
               pghfrost@xtra.co.nz

           2
               Department of Conservation,
               15 Wairepo Road, Twizel 7901
               cmischler@doc.govt.nz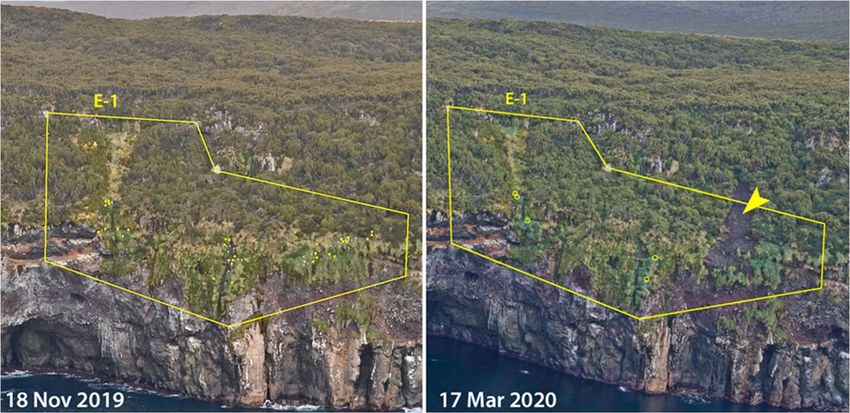
Summary
An aerial photographic survey of the mixed Campbell Mollymawk, Thalassarche
impavida, and Grey-headed Mollymawk, Thalassarche chrysostoma, colonies along
the north-east coast of Campbell Island was carried out on 17 March 2020. At this
time, most of the birds present at these colonies would have been chicks. The aim of
the study was therefore to establish the number of chicks in these colonies and relate
this to the number of nesting adults estimated from a combined aerial and ground-
level photographic survey carried out earlier in the nesting season, 18–24 November
2019. Campbell Mollymawks made 90 % of these nesting birds, with Grey-headed
Mollymawks the remainder.

Counts were made independently by two analysts and the results averaged. A total
of 7890 chicks of both species combined were recorded across four colony groups:
Bull Rock South (containing 54.6 % of the total); Bull Rock North (24.8 %); the
Eastern colonies (19.1 %); and Sorensen Tarn (1.5 %). Assessed against the number
of apparently active nests in November 2019 (i.e. ones assumed to contain an egg,
taken to be 82 % of the apparently occupied nests counted at that time), the survival
rate from November to March at these colonies was: Bull Rock South, 60.6 %; Bull
Rock North, 62.6 %; the Eastern colonies, 70.4 %; and Sorensen Tarn, 99.1 %.

These nest survival estimates cover only the last third of the incubation period and
the first 60–70 % of the fledging period and so are not really comparable with the
more conventional measures of nesting success. To put them into this broader
context, two assumptions were made. First, that the number of active nests at the
start of the breeding season in early October could be reasonably estimated using
published regression equations that express the number of nests on a given date as
a percentage of that initial number. In the case of these four colony groupings, this
was estimated as 94.6 %, giving an initial number of nests of 13,215 (both species
combined). Second, that the survival of the chicks subsequent to 17 March to
fledging, approximately 41 days later, can be estimated from a study of chick survival
during the nestling period carried out in the late-1980s for both species separately.
This showed shallow linear declines in the number of chicks alive during the latter
part of the nestling period, following steeper reductions in chick numbers earlier in
that period. Taken together, these figures gave an average daily survival rate of
0.99919 day-1, weighted by the proportion of the two species in the study colonies
earlier in the season. Extrapolated through to the end of fledging, this suggests that
around 7632 mollymawk chicks could have fledged by the end of the season, an
estimate of nesting success of 57.8 %. The upper bound on this nesting success is
59.7 %, set by assuming no more chick mortality after 17 March (i.e. 7890 chicks
fledged). The corresponding lower bound is 50.7% (6696 chicks fledged), determined
by assuming that the calculated daily survival rate between November 2019 and
March 2020 (0.99597 day-1) continues through the rest of the nestling period.

With these assumptions as a caveat, overall nesting success at the mixed mollymawk
colonies along the north-east coast of Campbell Island during the 2019–20 breeding
season was 50–60 %, with a best estimate of around 58 %. This is broadly in line
with the level of nesting success measured for Campbell Mollymawk during 1984–96,
the predominant species present in these colonies.

                                                                                    1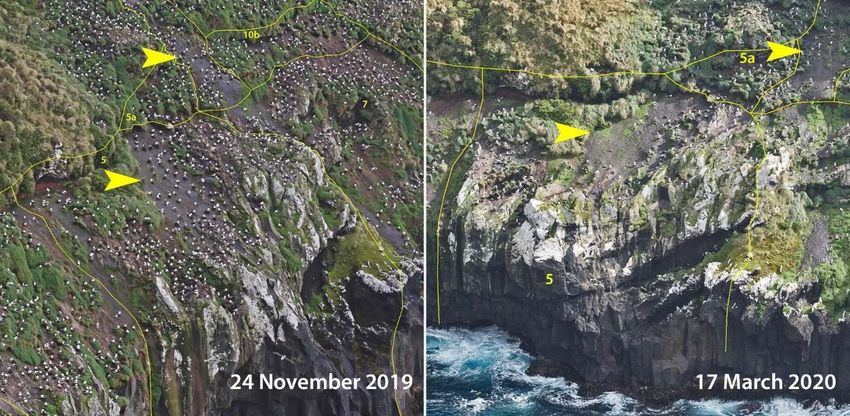
Introduction
Measures of nesting success and breeding productivity are challenging to obtain for
long-lived, slow reproducing seabirds, especially those breeding on New Zealand’s
sub-Antarctic islands. The remoteness of these sites, difficulties of access and,
currently, few extended stays by researchers during a species’ prolonged breeding
season, all compound the difficulty. Yet, good measures of success are essential to
complement other demographic parameters needed to model a species’ population
dynamics, such as age and stage survival, age at first breeding and breeding
frequency. This is especially so for vulnerable or threatened species, ones either
breeding only on a single island group or which are declining.

Two such species within New Zealand’s jurisdiction are the Campbell Mollymawk,
Thalassarche impavida, which breeds only on Campbell Island, the southernmost of
New Zealand’s sub-Antarctic islands, and the Grey-headed Mollymawk, Thalassarche
chrysostoma, a biennial-breeding species with a wide circumpolar distribution
centred on South Georgia but which is declining globally (ACAP 2012a, b). Campbell
Mollymawk numbers have varied since the 1940s, declining by -2.6 % per year from
the mid-1940s to mid-1980s, and even more at some colonies (up to -5.9% per year
at the Bull Rock North colony during 1967–82), then staging a recovery, increasing
at 1.1 % per year during 1985–97 (Waugh et al. 1999). The Grey-headed Mollymawk
population on Campbell I. has also declined sharply, by 82–88 % over a 55-year
period from the early 1940s to late-1990s, but without any sign of recovery (Moore
2004). The modelled rate of change during the 1990s, was -2.8% per year (Waugh
et al. 1999).

The aim of this study was to count the number of Campbell and Grey-headed
Mollymawk chicks from aerial photographs taken in mid-March 2020 of the mixed
mollymawk colonies lying along the north-east coast of Campbell I. These would
complement counts of the number of apparently occupied nests made from aerial
and ground-level photographs taken earlier in the breeding season. In November
2019, these north-east colonies together supported an estimated 15,238 pairs of
nesting mollymawks, 90 % of which were Campbell Mollymawks. Overall, the colonies
held 60.4 % of nesting Campbell Mollymawks and 25.7 % of the nesting Grey-headed
Mollymawk population on Campbell I. (Frost 2020).

Methods
Images of the mixed mollymawk colonies lying along the northeast coast of Campbell
I. were taken between 1310 h and 1314 h on 17 March 2020 from a New Zealand
Navy helicopter flying from the HMNZS Canterbury. The flight path covered the
numerous, mostly small, Eastern colonies; the large Bull Rock South and Bull Rock
North colonies; and the small group of Campbell Mollymawks nesting around
Sorensen Tarn, above Bull Rock South.

Photographs were taken with a Nikon D5 camera fitted with a 24.0-70.0 mm f/2.8
lens. Shutter speed (1/400s), aperture (F8.0) and ISO number (800) were fixed
throughout but focal length varied. Two-thirds of the photographs were taken at focal
lengths
Photographs were taken from 90–190 m offshore (mean distance 123±31 m, N=13),
based on calculations using focal length, sensor dimensions, and horizontal ground
distances estimated from Google Earth on those images where the coast was
approximately parallel to the plane of the image. Total flight time, from the Northeast
Harbour entrance to North Cape, a distance of approximately 5.2 km, took 3.7 min,
an average speed of 45 knots. The distance flown offshore together with the short
duration of the flight is likely to have kept disturbance to a minimum. Few adult birds
were seen in the air, greatly reducing any risk of collision.

The images were assessed by two analysts working independently. PGHF processed
the images using Photoshop Elements 2020 (v18.0) to enhance lighting, contrast and
colour. Some images were further processed using Topaz Sharpen AI (v2.1.7), to
stabilize, sharpen or focus them depending on which process best enhanced the
details, to make it easier to distinguish individual birds and differentiate chicks from
adults and their surroundings. Both analysts used the counting software DotDotGoose
(Ersts 2020).

The boundaries of these colonies and subsets within them were digitally drawn on
the images, following the lines depicted by Moore (1999). The same boundaries were
used on images taken in November 2019 to determine the numbers of apparently
nesting birds in these colonies (Frost 2020), thus making the two data sets broadly
comparable. The exception was the Bull Rock North colony where PGHF used Moore’s
(1999) boundaries, while CM used borders drawn up during an initial attempt to count
nesting birds on the November 2019 images. The fine-scale demarcation of the sub-
colonies, when aggregated, produced a similar layout to the coarse-scale delineation
used by CM, thereby making the two groupings largely equivalent.

Two images covered the small Sorensen Tarn colony, each from a different angle.
Because the tarn is situated in steep-sided, 1–3 m, water-filled depression, several
chicks were situated under the vegetated overhangs, rendering them invisible in one
image but apparent in the other. Consequently, the tarn was partitioned into five
areas, identical in both images, and the numbers of chicks counted in both sets. The
highest number in each of the five parallel sets was chosen and their sum used to
give the total number of chicks present on the tarn. Calculated this way, this is a
minimum number.

Two adjustments had to be made for the analysis of the 30 Eastern colonies and sub-
colonies. First, for comparative purposes, the number of chicks counted in colonies
1–6 was compared with the number of apparently occupied nests recorded on 18
November 2019 because the marginally better-quality aerial photographs taken on
24 November did not cover these 6 colonies adequately. This 6-day difference in
timing was considered in any subsequent calculations involving time intervals.

Second, the aerial photograph taken of sub-colony 23c in March 2020 only covered
the southern half. Consequently, the apparently occupied nests visible in this sub-
colony in November 2019 were counted again, omitting the area not covered in the
March 2020 photograph. The area photographed in March 2020 contained 89 nests
in November 2019, 72 % of the whole for this sub-colony.

In most of the images the birds were small, often distinguishable only as discrete
white or grey dots. This made it difficult to identify them as anything other than just

                                                                                      3
mollymawks, either chicks or adults. Given the late stage in the breeding season, we
assumed that most of the birds were chicks. This meant that where we could not
reasonably clearly identify a bird as an adult, it was marked as a chick. This gives an
upper bound for the number of chicks in these colonies. Where possible, however,
chicks and adults were differentiated on the following criteria.
Chicks
Birds were classed as chicks if they were sitting horizontally or, if sitting upright on
their tarsi, their rears were on the ground. Standing birds were classed as chicks if
their heads and necks were stretch more-or-less horizontally. Where an adult was
nearby, birds either adopted this posture, which we interpreted as begging, or
assumed a submissive posture (head down).
Adults
Birds were classed as adults if they were positioned close to a chick, with the usually
smaller bird facing the adult, occasionally with head and neck outstretched,
apparently begging. Other features of birds taken to be adult included standing
upright with head held high and the body horizontal to the ground; having a
noticeably dark back, scapulars and wing feathers; having distinctly pale legs and
feet (chicks of both species have grey legs and feet); and, occasionally, showing a
yellow/orange bill (even if only 1 pixel wide), a feature of adult Campbell Mollymawks
(chicks of both species have grey bills; the bill of an adult Grey-headed Mollymawk
would appear the same, given the small size of the birds on the images).
Several birds had greyish heads. These were not automatically classed as adult Grey-
headed Mollymawks because near-fledging Grey-headed Mollymawks also have
greyish heads. Most chicks of this species would have had less fully developed
plumage than Campbell Mollymawk chicks at this time in the season, however, given
the Grey-headed Mollymawk’s longer fledging period (G. A. Taylor pers. comm.), so
the possibility of these birds being adults was always considered first.
On many occasions, such as in well-vegetated areas around the smaller Eastern
colonies, only a presumed head of a chick, or a greyish/whitish chick-sized smudge
partly screened by vegetation, was visible. In such cases, the corresponding area in
the November 2019 images was checked. If there was an adult present at this
position in 2019, the small spot or smudge was counted as a chick.
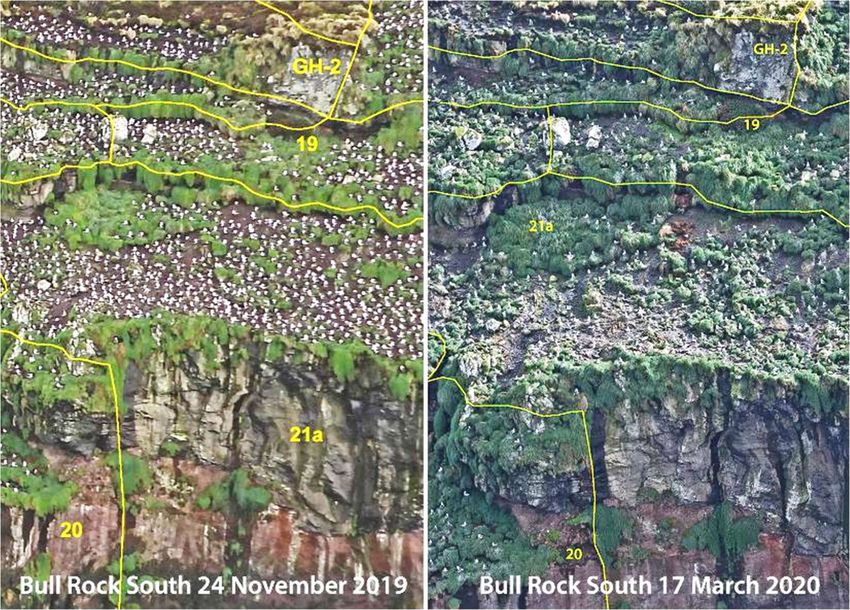
The most problematic areas were in the Bull Rock South colony (and to a much lesser
extent in Bull Rock North) where chicks were standing or sitting among similar-sized
and coloured rocks. These images were re-processed to bring out as much detail as
possible, but this was often only partly successful, even when studied alongside the
November 2019 images. In such cases, personal judgement was used conservatively.
The counts made by the two analysts were averaged. Although there was sometimes
considerable disparity in the numbers of chicks counted in individual sections of these
colonies, which may be due to slightly differing alignments of the section boundaries
and to differences in interpretation as to which were chicks and which were adults,
the overall differences were slight. They ranged from 0.9 % (nett difference 17
chicks) at Bull Rock North, 2.6 % (3 chicks) at Sorensen Tarn, to 3.2 % (140 chicks)
and 3.3 % (51 chicks) at Bull Rock South and the Eastern Colonies, respectively.
4To calculate nest survival, account was taken of the observation by Rexer-Huber et
al. (2020) that only 82 % of a sample of 311 occupied nests (both species combined),
surveyed in the Bull Rock South colony on 20 November 2019, contained eggs. The
remainder were empty, occupied either by non-breeders or birds that had already
failed. Assuming that this figure applies more widely, the number of apparently
occupied nests counted during the combined aerial and ground survey in November
2019 was reduced proportionately, to give an estimate of the number of apparently
active nests. This is a reasonable assumption, given that from wider surveys carried
out in mid-October 1995–97, the percentage of Campbell and Grey-headed
Mollymawk nests with eggs was 85.2 % and 79.5 %, respectively (Moore 2004).
To estimate overall nesting success, from egg laying through to fledging, we made
various assumptions. First, that the number of nests at the start of the 2019–20
breeding season (Nt0) can be reasonably estimated using the equations published by
Moore (2004) to calculate the percentage (y) of the mid-October number of
apparently active nests present on the date in question (18-24 November in this
case, when the aerial and ground surveys of nesting birds were carried out). The
equation used here, for all colonies except Bull Rock North, was:
y = 133.31-0.1185x (where x is the Julian day of the year)
For Bull Rock North (Moore, 2003), the equation used was:
y = 144.47-0.1522x
From these values for y, the number of active nests in mid-October (Nt0) was
calculated as:
Nt0 = 100 Nt1/y
where Nt1 was the estimated number of active nests present in November 2019.
Second, to estimate the number of chicks likely to have fledged in April–May (Nf) we
formed three models. To estimate an upper bound to fledging survival, we assumed
no further mortality of chicks from mid-March through to fledging:
Nf = Nt2
where Nt2 is the number of chicks estimated in the second survey.
This is not an entirely unreasonable assumption given the sharp decline in chick
mortality due to predation by Subantarctic Skua, Catharcta antarctica, from early
February onwards. Skuas take many unattended small, downy chicks during the early
post-guard period, but the nestlings soon become more daunting prey as they grow
up to twice the size of a skua and can regurgitate large quantities of stomach oil
defensively. Skua predation is therefore biased towards the first half of the
mollymawk nestling period, when they are rearing their own chicks. By early
February, however, around six weeks into the mollymawk nestling period, most skua
chicks have fledged and have left the island along with most adults, so skua predation
declines (G.A. Taylor pers. comm.).
5Nevertheless, underweight mollymawk chicks are still vulnerable to mortality during
cold, wet conditions, even at this late stage (Moore & Moffat 1990), so some mortality
should be expected. The only available data on chick survival during the late fledging
period comes from Campbell I. in the late-1980s (Moore & Moffat 1990). This showed
greatly increased survival among Campbell Mollymawk chicks after the first third of
the on-average 130-day nestling period. The pattern was different for the smaller
sample of Grey-headed Mollymawk nests, with three-quarters of the chicks being lost
during the 27-day guard-phase. Chick survival improved substantially after this, but
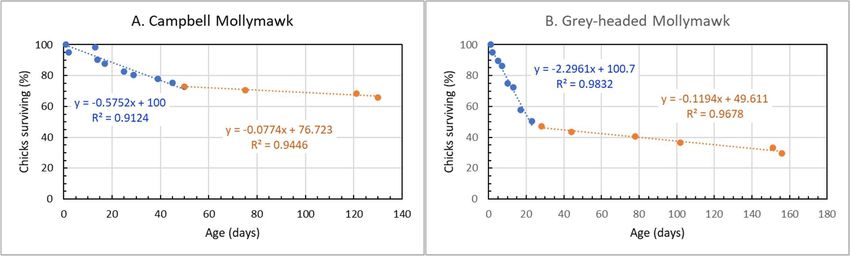
these was still some mortality (Figure 1).
Figure 1. Survival of A. Campbell and B. Grey-headed Mollymawk nestlings with age, derived from Moore
& Moffat (1990: Fig. 4), based on data collected during the 1987–88 breeding season, and used in this
study to estimate daily survival rates during the latter part of the nestling period.
Overall, for the latter part of the fledging period the relationship, percent chicks alive
(y) vs age (x, days), was strongly and significantly linear for both species (Figure 1):
y = -0.0774 x + 76.723 (r = 0.9719, p < 0.01) for Campbell Mollymawk, and
y = -0.1194 x + 49.611 (r = 0.9848, p < 0.001) for Grey-headed Mollymawk
Daily survival rates (ŝ) determined from the slope of these regressions (b) are
0.99923 day-1 for Campbell Mollymawk, and 0.99881 day-1 for Grey-headed
Mollymawk, calculated as:
ŝ = (1+(b/100))
These gave a weighted average (ŝw) of 0.99919 day-1, assuming that the 9:1 ratio of
Campbell to Grey-headed Mollymawks in these colonies when surveyed in November
2019 broadly still held. The remaining nestling period was estimated to be 41 days,
based on the weighted average of the projected remaining period to fledging of
Campbell Mollymawks (c.39 days assuming a 198-day nesting period: ACAP 2012a)
and Grey-headed Mollymawks (c.60 days, assuming a 218-day nesting periods: ACAP
2012b), given 10 October as the end of egg laying.
Therefore, the second model of chick survival was to apply this daily survival rate
(ŝw) to the estimated number of chicks present in March 2020 (Nt2) that could have
survived to fledge 41 days later on average (Nf) as:
Nf = Nt2.ŝw41
6The third model was designed to set a lower bound to nesting success. It assumed
that the survival of chicks from 17 March to fledging continued at the same daily rate
as calculated for the period November 2019–March 2020. Following Johnson & Klett
(1985), we estimated of daily survival rate (ŝx) over this period as:
ŝx = √(S(t1-t2)) = (S(t1-t2))1/(t2-t1)
(t2-t1)
where S = proportion of nests that survived between 24 November 2019 (t1) and 17
March 2020 (t2), a period of 114 days (120 days in the case of Eastern colonies E1-
E6). The number of chicks present in March 2020 (Nt2) that could have survived to
fledge 41 days later on average (Nf) was then calculated as:
Nf = Nt2.ŝx41
In all cases, overall nesting success was calculated as the number chicks estimated
to have fledged (Nf) expressed as a percentage of the number of active nests
estimated to have been present in mid-October (Nt0).
Results
A total of 7890 chicks were counted across all four sites, just under 55 % of which
occurred in the large Bull Rock South colony (Table 1). This represents an overall
survival of 63.1 % for the 12,496 estimated active nests during the intervening 114-
day period (120 days in the case of Eastern colonies E1-E6). Adults comprised just
3.6 % of the birds present at these colonies.
Table 1. Number of mollymawk chicks counted on the north-eastern coastline of Campbell
Island, 17 March 2020, relative to the number of nests with eggs, assumed to be 82% of all
apparently occupied nests counted from aerial and ground-level photographs of these colonies
taken between 18–24 November 2019 (see text for details). The number of chicks in each
region is the mean value obtained by two independent analysts.
Occupied Estimated Number
nests active nests of chicks % survival
Region Nov 19 Nov 19 Mar 2020 Nov-Mar
Eastern colonies 2613 2144 1510 70.4
Bull Rock South 8677 7115 4310 60.6
Bull Rock North 3807 3121 1955 62.6
Sorensen Tarn 141 116 115 99.1
Total 15,238 12,496 7890 63.1
Survival varied greatly both within and between colonies in a region (Annex tables
A1–A3). At some of the Eastern colonies (E10a, E19-20), Bull Rock North (BRN17-
18) and Sorensen Tarn almost all chicks apparently survived from November to March
(Annex tables A1-3). For some of these, this may be a result of underestimating the
number of active nests in November, calculated overall as 82 % of the number of
apparently occupied nests counted then. This may also explain the apparent anomaly
at Eastern Colony E13b/14, where survival seemingly exceeded 100%. For Sorensen
Tarn, however, it could indicate the difficulties Subantarctic Skua probably face in
preying on eggs and chicks, given the lack of almost anywhere suitable to land in the
water-filled tarn from which to launch an attack (G.A. Taylor pers. comm.).
7The causes of nest failure or chick loss are not known. Skua predation is undoubtedly
a major factor (Moore & Moffat 1990), although we have no data on this. The small
Eastern colony, E1, appeared to have been struck by a landslip that took out some
nests and probably disrupted others (Figure 2). Minor slips were apparent at some
other colonies (e.g. Eastern colonies E4 and E8a, and BRN17), while at Bull Rock
North, several bare areas on steep slopes, on which many birds were nesting in
November 2019, appear to have been swept clean (Figure 3). This suggests that one
or more storms may have been a factor affecting nest/chick survival.
Figure 2. View of Eastern colony E-1 in November 2019, showing the positions of apparently nesting
birds (yellow dots), and in March 2020, showing the locations of the six surviving chicks (yellow circles).
A major landslip, which may have disrupted nesting on the right-hand side of the colony, is arrowed.
Figure 3. Bull Rock North sub-colonies 5 and 10a (part), both arrowed, showing bare areas that had
nesting mollymawks in November 2019, but which appear to have been swept clean of nests by March
2020.
8With 61.3 % of nests active in November 2019 surviving to mid-March 2020, 114–
120 days later, overall daily survival rate was calculated to be 0.99597 day-1. If this
rate remained constant during the remaining average 41 days to fledging, then
around 6696 chicks could have fledged from these colonies by the end of the 2019–
20 breeding season (Table 2). Expressed as a percentage of nests likely to have been
present in early October, the start of the breeding season, this gives a minimum
overall estimate for nesting success of 50.7 %. Conversely, if no more nests failed
from mid-March to fledging in late-April, 7890 chicks would have fledged, giving an
overall maximum estimate for nesting success of 59.7 % (Table 2).
Table 2. Estimated overall nesting success in the mixed Campbell and Grey-headed
Mollymawks colonies along the north-eastern coast of Campbell Island (see text for details of
how the number of mollymawk nests in early October, and the maximum and minimum
number of chicks fledging, were estimated)
Upper and lower
Estimated number bounds to overall
Estimated Estimated
of chicks fledging nesting success
no. nests active nests
Region mid-Oct 2019 mid-Nov 2019 (minimum) (maximum) (%)
Eastern colonies 2267 2144 1331 1510 58.7–66.6
Bull Rock South 7524 7115 3599 4310 44.5–57.3
Bull Rock North 3301 3122 1652 1955 46.6–59.2
Sorensen Tarn 123 116 115 115 94.3
Total 13,215 12,497 6696 7890 50.7–59.7
Accepting that some chicks may still die from malnutrition or other incidental factors,
a more realistic estimate of nesting success would be to assume a higher daily
survival rate during the latter part of the nestling period but one that is still < 1.
Using a combined daily survival rate 0.99919 day-1, calculated using Moore & Moffat’s
(1990) data for chick survival during the latter part of the 1987-88 nesting season,
and applying this to the estimated number of chicks alive in March 2020, suggests
around 7632 mollymawk chicks could have survived to fledging, giving an estimated
nesting success of 57.8 %.
Discussion
During the 2019–20 breeding season on Campbell I., a total of 7890 active Campbell
and Grey-headed Mollymawks nests survived through the last third of the incubation
period up to the first 60–70 % of the nestling period. Conventionally, nesting success
is calculated for two discrete periods, incubation and nestling. It is measured as the
product of hatching success (the proportion of eggs that hatch to produce a chick)
and fledging success (the proportion of hatched chicks that fledge successfully).
Studies at Bull Rock South, carried out in the 1980s and 1990s, have shown
substantially higher nesting success in Campbell Mollymawk (52 %, Moore & Moffat
1990; 66 ± 12 % [±s.d., N = 6 years], Waugh et al., 1999) than Grey-headed
Mollymawk (16 %, Moore & Moffat 1990; 40 ± 20% [N = 6 years], Waugh et al.,
1999). In both species, hatching success was higher than fledging success: 80–86%
vs 65–79% in Campbell Mollymawk; 56–80% vs 29–51% in Grey-headed Mollymawk
(Moore & Moffat 1990, Waugh et al. 1999).
9The crude measure of success in this study (0.613 or 63.1%) cuts across both these
periods, but only partly so for each. It is not strictly comparable therefore with these
earlier findings. This complicates efforts to interpret the contemporary significance of
the 2019–20 measure. The only broadly comparable statistic comes from work by
P.J. Moore and colleagues who surveyed sections of the Bull Rock South and Bull
Rock North colonies at least four times during each of the 1993–94 and 1994-95
breeding seasons: in mid-October, late-December, mid-March and late-April (Moore
2002, 2008). From these data, daily survival rate of nests of both species combined
can be calculated. For the nearest comparable period to the data for 2019–20, late-
December to mid-March, the daily survival rates for nests in both colonies taken
together were 0.99291 day-1 and 0.99279 day-1, in 1993–94 and 1994–95,
respectively. The equivalent figure for 2019–20 was higher, 0.99597 day-1,
suggesting that at this mid-stage of the breeding season, 2019–20 was at least as
good as, if not better than in these earlier years.
Using Moore’s (2004) regression equations applied to the number of nests assumed
to be active in November 2019, some 13,215 active nests could have been present
at the start of the breeding season. If no more nests failed after 17 March, 7890
chicks would have fledged in late-April/early-May, giving an upper bound to nesting
success for 2019–20 of 59.7 %, within the range of earlier measures.
Conversely, by extrapolating the mean daily survival rate during November 2019–
March 2020 through to fledging, a lower bound to nesting success was calculated. By
this measure, at least 6696 chicks would have fledged, giving a minimum nesting
success for the 2019–20 breeding season of around 50.7 % for both species
combined, slightly below that found in earlier studies for Campbell Mollymawk but
above that for Grey-headed Mollymawk (Moore & Moffat 1990, Waugh et al. 1999).
A more realistic estimate of nesting success, accepting that some chicks would die
during the latter part of the nestling period, assumed a daily survival rate of 0.99919
day-1, based Moore & Moffat’s (1990) data for chick survival during the latter part of
the 1987-88 nesting season. This suggests around 7632 mollymawk chicks fledging
by the end of the season, a nesting success around 57.8 %. This is within the range
of the 1984–96 estimates for Campbell Mollymawk (66% [95% CL 56.4–75.6],
Waugh et al. 1999), the predominant species in the colonies surveyed in March 2020.
Broadly speaking therefore, overall nesting success in these colonies in 2019–20 was
50–60 %, with a best estimate of around 58 %. This conclusion is based on several
assumptions and extrapolations, however, and so should be judged accordingly.
Acknowledgments
We are grateful to Leading Aircraftsman Dillon Anderson who took the aerial
photographs at the request of CM. Peter Moore gave valuable information and
insights for which we are also most grateful. Igor Debski (Department of
Conservation) kindly made available the unpublished spreadsheets originally
compiled by Peter Moore. Graeme Taylor (Department of Conservation) provided the
stimulus and funding for this study, as well as much useful feedback. The November
2019 ground and aerial survey, on which this study builds, was organised and carried
out by Kalinka Rexer-Huber and Kevin Parker.
10References
ACAP (Agreement on the Conservation of Albatrosses and Petrels). 2012. Species
assessment: Campbell Albatross Thalassarche impavida. Online at
https://www.acap.aq/resources/acap-species/293-campbell-albatross/file
(downloaded 20 July 2018)
ACAP (Agreement on the Conservation of Albatrosses and Petrels). 2010. ACAP
Species assessment: Grey-headed Albatross Thalassarche chrysostoma. Online at
https://www.acap.aq/resources/acap-species/248-grey-headed-albatross/file
(downloaded 20 July 2018).
Ersts, P.J. 2019. DotDotGoose (version 1.5.0). American Museum of Natural History,
Center for Biodiversity and Conservation. New York, NY. Available from
http://biodiversityinformatics.amnh.org/open_source/dotdotgoose [accessed 17
April 2020].
Frost, P. 2020. Status of Campbell Island and Grey-headed mollymawks on the
northern coasts of Campbell Island, 2019. Final report for project BCBC2019-03.
Department of Conservation. 24 pp. Online at https://www.doc.govt.nz/
globalassets/documents/conservation/marine-and-coastal/marine-conservation-
services/reports/final-reports/bcbc2019-03-campbell-island-seabird-project-final-
report-frost.pdf
Moore, P.J. 2002. Counting mollymawks on Campbell Island – data supplements.
Science & Research Internal Report, 192. Department of Conservation, Wellington,
New Zealand.
Moore, P.J. 2003. DOCDM-453700 [unpublished spreadsheet]. Department of
Conservation, Wellington, New Zealand.
Moore, P. 2004. Abundance and population trends of mollymawks on Campbell
Island. Science for Conservation, 242. Department of Conservation, Wellington, New
Zealand.
Moore, P.J. 2008. DOCDM-453701 [unpublished spreadsheet]. Department of
Conservation, Wellington, New Zealand.
Moore, P.J.; Moffat, R.D. 1990. Mollymawks on Campbell Island. Science and Internal
Report Series 59, Department of Conservation, Wellington, New Zealand. Online at
https://www.doc.govt.nz/documents/science-and-technical/SRIR59.pdf.
Rexer-Huber, K.; Parker, K.A.; Parker, G.C. 2020. Campbell Island seabirds:
Operation Endurance November 2019. Final report to Marine Species and Threats,
Department of Conservation, Wellington, New Zealand. Parker Conservation,
Dunedin. 23 p. Online at https://www.doc.govt.nz/globalassets/documents/
conservation/marine-and-coastal/marine-conservation-services/reports/final-
reports/bcbc2019-03-campbell-island-seabird-project-report.pdf
Waugh, S.M., Weimerskirch, H., Moore, P.J., and Sagar, P.M. 1999. Population
dynamics of Black-browed and Grey-headed Albatrosses Diomedea melanophrys and
D. chrysostoma at Campbell Island, New Zealand, 1942-96. Ibis 141: 216-225.
11Annex
Table A1. Average count of mollymawk chicks in mid-March 2020 relative to the number of
mollymawks estimated to be sitting on eggs in the Eastern colonies in November 2019 (see
text for details), and the estimated number of Campbell and Grey-headed Mollymawks among
these. The given number of chicks recorded in March 2020 is the average of the counts by
two observers. The difference in these counts across all areas was 3.3 %.
Estimated number of nests
Both species
Nov 2019
Mollymawks Number of % survival
nests with eggs Campbell Grey-headed chicks Mar Nov 2019-Mar
Area Nov 2019 mollymawk mollymawk 2020 2020
E-1 25 20 5 5 20.0
E-2 16 12 3 12 75.0
E-3 36 30 7 20 55.6
E-4 16 13 3 7 43.8
E-5a 63 51 12 38 60.3
E-5b 25 20 5 20 80.0
E-6a 57 46 11 27 47.4
E-6b 35 29 7 24 68.6
E-7 67 54 13 60 89.6
E-8a 51 41 10 39 76.5
E-8b 18 15 3 16 88.9
E-9 16 13 3 13 81.3
E-10a 3 2 1 3 100.0
E-10b 21 16 4 14 66.7
E-11a 9 7 2 7 77.8
E-11b 29 23 6 15 51.7
E-12 33 26 7 25 75.8
E-13a 73 59 14 43 58.9
E-13b/14 21 17 4 25 119.0
E-15 upper 863 698 165 594 68.8
E-15 lower 275 222 52 210 76.4
E-16/17 64 52 12 55 85.9
E-18 4 3 1 3 75.0
E-19 13 11 2 13 100.0
E-20 39 32 7 39 100.0
E-23a 81 65 16 68 84.0
E-23b 50 40 10 32 64.0
E-23c [S part] 73 59 14 43 58.9
E-24 68 55 13 47 69.1
Total 2144 1731 412 1510 70.4
12Table A2. Number of mollymawk chicks counted in mid-March 2020 relative to the number of
mollymawks estimated to be sitting on eggs in the Bull Rock South colony (A) and Sorensen
Tarn (B) in November 2019 (see text for details), together with the estimated number of
Campbell and Grey-headed Mollymawks in each area. The number of chicks recorded in March
2020 is the average of the counts by two observers. The differences in these counts across
all areas in Bull Rock South and at Sorensen Tarn were 3.2 % and 2.6 %, respectively.
Estimated number of nests
A Both species
Nov 2019
Mollymawks Number of % survival
nests with eggs Campbell Grey-headed chicks Mar Nov 2019-Mar
Area Nov 2019 mollymawk mollymawk 2020 2020
BRS-1 11 10 1 7 63.6
BRS-1a 29 29 0 4 13.8
BRS-2 68 41 27 43 63.2
BRS-3 486 437 49 273 56.2
BRS-4 104 93 11 47 45.2
BRS-5a 293 245 48 148 50.5
BRS-5b 518 518 0 318 61.4
BRS-6 213 208 5 104 48.8
BRS-7 17 16 1 8 47.1
BRS-9 216 216 0 97 44.9
BRS-10 198 182 16 108 54.5
BRS-11 240 236 4 116 48.3
BRS-12 207 205 2 157 75.8
BRS-13 145 143 2 98 67.6
BRS-14 252 249 3 134 53.2
BRS-15 287 287 0 190 66.2
BRS-16 168 163 5 113 67.3
BRS-17 462 448 14 284 61.5
BRS-18 111 111 0 57 51.4
BRS-19 194 187 6 104 53.6
BRS-20 149 143 6 119 79.9
BRS-21a 578 552 26 379 65.6
BRS-21b 441 421 20 265 60.1
BRS-22 244 166 80 192 78.7
BRS-bbt 1117 1092 25 683 61.1
BRS-SS, a-c 207 207 0 156 75.4
BRS-d 105 94 11 68 64.8
BRS-GH2 54 35 19 44 81.5
Total 7115 6734 381 4310 60.6
Estimated number of nests
B Both species
Nov 2019
Mollymawks Number of % survival
sitting Campbell Grey-headed chicks Mar Nov 2019-Mar
Area Nov 2019 mollymawk mollymawk 2020 2020
Sorensen Tarn 116 116 0 115 99.1
13Table A3. Number of mollymawk chicks counted in mid-March 2020 relative to the number of
mollymawks estimated to be sitting on eggs in the Bull Rock North colony in November 2019,
together with the estimated number of Campbell and Grey-headed Mollymawks among these
(see text for details). A. Counts made by PGHF, who analysed the images by section
boundaries given in Moore (1999). B. Average counts of chicks by both assessors across four
aggregated sections of the Bull Rock Colony, following the divisions used by CM. The
difference in these counts across all areas was 0.9 %.
Estimated number of nests
A. Both species
Nov 2019
Mollymawk Number of % survival
nests with eggs Campbell Grey-headed chicks Mar Nov 2019-
Area Nov 2019 mollymawk mollymawk 20201 Mar 2020
BRN-1 51 26 25 24 47.1
BRN-2 51 39 12 30 58.8
BRN-3 115 114 1 73 63.5
BRN-4 165 163 2 132 80.0
BRN-5 264 262 2 130 49.2
BRN-5a 41 41 0 28 68.3
BRN-6 177 136 41 112 63.3
BRN-7 262 262 0 171 65.3
BRN-8 215 177 38 140 65.1
BRN-9 60 60 0 50 83.3
BRN-10a 62 62 0 33 53.2
BRN-10b 74 74 0 54 73.0
BRN-11 224 208 16 137 61.2
BRN-12 572 453 119 388 67.8
BRN-13 474 398 76 275 58.0
BRN-13a 39 37 2 15 38.5
BRN-14 72 56 16 31 43.1
BRN-15 122 48 74 77 63.1
BRN-16 52 35 17 32 61.5
BRN-17 21 13 8 21 100.0
BRN-18 9 2 7 9 100.0
Total 3122 2666 456 1962 62.8
Estimated number of nests
B. Both species
Nov 2019
Mollymawk Number of % survival
nests with eggs Campbell Grey-headed chicks Mar Nov 2019-
Section Nov 2019 mollymawk mollymawk 20202 Mar 2020
N1 (Areas 5-15) 2658 2274 384 1636 61.6
N2 (Areas 1-4) 381 342 39 264 69.3
N2 ext (Area 16) 52 35 17 29 55.8
N3 (Areas 17-18) 30 15 16 26 86.7
Totals 3122 2666 456 1955 62.6
1 The counts at this scale were made by one analyst only
2 Average of the counts made by both analysts
14You can also read