DELIVERING SUSTAINABLE GROWTH - 2020 FULL YEAR RESULTS March 2021 - Ferrexpo Plc
←
→
Page content transcription
If your browser does not render page correctly, please read the page content below
DELIVERING
SUSTAINABLE
GROWTH
2020 FULL YEAR RESULTS

March 2021
Lucio Genovese, Chair
Jim North, CEO (Acting)
Roman Palyvoda, CFO (Acting)
Brett Salt, CMO
2

INTRODUCTION TO FERREXPO

                    Ferrexpo plc                                                  Climate Change: Positioning                    Sustainable Growth
                                                                                         for the Future
- 3rd largest global exporter of iron                                          - 16% reduction in Scope 1 & 2           - 7% production growth 2020.
  ore pellets; 12.1Mt exports in 2020.                                           carbon footprint in 2020.              - Shareholder returns, US$195M in
- LSE Premium listing, and a                                                   - Ferrexpo’s high grade iron ore           dividends paid in 2020.
  member of the FTSE250 and                                                      pellets enable steelmakers the         - Special interim dividend of 39.6 US
  FTSE4Good Indices.                                                             opportunity to reduce CO2                cents per share declared (2019: 3.3
- High margin business                                                           emissions by 40%2.                       US cents), bringing total dividend
  (underlying EBITDA margin of 50%                                             - Direct Reduction (‘DR’) pellets, the     declared in respect of 2020 to a record
  in 2020).                                                                      pathway to Green Steel; two trial        72.6 US cents (2019: 19.8 US cents).
- Market Capitalisation: US$2.9Bn1.                                              cargoes in 2020.                       - Dividend reflects strong performance
                                                                                                                          of the business, transition to net cash
                                                                                                                          position and continued healthy iron ore
Ferrexpo plc | FY Results Presentation, March 2021
1 As of 12.03.21
                                                                                                                          prices.
2 Source: CRU. 40% reduction is on basis of replacement of sinter fines in a blast furnace with magnetite pellets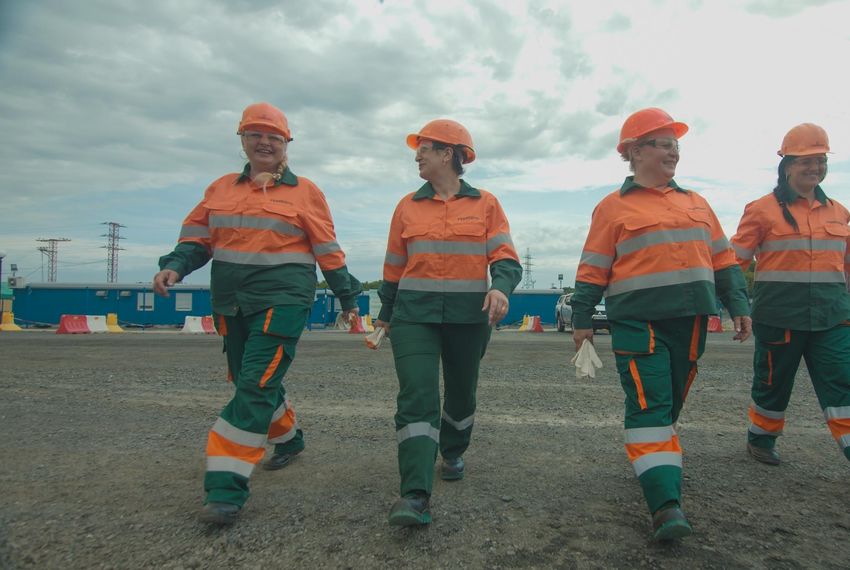
3

STRATEGIC PILLARS
Safety continues to be our first priority

Strong ESG credentials
                                                                                           0.79                         1st
                                                                                           Lost time injury frequency   Fast follower in
- Community support: combined total of US$3.5M                                             rate of 0.79 in 2020, 22%    technology:
  approved for COVID-19 Relief Fund.                                                       below 5 year trailing        implementation of large
- 16% reduction in carbon footprint in single year.                                        average.                     scale autonomous haul
- New Board appointments.                                                                                               trucks, a first for Europe.

Positioned for future growth

                                                                                                                        +12%
- Lowest quartile on cost curve.
- Production of new higher grade pellet types
  commencing in 2020.
                                                                                           BBB
                                                                                           MSCI rating for ESG          JORC-compliant Mineral
Founded on world class assets                                                              performance upgraded by      Resources updated in
- Further +50 years of mine life remaining1.                                               one notch in December        2020, with 12% increase at
                                                                                           2020.                        FPM and FYM combined.
- Central location in Ukraine provides flexibility in
  serving European and Asian markets.

Ferrexpo plc | FY Results Presentation, March 2021
1 +50 years of mine life based on existing Ore Reserves and current rates of production.
4

GOVERNANCE                                             2020                                 2016

Recent Updates:
- New Chair Lucio Genovese.                           Lucio Genovese, Chair of the Board   Vitaliy Lisovenko
                                                                                           Senior Independent Non-executive Director
- New Executive Director Jim North.                    2020                                 2019
- New Independent Non-executive Director Ann-
  Christin Andersen.
- Enhanced procedures and internal controls
  improving the Corporate Governance framework.       Jim North                            Fiona MacAulay
                                                      Executive Director & Acting CEO      Independent Non-executive Director
                                                                                                                                       Ferrexpo Plc Board
- Remuneration Policy Review.                          2019                                 2007                                       of Directors,
                                                                                                                                       including four
                                                                                                                                       Independent
                                                                                                                                       Directors.
Key Priorities for 2021:
                                                                                                                                       (Top left each image
- Appointment of an additional Independent Non-                                                                                        shows the year of
  executive Director (in addition to Ms. Andersen).   Graeme Dacomb                        Kostyantin Zhevago                          appointment for
                                                      Independent Non-executive Director   Non-Independent, Non-executive Director     each Directors)
                                                       2021

                                                      Ann-Christin Andersen
                                                      Independent Non-executive Director
Ferrexpo plc | FY Results Presentation, March 2021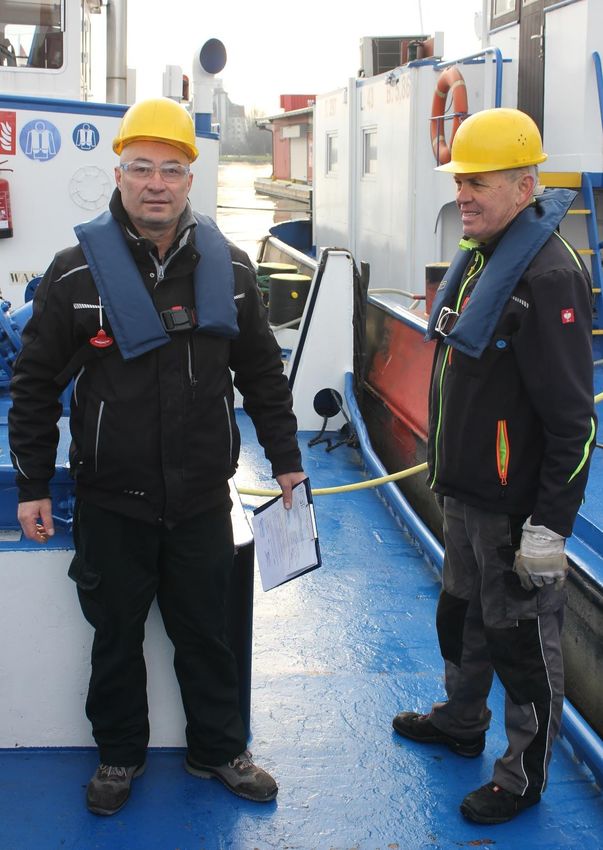
5

SAFETY REVIEW
The Group unfortunately experienced one
fatality at its operations in 2020 (2019: none).

LTIFR of 0.79 in 2020, representing a level
22% below the Group’s 5 year trailing average
(1.01), and ahead of peers.
                                                     DDSG Crewmen
                                                     wearing newly
Group’s barging subsidiary, DDSG, completed          updated season-
                                                     specific Personal
12 months without a lost time injury, down from      Protective
                                                     Equipment,
a LTIFR of 4.32 in 2017.                             December 2020.

Safety benefits associated with new
technologies (autonomous trucks & drills,
drone surveys)

Ferrexpo plc | FY Results Presentation, March 2021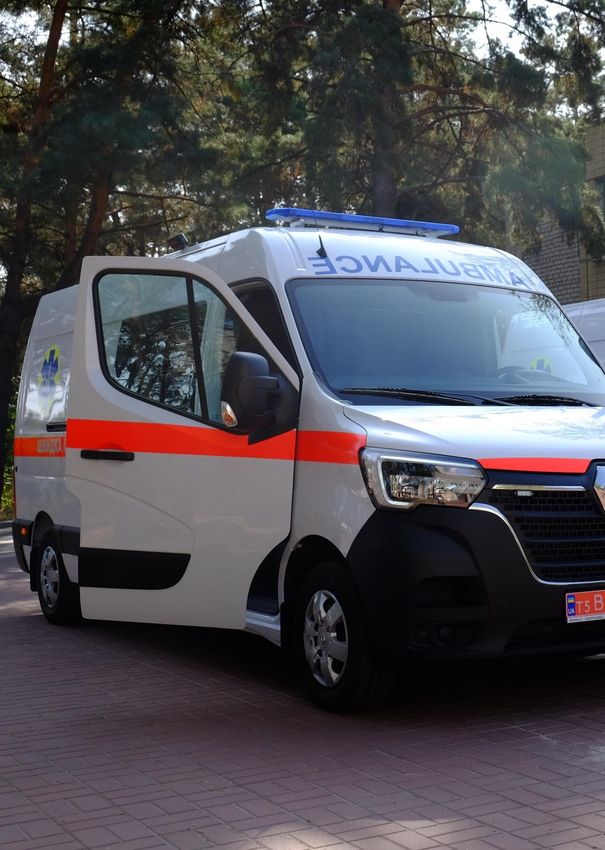
6

COVID-19 RESPONSE
The Group responded with an early
intervention in March 2020 to protect both its
workers and local communities.

Workforce actions:
- Nearly 40% of Group’s operational staff,
  representing over 3,000 people, working remotely.
- COVID-19 testing capacity for over 1,000 tests a    Ambulances
                                                      donated to local
  month.                                              hospitals in 2020 as
- Purchased testing equipment to ensure rapid and     part of Ferrexpo’s
                                                      community support
  accurate results available.                         programmes.

                                                      Ferrexpo has been
                                                      providing direct
Community support:                                    support to local
                                                      communities for ten
- COVID Response Fund established in March 2020       years, establishing
  with approved funding of US$2.5M.                   the Ferrexpo Charity
                                                      Fund in March 2011.
- Continuing to provide support into 2021 with a
  further US$1M of funding approved 1Q 2021.

Ferrexpo plc | FY Results Presentation, March 2021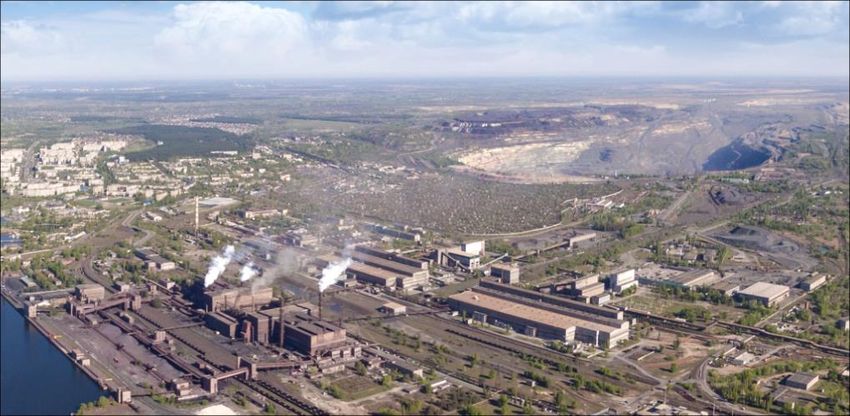
7

SUSTAINABILITY HIGHLIGHTS

-16%                                                                        25%                                           3%
Carbon footprint reduced by 16% in                                          Biofuel (sunflower husk)                      Production of Direct Reduction
a single year, through targeted                                             consumption increased to 25% of               pellets commenced in 2020,
electricity purchasing strategy and                                         pelletiser energy in 2020 (2019: 22%).        representing 3% of total pellet output.
efficiency programmes.                                                      Equivalent to 80kt CO2 saving through         DR pellets represent pathway for
                                                                            reduced natural gas consumption.              steelmakers to produce Green
                                                                                                                          (carbon free) Steel.

                                                                                                                     TM
BBB                                                                         ResponsibleSteel                              10 years
Ferrexpo’s ESG rating with MSCI                                             Joined the ResponsibleSteelTM initiative      10th March 2021 represented the 10
upgraded by one notch to BBB1 in                                            in early 2021, the industry’s first global    year anniversary of the Ferrexpo
December 2020, putting the Company                                          multi-stakeholder standard and                Charity Fund, providing direct support
in the top 40% of companies                                                 certification initiative.                     to the communities in which Ferrexpo
assessed in the steel sector.                                                                                             operates.

Ferrexpo plc | FY Results Presentation, March 2021
1 For more information on MSCI ESG Research and a disclaimer statement, visit: https://www.ferrexpo.com/disclaimer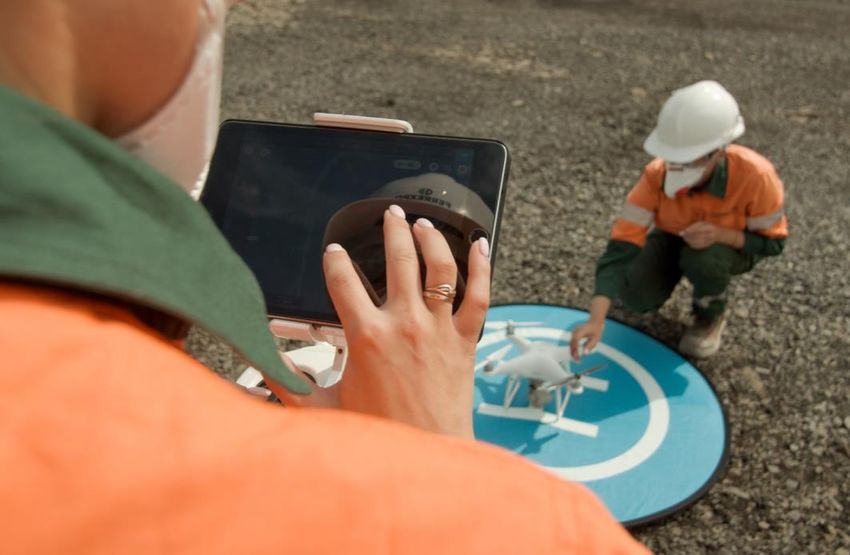
2020 FINANCIAL
RESULTS
Speaker: Roman Palyvoda
Chief Financial Officer (Acting)

Ferrexpo plc | FY Results Presentation, March 2021
9

FY2020 FINANCIAL HIGHLIGHTS

+13%                                                 +46%                                    50%
Revenues increasing by 13% to                        Increase in Underlying EBITDA by        Underlying EBITDA margin
US$1.7Bn in 2020 (2019: US$1.5Bn),                   46% to US$859 million in 2020, result   increases to 50%, representing a 11
combination of increasing production                 of improved market conditions, strong   percentage point increase
(+7%), destocking in 1H 2020 and                     operating performance and lower C1      (2019: 39%).
increasing product quality.                          cash costs.

Net Cash                                             US$206M                                 US$195M
Strong balance sheet with net cash                   Capital investment of US$206M in        Dividends paid in 2020, with
position of US$4 million as of year                  2020, taking total investment since     additional special interim dividend
end, down from a net debt positon of                 IPO to over US$2.75 billion.            declared of 39.6 US cents per share,
US$281 million a year earlier. First                                                         reflecting strong operational and
net cash position declared since IPO                                                         financial performance of the Group,
in 2007.                                                                                     improved balance sheet and market
                                                                                             conditions.

Ferrexpo plc | FY Results Presentation, March 2021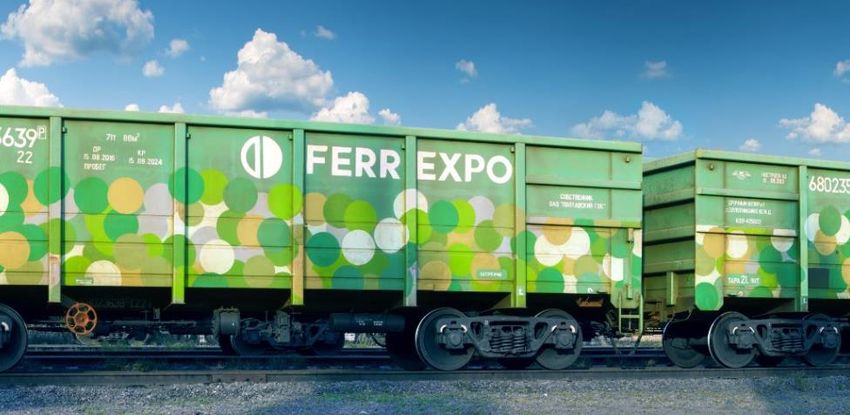
10
DELIVERING GROWTH IN 2020
WELL POSITIONED FOR RECENT MARKET STRENGTH
INVESTMENTS YIELDING
GREATER
HIGH GRADE PELLETS – 99% OF TOTAL GROWTH IN BOTH VOLUME AND QUALITY
PROFITABILITY THAN PREVIOUS CYCLE
12.0
All figures Mt
0.7
1.3
0.1
0.4
1000 180
0.7
0.6
169
10.8
900
160
859
10.4
10.0
801
10.1
10.0
9.8
9.8
800
140
1% 3% 8.0 700
109
120
600
5.1
100
6.0
500
5.7
4.3
5.5
4.8
80
5.2
5.0
4.6
5.1 400
4.7
4.0
4.3
4.3
60
4.1
4.1
4.0
300
3.7
40
200
2.0
20
ERREXPO
100
96%
0 0
0.0
2014
2009
2010
2011
F2012
2013
2015
2016
2017
2018
2019
2020
2015
2007
2008
2009
2010
2011
2012
2013
2014
2016
2017
2018
2019
2020
67% Fe Pellets 65% Fe Pellets
62% Fe Pellets EBITDA (US$M)
65% Fe Pellets 67% Fe Pellets
Iron ore price (62% Fe, US$/t)
62% Fe Pellets
Ferrexpo plc | FY Results Presentation, March 202111
FINANCIAL OVERVIEW
46% GROWTH IN EARNINGS
(US$M, unless stated otherwise) 2020 2019 % - Revenue: +13%
- Increasing as a result of higher volumes, iron ore
Total pellet production from own ore (kt) 11,218 10,519 +7% pricing and increased product quality.
Total sales volumes (kt) 12,062 10,312 +17% - Partially offset by decrease in pellet premiums.
Average CFR 65% fines price ($/t) 122 104 +17%
- Underlying EBITDA: +46%
Average C1 cost ($/t) 41.5 47.8 -13%
- Driven by revenue increase and 13% reduction in
Revenue 1,700 1,507 +13% C1 Cash Operating Costs.
Underlying EBITDA 859 586 +46% - Underlying EBITDA margin: +11pp
Underlying EBITDA margin 50% 39% +11pp - Driven by higher pellet quality and lower C1 costs.
Profit after tax 635 403 +57%
- Capital investment: -17%
Diluted earnings per share (US cents) 107.9 68.4 +58%
- Reduction following conclusion of capital-intensive
Net cash flow from operating activities 687 473 +45% maintenance work on pelletisers.
Capital investment 206 247 -17% - Net Cash Position
Cash 270 131 +106%
- Company enters net cash position following strong
Net cash / (Net debt) 4 (281) (101%) cash generation in 2020 and prudent capital
Net debt to underlying EBITDA (x) 0.005 (0.48) (101%) allocation.
Ferrexpo plc | FY Results Presentation, March 202112
KEY DRIVERS OF UNDERLYING EBITDA IN 2020
MATERIAL INCREASE DESPITE 4% REDUCTION IN DAF/FOB REALISED PRICI NG
All figures US$M
1,000
900
800 +35 +108
700 +71
+171
(251)
600 +39 +100
500
859
400
300 586
200
100
0
FY 2019 Platts 65% Fe Atlantic Pellet C3 freight Sales volumes C1 cost Logistics and Forex FY 2020
EBITDA index Premium Other EBITDA
Ferrexpo plc | FY Results Presentation, March 202113
EFFECTIVE COST CONTROL
13% SAVING IN C1 COSTS IN 2020
C1 Cash Cost Structure C1 Cash Cost: Key Factors 2019-2020 CRU Cost Curve (Iron Ore pellet exports)1
(US$ per tonne) (US$ per tonne) (Pellet exports to China)
50.00
Explosives, 120.0 120.00
0.5 Others ,
Electricity,
48.00
Pellet cost for delivery to China (US$ per tonne)
Royalties, 1.2
2.0 9.5 47.8 (2.2) +0.1
Grinding 46.00
100.0 100.00
bodies,
3.3
(3.9)
44.00
80.0 80.00
(0.3)
Repairs,
3.8
US$41.5/t 42.00
(2019: US$47.8/t) Gas, 1.8
41.5 60.0 60.00
40.00
1st Quartile
Personnel, Fuel, 3.0 38.00
4.2 40.0 40.00
FERREXPO
Spares,
4.4 20.0 20.00
Materials,
7.9
0.0 0.00
0 31 60 91 121
Ferrexpo plc | FY Results Presentation, March 2021
1 Cost Curve as provided by Independent Consultants CRU, March 2021. Estimated costs shown are for iron ore pellets shipped to China.14
RESILIENT CASH FLOWS
DRIVEN BY VOLUME GROWTH AND LOWER COSTS
(All figures US$, unless stated
2020 2019 % - Underlying EBITDA increasing 46% as result of
otherwise)
commodity pricing, volume growth and lower costs.
Underlying EBITDA 859 586 46%
- Lower interest cost due to debt reduction.
Working capital movements (26) (28) (7%)
- Capex down 17%.
Interest paid (21) (34) (37%)
- Completion of pelletiser refurbishment work in 2019.
Income tax paid (57) (84) (33%)
- Completion of Concentrator Expansion Project (US$19M
Other (inc. non-cash operating FX) (70) 35 (300%)
in 2020 vs. US$34M in 2019).
Net cash flow from operating
687 473 45% - c.50% capex in 2020 relates to sustaining and
activities
Capex (206) (247) (17%)
modernisation work.
Dividends paid (195) (155) 26% - Dividends: continued shareholder returns
Other -3 (1) 177% - US$195M paid in 2020, increasing by 26%.
Net cash flow before changes in - Further special interim dividend (39.6 US cents)
283 70 304%
borrowings announced. Total dividends of 72.6 US cents per share
Proceeds from borrowings - 225 - declared in respect of 2020 (2019: 19.8 US cents).
Repayment of borrowings (145) (224) (35%)
Cash Balance End of Period 270 131 106%
Net Cash / (Debt) 4 (281) (101%)
Ferrexpo plc | FY Results Presentation, March 202115
BALANCE SHEET DISCIPLINE
STRONG PLATFORM FOR FUTURE GROWTH
DISCIPLINED CAPITAL ALLOCATION RESULTS IN SIGNIFICANT
DEBT TO EQUITY RATIOS REACHING ALL TIME LOWS
STRENGTHENING OF BALANCE SHEET
All figures US$M 370 Source: Bloomberg
1,305
1,029
1,020
970
904
868
227
734
182
678
639
589
501
424
423
220
412
403
402
80
339 67 70 65
118
59
308
57
281
49
104
270
46
266
258
34
80
30
200
18
2007 2008 2009 2010 2011 2012 2013 2014 2015 2016 2017 2018 2019 2020 -4 2007 2008 2009 2010 2011 2012 2013 2014 2015 2016 2017 2018 2019 2020
Gross Debt Net Debt Debt to Equity (%)
Ferrexpo plc | FY Results Presentation, March 202116
DISCIPLINED CAPITAL ALLOCATION
BALANCE SHIFTING TOWARDS DIVIDENDS AS DEBT REDUCES
BALANCEOF INVESTMENT AND FOCUS ON CAPEX AND DIVIDENDS AS SHAREHOLDER RETURNS REFLECT
SHAREHOLDER RETURNS IN 2020 BALANCE SHEET STRENGTHENS 50%
STRENGTH OF BUSINESS AND MARKET
All figures US$M All figures US$M 45%
120
109
394
40%
309
311
148
93
100
35%
206
239
30%
224
206
80
71
248
196
69
26%
25%
25%
23%
148
20%
58
135
60
19%
103
15%
56
65
10%
11%
40
48
195 5%
155
195
0%
78
58
97
0
0% 20
Capital Investment 2015 2016 2017 2018 2019 2020 YTD 2015 2016 2017 2018 2019 2020
Dividends 2021
Debt Repayment Dividends as % of underlying EBITDA
Capex Dividends Paid Debt Repayment
Iron Ore Price (62% Fe) (US$/t)
Ferrexpo plc | FY Results Presentation, March 2021IRON ORE MARKET REVIEW Speaker: Brett Salt Chief Marketing Officer Ferrexpo plc | FY Results Presentation, March 2021
18

MARKET TRENDS OBSERVED IN 2020
DEMAND FACTORS                                       SUPPLY FACTORS

                                                                                        IRON ORE MARKET   INDICES   2020/2021 (US$/T)
 01                                                  04
                                                                                        250
 Global COVID-19 pandemic,                           Supply disruption of Brazilian
 with regional demand variations                     high grade fines and pellets
 between China / RoW                                 throughout 2020                    200

                                                                                        150
 02                                                  05
 Demand recovery in 2H 2020,                         Limited additional capacity        100
 as governments stimulate                            from alternative suppliers / new
 economies (esp. China)                              entrants
                                                                                         50

 03                                                  06                                   0

 Trend towards greener steel                         Declining quality and
 production and further                              increasing complexity in supply
 environmental controls                              from Pilbara region of Australia              Platts 65% Fe Index     Atlantic PP
                                                                                                   Chinese Spot PP         C3 Freight Rate
Ferrexpo plc | FY Results Presentation, March 2021
19
LOOKING AHEAD
POSITIVE TRENDS IN STEEL PRICING SEEN IN LATE 2020 &
EARLY 2021
1 Green Steel / Carbon Free Steel (medium term). 1,300
EU HRC US HRC
HRC Price (US$/t)
Japan HRC Shanghai HRC
1,000
Increasing focus on environmental controls, positive
2 impact on pellet demand (short term).
700
3 I/O fines market to remain undersupplied in 2021.
400
May-19 Oct-19 Mar-20 Aug-20 Jan-21
CONTINUING RECOVERIES IN 2021 FOLLOWING RAPID CHINA
4 Continued disruption of Brazilian pellet supply. STIMULUS IN MID-2020
70 ISM China Germany Japan
Lack of additional supply of iron ore fines through
Manufacturing PMI
5 either expansion plans or new projects.
60
50
Greater lack of growth in pellet supply, despite 40
6 reliance of Green Steel on pellets. 30
May-19 Oct-19 Mar-20 Aug-20 Jan-21
Ferrexpo plc | FY Results Presentation, March 2021ORGANIC GROWTH OPPORTUNITIES Speaker: Jim North Chief Executive Officer (Acting) Ferrexpo plc | FY Results Presentation, March 2021
21

NEAR TERM GROWTH
Concentrator expansion project completed in
2020:
- Additional 680tph of processing capacity.
- Provides platform to fully utilise pelletiser
  nameplate capacity in 2021.

Key operational projects for 2021:                                           Investing in technology to facilitate growth
                                                                             and sustainability
- Pelletiser upgrades (1H 2021), adding 0.5-1.0Mtpa
  of pelletiser capacity from 2H 2021.                                       a. Autonomous trucks, a first for Europe1.
- Conc. stockyard (added operational flexibility,                            b. Semi-autonomous drill rigs, deployed since 2017.
  decoupling concentrator / pelletiser production).                          c. Drone surveying, deployed 2018.
                                                                             d. Biofuel consumption increased to 25% of total
                                                                                energy in pelletiser in 2020 (2019: 22%).
                                                                             e. Solar power pilot plant under construction.
                                                                             f. Decarbonisation of mining fleet.

Ferrexpo plc | FY Results Presentation, March 2021
1 First large scale autonomous mining trucks deployed in a mine in Europe.
22
FUTURE GROWTH
PRIORITIES
Development of Ferrexpo’s Volume growth through modular expansions
of existing production facilities.
world class resource base to
deliver both volume growth and
quality enhancements for a Focus on quality. Direct Reduction pellets
represent the long term future for the iron ore
changing world. market.
Green technology – solar power, increased
biofuel usage, & decarbonising mining fleet.
Ongoing development of Belanovo mine,
representing key component of medium term
growth plans.
Ferrexpo plc | FY Results Presentation, March 202123 CONCLUSIONS 1 Continued focus on culture of safety, with LTIFR below 5 year average and peers. 2 Resilient financial performance in 2020, underpinned by robust operational growth. 3 Delivering balance of investment, shareholder returns and debt reduction. 4 Increase output of DR pellets in 2021, pathway to Green Steel. 5 Carbon footprint cut by 16% in 2020, expecting similar trajectory in 2021. 6 Implementing best practice corporate governance. Ferrexpo plc | FY Results Presentation, March 2021
APPENDICES

Ferrexpo plc | FY Results Presentation, March 2021
25

DISCLAIMER
This document is being supplied to you solely for your information and does not constitute or form part of any offer or invitation or inducement to sell or issue, or any
solicitation of any offer to purchase or subscribe for, any shares in Ferrexpo Plc (the “Company”, and together with its subsidiaries the “Group”) or any other
securities, nor shall any part of it nor the fact of its distribution form part of or be relied on in connection with any contract or investment decision relating there to,
nor does it constitute a recommendation regarding the securities of the Company or the Group.
The release, presentation, publication or distribution of this document, in whole or in part, in certain jurisdictions may be restricted by law or regulation and persons
into whose possession this document comes should inform themselves about, and observe, any such restrictions.
Neither the Company nor its affiliates nor advisers are under an obligation to correct, update or keep current the information contained in this document or to
publicly announce the result of any revision to the statements made herein except where they would be required to do so under applicable law or regulation.
No reliance may be placed for any purpose whatsoever on the information contained in this document. No representation or warranty, expressed or implied, is
given by or on behalf of the Company or any of the Company’s directors, officers, employees or affiliates or any other person as to the accuracy or completeness of
the information or opinions contained in this document and no liability whatsoever is accepted by the Company or any of the Company’s members, directors,
officers, employees or affiliates nor any other person for any loss howsoever arising, directly or indirectly, from any use of such information or opinions.
Certain statements, beliefs and opinions in this document are forward-looking. The statements typically contain words such as “aim”, “anticipate”, “assume”,
“believe”, “continue”, “estimate”, “expect”, “goal”, “intend”, “may”, “plan”, “projected”, “seek”, “target”, “will” and words of similar substance. By their nature, forward-
looking statements involve a number of risks, uncertainties and assumptions that could mean actual results or events differ materially from those expressed or
implied by the forward-looking statements. These risk, uncertainties and assumptions could materially adversely affect the Group and the outcome and financial
effects of the plans and events described herein. Statements contained in this document regarding past trends or activities should not be taken as a representation
or warranty (express or implied) that such trends or activities will continue in the future. No statement in this document is intended to be a profit forecast. You should
not place reliance on forward-looking statements, which speak only as of the date of this document.
Alternative Performance Measures
Throughout this document a range of financial and non-financial measures are used to assess the Group’s performance, including a number of financial measures
that are not defined or specified under IFRS (International Financial Reporting Standards), which are termed ‘Alternative Performance Measures’ (APMs).
Management uses these measures to monitor the Group’s financial performance alongside IFRS measures to improve the comparability of information between
reporting periods. These APMs should be considered in addition to, and not as a substitute for, or as superior to, measures of financial performance, financial
position or cash flows reported in accordance with IFRS. APMs are not uniformly defined by all companies, including those in the Group’s industry. Accordingly, it
may not be comparable with similarly titled measures and disclosures by other companies.

Ferrexpo plc | FY Results Presentation, March 2021
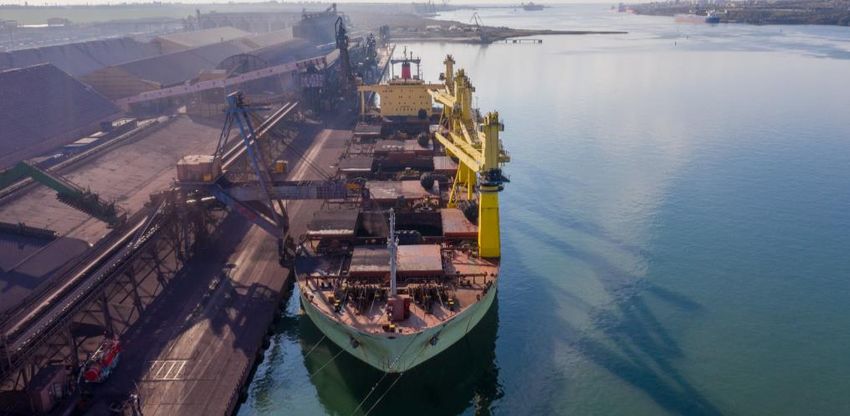
26

ESTABLISHED PRODUCTION & LOGISTICS

Ferrexpo plc | FY Results Presentation, March 2021
27

IRON ORE PELLETS
PREMIUM MARKET WITHIN IRON ORE SPACE

                            ROLE OF IRON ORE PELLETS                                                       GLOBAL     IRON ORE PRODUCTION IN        20201
- Iron ore pellets represented less than 15% of global iron                                                                                  Pellets
  ore1 production in 2020, with pellets representing premium                                                                                  14%
                                                                                           Pellet feed
  product used in steelmaking to produce high-end steel.                                       8%
- Degree of usage depends on the market and steelmaker –
  iron ore pellets typically represent 29% of blast furnace                                            Lump
                                                                                                        17%
  material in Europe, and 13% in China1.
                                                                                                                                               Sinter Fines
- Ferrexpo’s iron ore pellets are typically high grade                                                                                             61%
  (65% Fe) and improve the productivity of blast furnaces,
  as well as reduce carbon footprint of steelmaking by 40%
  for every tonne of sinter fines replaced1.                                                               PELLET PREMIUMS – PROVIDING          STABILITY

- Atlantic pellet premium averaged US$29 per tonne in                            `                                                                        All figures US$/t
  20202, paid in addition to average iron ore fines price of                                      175

                                                                                Iron ore and pellet
  US$109 per tonne (62% Fe price).
                                                                                                  125

                                                                                   price (US$/t)
- Ferrexpo’s high grade pellets are priced using Platts 65%
  Fe Index, providing additional premium for ferrum content.                                          75
                                                                                                      25
                                                                                                              2017           2018       2019            2020
                                                                                                              Platts 62% Fines Price   Atlantic Pellet Premium
Ferrexpo plc | FY Results Presentation, March 2021
1 Source: CRU
2 Platts Atlantic Pellet Premium. Chinese spot premiums US$23 in same period.
28
TYPES OF IRON ORE PELLET
DIFFERENT PELLETS FOR DIFFERENT REGIONS
- Two main types of pellet exist – blast furnace (“BF”) and GLOBAL PELLET EXPORT MARKET – 129MT IN 2020
direct reduction (“DR”) pellets. (+2MT VS. 2019)1
- BF pellets have iron ore grades of either 62% Fe or 65% DR Pellets,
BF Pellets,
Fe, and are typically used by steel mills in Europe and 27%
73%
Asia.
- BF pellets represent majority of the global iron ore pellet
export market (73%)1.
- DR pellets are higher grade (67% Fe) and are typically
used by steel mills in the Middle East and North America.
MAJOR SUPPLIERS INTO EACH MARKET
- DR pellets are transformed into steel using either
electricity (electric arc furnace) or natural gas (MIDREX Selected BF Pellet Selected DR Pellet
process), both of which are considered more Exporters Exporters
environmentally friendly than the coal used to converting • Vale • Vale
blast furnace pellets to steel. • Ferrexpo • Bahrain Steel
• LKAB • LKAB
- DR pellets represent the pathway to Green Steel. • India • IOC
• Metalloinvest
• IOC
Ferrexpo plc | FY Results Presentation, March 2021
1 Source: Management Estimate29
CARBON: POSITIONING FOR THE FUTURE
DELIVERING 16% REDUCTION IN CARBON FOOTPRINT 2020
- Scope 1 emissions: INVESTING IN ZERO-CARBON TECHNOLOGIES
- 8% reduction in 2020 (per tonne basis), achieved
through operational improvements and productivity
gains.
- Ferrexpo’s Scope 1 emissions (direct emissions,
primarily through diesel & natural gas consumption)
is in line with peers.
Electrification Green hydrogen in DR pellets for
- Scope 2 emissions: mining fleet pelletising green steel
- 21% reduction in 2020 (per tonne basis).
- Major factor for Ferrexpo’s emissions is reliance on
Ukrainian national grid (Scope 2 emissions), with coal
fired power stations (vs. peers usage of
hydroelectric).
- Purchasing of greener forms of electricity
commenced in June, with up to 40% of monthly
electricity purchases coming from either hydroelectric Buying lower Heat recuperation
or nuclear power sources. 5MW solar farm
carbon electricity (pelletiser)
- 2021 outlook:
- Volume growth and a full year of greener electricity
purchases is expected to deliver similar gains in 2021
as seen in 2020.
Ferrexpo plc | FY Results Presentation, March 2021You can also read