Bilfinger SE Company Presentation

 
CONTINUE READING
Bilfinger SE Company Presentation
Bilfinger SE

Bilfinger SE Company Presentation
November 2019
Bilfinger SE Company Presentation
Overview
Bilfinger SE Company Presentation
Bilfinger at a glance

          Leading international industrial services provider

          Efficiency enhancement of assets, ensuring a high level of availability and
           reducing maintenance costs
                                                                                          €4.15bn revenue
          Clear 2-4-6 strategy with two service lines, four regions and six focus
           industries
                                                                                         thereof
                                                                                         recurring business ~55%
          Combination of excellence in products and manufacturing (T) and covering
           the full life-cycle (E&M)

          Large share of business with long-term frame contracts and high retention
                                                                                           Orders Received   +10%
           rates

          Well-established customer base with focus on process industries                     €65m EBITA adjusted
          Highly recognized safety and quality performance

          Digital pioneer for the process industry
                                                                                         Approx.   36,000 employees
                                                                                                               based on FY 2018
Bilfinger SE | Company Presentation | November 2019                                                                       page 3
Bilfinger SE Company Presentation
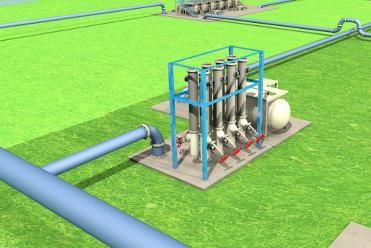
Strategy affirmed, enhanced setup
    2 Service Lines, 4 Regions, 6 Industries

   Our ambition                                                           We engineer and deliver
                                                                         process plant performance

                                                      2 Service Lines                  4 Regions                        6 Industries

                                        • Technologies                     •   Continental Europe               • Chemicals &    • Pharma &
   Where to play                        • Engineering & Maintenance        •   Northwest Europe                   Petrochem        Biopharma
                                                                           •   North America                    • Energy &       • Metallurgy
                                                                                                                  Utilities      • Cement
                                                                           •   Middle East
                                                                                                                • Oil & Gas

                                                      People &          Customer &                  Organization &
                                                                                                                                Financials
                                                       Culture          Innovation                    Structures
   How to win

Bilfinger SE | Company Presentation | November 2019                                                                                             page 4
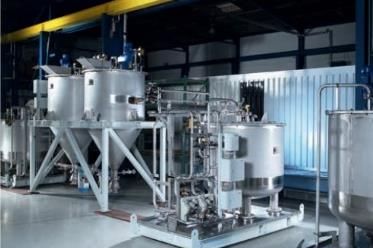
Bilfinger SE Company Presentation
2 Service Lines
    Enhanced setup for build up and build out phase

    Technologies                                                Engineering & Maintenance
     FY 2018: Revenues €503m, EBITA adj. €-26m                  FY 2018: Revenues €3,477m, EBITA adj. €134m
     Market                                                     Market
     High growth potential for technological products esp. in   Increasing demand in Engineering Maintenance
     Energy & Emissions, Biopharma (Life Science) and           services
     Automation / Digitalization – supported by mega trends

     Characteristics                                            Characteristics
     • Proven technological competence                          • Higher added value to maintenance business
     • Product and manufacturing excellence                     • Covering full life-cycle
     • Centralized capacities                                   • Improve asset and plant performance
     • Serving the global market                                • Superior customer perception
                                                                • Potential for cost savings in SG&A

                 Focusing on Technologies drives                     Combining E and M leverages our business
                 stronger growth and higher margins                  to higher-end services and higher margin

Bilfinger SE | Company Presentation | November 2019                                                             page 5
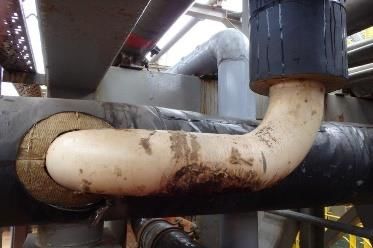
Bilfinger SE Company Presentation
2 Service Lines
    Technologies: ambition to grow higher-margin business

    Tech-                                             Scrubber                         Pharma &                               Nuclear
    nology                                                                             biopharma                              Services
                                                                                       expertise

    Descrip-            • High demand driven by legis-           • Ageing society and global rise of   • Worldwide build programs
    tion                  lation on emissions and CO2              middle class drives new products      averaging 25 in construction
                        • Proven expertise in flue gas             and sales growth                    • 448 reactors operable worldwide
                          desulphurisation                       • Global market, customers and          – 50% in the US and Europe
                        • Attractive, compact design with          procurement                         • High standards of safety, quality
                          short payback                          • Compact production facilities         and service essential
    Goal                • Increase serial production             • Biopharma skids and bioreactors     • Present on 3 new builds in
                          capacity internally and with           • Global reach with deliveries into     Europe
                          partners                                 China and Russia                    • Chosen as strategic supplier for
                        • Scrubber for 70 ships in order         • No. 1 supplier in Europe              NSSS at Hinkley Point > €250m
                          book with further options                (~20% revenue CAGR in the last      • Specialist in engineering, piping
                                                                   4 years)                              systems and handling

Bilfinger SE | Company Presentation | November 2019                                                                                          page 6
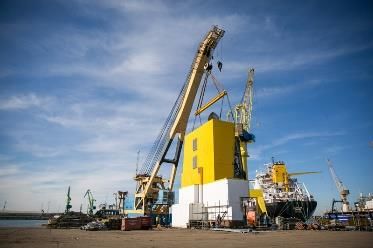
Bilfinger SE Company Presentation
2 Service Lines
    Engineering & Maintenance: combined and full life cycle services driving value

    Tech-                                             Combined                       Bilfinger                            Corrosion
    nology                                            strength                       Turnaround                           under
                                                                                     Concept                              insulation

    Descrip-            • €36m deodorization plant for        • High risk events for customers –     • Major root cause of process
    tion                  Fluxys                                safety, duration and cost              safety issues in recent years
                        • Critical system in transmission and • Large investment programs with       • Investment programs of ~€2bn in
                          leak detection for gas to/from GER    up to 10 year look-aheads              US and Europe p.a.
                        • Gas processing & transmission       • Complimentary to maintenance         • Inspection followed by
                          investment increasing                 services and customer entry point      remediation and replacement
    Goal                • Bilfinger expertise from four          • Consistent and modular            • Bilfinger multi-services enable
                          businesses combined                      approach to reduce risks            integrated teams
                        • Specialists in gas systems,            • Training and development of new   • Rope access technicians reduce
                          automation fabrication and               mobile resources                    customer costs
                          installation involved                  • Established player in market      • Innovative solutions for the
                                                                                                       avoidance of repeat failures

Bilfinger SE | Company Presentation | November 2019                                                                                      page 7
Bilfinger SE Company Presentation
Bilfinger Turnaround Concept (BTC)
    No. 1 provider in Europe for turnarounds in the process industry
    Profitability driver for E&M also in 2020 & 2021

      BTC:
      •     Ability to ramp up/down large number of
                                                            250                                        >€200m
            qualified personnel
      •     Minimize outage
      •     Asset long-term integrity assurance                                        ~€200m
                                                            200
      •     Decades of experience
      •     Market leader: ~80 turnarounds/year                         ~€150m
      •     International network, local execution          150
      •     Cost-efficient & transparent:
            one-stop service provider
                                                            100
      •     Digital tools, modular handbook,
            methodology training
                                                             50                                 > 80
                                                                  >60            >70
       Rollout of BTC across all                                 TAs            TAs            TAs

        European E&M markets
                                                              0
       High number of repeat customers                            2018           2019e           2020e
       Access to new customers

Bilfinger SE | Company Presentation | November 2019                                                             page 8
Craft labor supply/demand inversion driving Bilfinger’s market dynamics

                                                                   70000
                                                                                  Unfilled
                                                                   60000          apprentice                                                                                ▪ Supply side
                                                                   50000          positions
                                                                   40000
                                                                                  in Germany*                                                                                 shortage             Quality,
                                                                   30000                                                                                                      expectations          competence &
                                                                   20000

                                                                   10000
                                                                                                                                                                            ▪ “War for talents”     certification
                                                                        0
                                                                            2009 2010 2011 2012 2013 2014 2015 2016 2017 2018
                                                                                                                                                                              determines            imperatives
                                                                                                                                                                              competitive edge
                                                                                                                                                                            ▪ Demographics         Supports firming
                                                                                                                                                                                                    prices

                                                        USA Today

    * Bundesinstitut für Berufsbildung (ed.): Datenreport zum Berufsbildungsbericht 2019. Informationen und Analysen zur Entwicklung der beruflichen Bildung. Bonn 2019. p. 15.

Bilfinger SE | Company Presentation | November 2019                                                                                                                                                                    page 9
Digital Next: Strategic position
    Bilfinger is well positioned to be the frontrunner in the IoT of process industries

     Process Industry                                 Bilfinger                                     IT Industry

        Digitalization hurdles                                    Building digital bridges            Applicability deficits

      • Requirement to                                  • Deep knowledge of customer needs and      • No access to plant
        improve performance                               processes                                   operators
      • Lack of digitalization                          • Comprehensive digitalization know-how     • Challenge to apply IoT
        knowledge                                       • Independent service provider                knowledge to process
                                                        • Nr.1 in conventional services in Europe     industries

                                                           WE MAKE DIGITALIZATION WORK!

Bilfinger SE | Company Presentation | November 2019                                                                        page 10
Compliance Management System
    A competitive advantage

          Certified by compliance monitor in December of 2018
          Deferred Prosecution Agreement (DPA) concluded

                                                                                         Prevent
          Compliance system is industry leading                                              Prävention

          Compliance-related activities are ongoing,                                 Compliance
                                                                                     Reaktion
                                                                                    is an integral part of
          system in a continuous process of innovation
                                                                                   our business strategy
                                                                                   and integrity culture.
                                                                         Respond                             Detect
                       Compliance: an integral part of Bilfinger’s DNA

Bilfinger SE | Company Presentation | November 2019                                                                   page 11
Improving our financial performance
We will address all P&L line-items

     GROSS MARGIN

       • Growth opportunities in high-profitability areas
       • LOA1) process and Project management                  Impact on
                                                             gross margin:
                                                            improvement of
                                                                ~200bps      AMBITION 2)
     ADDRESSING BOTH LINE ITEMS
                                                                             EBITA margin
       • Process and IT harmonization
       • Procurement
                                                                              increase of
                                                                                ~500bps
                                                               Impact on
     SG&A RATIO                                               SG&A ratio:
                                                            Improvement of
      • Lean headquarters                                       ~300bps
      • Lean structures in the field

    1) Limits   of authority   2) Mid-cycle   targets
Bilfinger SE | Company Presentation | November 2019                                         page 13
SG&A ratio shows positive trend

     Adjusted SG&A expenses [€ m]                                                                   Highlights
                                                                                                    • SG&A ratio continues to
                                                92            94                                      move towards target level
                                   87                  90            89     91
        86                                                                        84
                     76
                                                                                                    • Streamlining of processes
                                                                                         SG&A       • Reduction of complexity in
                                                                                         expenses     structures, organization and
                                                                                         [€ m]
                                                                                                      governance
                                                                                                    • Adjustment of admin
                                                                                                      headcount
    Q3 2017 Q4 2017 Q1 2018 Q2 2018 Q3 2018 Q4 2018 Q1 2019 Q2 2019 Q3 2019

                                                                                         SG&A
     8.6%          7.0%          9.4%         8.7%    8.6%   8.4%   8.8%   7.9%   7.6%   ratio1)

    1) As   percentage of revenue
Bilfinger SE | Company Presentation | November 2019                                                                                  page 14
Preparing the ground for the “build-out phase”:
    Leaner processes, less regulation – focus on value generation

                                                      Significant margin improvement expected in 2020

                                                      ▪ Gross margin improvement remains major focus:
                                                         Execution improvement
                                                         Disciplined hurdle rates for future contracts

                                                      ▪ Additional net SG&A savings >€30 million in 2020,
                                                        by 2021 reduction of SG&A run-rate to
Additional working capital improvement initiatives
    Targeting ~85% of trade receivables and WIP in a category-specific approach

   Reporting and Management information                                  Awareness, Education and Coaching
   ▪ Develop and implement reporting improvements:                       ▪ Roll-out E-learning on working capital management
     aging WIP, DSO and DPO payment conditions,                          ▪ Instructions and training sessions on levers for working capital
     root cause analysis on issues, issue reporting                        management for target groups
   ▪ Further harmonisation of internal reports                           ▪ Develop and share toolbox for DSO and DPO (portal, sharepoint)
                                                                         ▪ Share main issues and challenges (hot spots). Help each other to
                                                                           solve issues via workshops, company visits, local support

   Incentives                                                            Best practices
   ▪ Standard bonus and incentive arrangements focused                   ▪ Identify and share best practices via workshops, portal,
     on structural working capital improvements                            quarterly update presentations, benchmark companies
   ▪ Identify and share best practices for target setting (as of 2020)   ▪ Contract management best practices for DSO and DPO
   ▪ Special focus on smoothing intra-year working capital               ▪ Root cause analysis to identify common issues and solutions
     development                                                           using IT tools
                                                                         ▪ Identify (standard) automation and digitalization solutions for
                                                                           O2C processes
Bilfinger SE | Company Presentation | November 2019                                                                                          page 16
Guidance 2019, Targets 2020 and Wrap-up
Markets: E&M Europe

                        Industries                    %*                                                                               Trend

                                                            • Overall positive outlook in E&M Oil & Gas driven by gas infrastructure
                                                              buildout and input terminals / LNG projects
                        Oil & Gas                     25%
                                                            • Strong demand for offshore maintenance, turnaround projects and
                                                              decommissioning

                                                            • Stable market development with turnaround opportunities for the
                        Chemicals & Petrochem         45%     upcoming years
                                                            • CO2/emissions impacting future investment decisions

                                                            • Hydrogen beginning to play more of a role in European energy
                                                              transition
                        Energy & Utilities            10%   • Maturing offshore wind parks leading to opportunities for inspection
                                                              and maintenance
                                                            • Nuclear remains in focus in France, UK, and Finland
    *%   of segment revenues FY 2018
Bilfinger SE | Company Presentation | November 2019                                                                                            page 18
Markets: E&M International

                        Industries                    %*                                                                          Trend

                                                            • Aging installations based in ME fuel demand for brownfield CAPEX
                        Oil & Gas                     15%     projects for rehabilitation, upgrades & repair
                                                            • Mid-stream gas investments in NA continue but the pace has slowed

                                                            • Focus on OPEX optimization to support refining margins
                        Chemicals & Petrochem         30%   • Significant investments in Petro-Chemical announced for Texas /
                                                              Louisiana

                                                            • Continued concepts being developed for alternative energy power-
                                                              generation in ME
                        Energy & Utilities            10%
                                                            • In NA, energy investment trends focused on energy storage, wind,
                                                              solar and CO2 reduction

    *%   of segment revenues FY 2018
Bilfinger SE | Company Presentation | November 2019                                                                                       page 19
Markets: Technologies

                        Industries                    %*                                                                          Trend

                                                            • Modification and modernization requirements of European gas
                        Oil & Gas                     10%     distribution systems
                                                            • Debottlenecking opportunities in refining

                                                            • Energy transition focus in all our regions, esp. Europe and USA
                                                            • Nuclear demand for new builds and maintenance increasing, esp. in
                        Energy & Utilities            40%
                                                              France and UK
                                                            • Decommissioning a developing opportunity in Germany

                                                            • Classic pharma continues to grow
                        Pharma & Biopharma            40%   • Many small to medium-size biopharma projects nearing FID (final
                                                              investment decision)

    *%   of segment revenues FY 2018
Bilfinger SE | Company Presentation | November 2019                                                                                       page 20
Outlook 2019 reaffirmed, significant margin improvement in 2020

                                            Actual            Expected                            Indications
      in € million
                                            FY 2018           FY 2019                             FY 2020 (organic)

      Revenue                                         4,153   Mid single-digit organic growth     Stable with focus on higher margins

                                                              Significant increase to more than
      EBITA adjusted                                    65                                        ~4% margin
                                                              €100m

      Free Cash Flow
                                                         -4   Positive1)                          Positive
      reported

           Continued divestment of non-core and low-margin business
           Seeking accretive acquisition opportunities
           Will support delivery of the generally confirmed target of a 5% adjusted EBITA margin
           This is only expected to be achieved towards the end of 2020 on a going forward basis
    1) Notwithstanding   IFRS16 effect: break-even
Bilfinger SE | Company Presentation | November 2019                                                                                     page 21
Bilfinger 2020
    Build up phase on track / Build out phase starts in 2020                                                Capital Markets Day
                                                                                                             February 13, 2020

   Value
                               Stabilization
                                                                       Build up                                Build out

             • Strategy defined                               •   Top line growth resumed              • Process and System
             • Organization announced                         •   First successes in new growth areas     harmonization fully rolled out
             • Execution master plan                          •                                
                                                                   New organization in full swing        • Performance culture
             • Top Management Team                            •   Consistent project management           established
             • Dividend proposed                                  process established                  • Productivity wheel in full swing
             • B TOP rolled out                               •   Net Profit break-even                 • Complexity significantly
             • LOA Process rolled out                         •                                     
                                                                   Adj. FCF positive latest in FY 2018     reduced
             • SAP roll-ins commenced                         •   Share buyback completed  
             • CRM implementation started                     •   Successfully refinanced                  Financial ambition reached
             • Cash focus in
               incentive system increased              
             • Operating performance improved              
                                                                                                                                              Time
Bilfinger SE | Company Presentation | November 2019                                                                                             page 22
The Bilfinger Investment Case:
    Turnaround case based on favorable business model

         Structural demand for industrial                 Favorable business                                             Financial soundness
         services                                         characteristics
                                                                                                                         • BB / stable outlook
                                                          • ~55% of output in recurring                                  • 35% equity ratio (as of Dec 31,
         • Increasing # of Industrial plants
         • Increasing total service market and              business                                                       2018)
           contracted out market                          • No material dependency from                                  • Financial participation in Apleona
         • Rising age and complexity                        single clients or regions                                      with significant upside potential
         • Customers demand for greater efficiency        • Growing regional diversification                             • Financial policy: Ambition (mid-term
         • Service bundling                                                                                                perspective) Investment Grade
         • Stricter environmental standards
                                                                                                                         Shareholder-friendly
          Good starting position:                         Asset light business                                           distribution1)
          • Consistently No. 1 supplier of industrial     • Capex: 1.5 - 2.0% of output                                  • From FY 2016 onwards:
            services for the process industry in Europe     volume                                                         €1.00 dividend floor
          • Clearly defined strategy                      • Balanced net working capital                                 • Sustainable dividend stream going
          • Organization derived from strategy              profile                                                        forward:
          • Detailed implementation plan                                                                                   40 to 60% of adjusted net profit
          • Growth and profitability targets                                                                             • Share buyback program of €150m
          • Growth will be supported by additional                                                                         completed in Oct 2018
            business development and digitalization
            activities                                            1)   Based on current expectations and execution of presented strategy as well as on economic outlook at the time.
Bilfinger SE | Company Presentation | November 2019                                                                                                                           page 23
Financials Q3 2019
Q3 2019: Bilfinger making steady progress, streamlining management structure

              Market: underlying markets stable
              Orders received: timing issues

              Revenue: continued growth

              Adjusted EBITA: significant year-on-year improvement
              Technologies improved sequentially, but still negative

              Reported net profit: positive in quarter and year-to-date

              Free cash flow reported: above prior year, further significant
              improvement expected for Q4

              Productivity: further measures being implemented, >€30m additional
              2020 cost savings
              Outlook: 2019 reaffirmed, significant EBITA improvement in 2020
Bilfinger SE | Company Presentation | November 2019                                page 25
Stable orders received in E&M, Technologies with significant decrease due to
    project timing and current strong focus on execution

                                                                        Development of orders received

                                                                         -10%/-7%                             • Orders received
                                    1,105               1,114                                 1,133             Decrease (-10% / org.: -7%) due
                                                                           971                         997
                                    670                  765                                   798              to project timing in UK and US
          Orders                                                            748                        667
                                   (61%)                (69%)                                 (70%)             and careful selection of new
        received                                                           (77%)                      (67%)
                                                                                                                projects in Technologies
      (€ million)                    435                 349                                   335     330
                                                                           224                                • Book-to-bill: 0.9
                                    Q3/18               Q4/18              Q1/19              Q2/19   Q3/19
                                                                                                              • Order backlog
                                      < €5 million    Δ compared with               organic
                                                                           x/x                                  -7% below prior-year quarter
                                      > €5 million       prior year
                                                                                                                (org.: -5%)

         Book-to-
         bill ratio                  1.1                 1.0                1.0                1.0     0.9

          Order
        backlog                    2,828               2,818              2,754               2,712   2,620
      (€ million)
Bilfinger SE | Company Presentation | November 2019                                                                                            page 26
Revenue growth remains positive; significant improvement in adjusted EBITA

                                                                 Development of revenue and profitability

                                                                                                            • Revenue
                                                                        +5%/+7%                               +5% increase (org.: +7%) due to
                                                        1,115                               1,147   1,101     good market demand
                                     1,052                               1,008
        Revenue                                                                                             • Adjusted EBITA
       (€ million)                                       3.3%            -0.4%                      3.1%
                                      2.1%                                                                    Increased to €34 million
                                                                                            1.5%
                                                                                                              (prior year: €22 million),
                                                                                                              significant margin improvement
                                      Q3/18              Q4/18           Q1/19              Q2/19   Q3/19     (3.1% against 2.1%)

                                   EBITA adj.
                                                      Δ compared with
                                                                         x/x      organic                   • Special items
                                                         prior year
                                   margin (%)                                                                 -€9 million,
                                                                                                              thereof -€1 million restructuring
      EBITA adj.
                                      22                  37               -4                 17      34      and -€8 million from IT
      (€ million)
                                                                                                              investments
           EBITA
       (€ million)                    11                  -6               -3                 3       25

Bilfinger SE | Company Presentation | November 2019                                                                                           page 27
Gross margin improvement to 10.2%
    Adjusted SG&A ratio of 7.6% dipping below run-rate of 8.2%

                       Adjusted gross profit (€ million)                      Adjusted selling and administrative expenses (€ million)

                                                        112
                       100                    97      (10.2%)
                     (9.5%)                 (8.5%)       0
                                                                                            5         11           5
                        0                      0
                                                                                         -95          -102        -89
                                                        112                            (-9.1%)      (-8.9%)     (-8.1%)
                       100                    97
                                                      (10.2%)
                     (9.5%)                 (8.5%)
                                                                                         -90                      -84
                                                                                                      -91       (-7.6%)
                                                                                       (-8.6%)      (-7.9%)
                     Q3/18                  Q2/19     Q3/19                            Q3/18        Q2/19        Q3/19

                                                                Adjustments      Reported

Bilfinger SE | Company Presentation | November 2019                                                                                      page 28
Segment E&M Europe: continued sound performance

                                                                 Development of revenue and profitability
                                                                                                            • Orders received
                                                                        -1%/+1%                               -2% below prior-year quarter
                                                                                            710               (org.: +0%), major framework
                                       695               705                                        688
                                                                          635                                 contracts to be prolonged in Q4 /
        Revenue                                                                                               currently not reflected in orders
                                                         5.3%
       (€ million)                                                                          4.0%
                                                                                                    4.7%      received
                                      4.7%                               1.6%                               • Book-to-bill: 0.9

                                                                                                            • Revenue
                                      Q3/18              Q4/18           Q1/19              Q2/19   Q3/19
                                                                                                              -1% (org.: +1%), stable
                                                      Δ compared with             organic                     development on already good level
                                   EBITA adj.                            x/x
                                   margin (%)            prior year
                                                                                                            • Adjusted EBITA
    Book-to-bill                                                                                              Adjusted EBITA and margin both
          ratio                       0.9                1.1              1.0                1.1      0.9     on good prior-year level

      EBITA adj.
      (€ million)                     33                  37              10                 28       32

Bilfinger SE | Company Presentation | November 2019                                                                                               page 29
Segment E&M International: strong revenue growth,
    considerable margin improvement

                                                                 Development of revenue and profitability
                                                                                                                         • Orders received
                                                                        +25%/+20%                                          +2% (org.: -3%) slightly above prior-
                                                                                            267                            year quarter based on project
                                                         222                                                   238         expansions
        Revenue                                                            213
                                       191
       (€ million)                                      10.5%
                                                                                                                         • Book-to-bill: 0.9;
Segment Technologies: sustained positive revenue trend, sequentially
    improving but negative adjusted EBITA, positive Q4 expected

                                                                 Development of revenue and profitability
                                                                                                            • Orders received
                                                                                                              -61% (org.: -62%) below prior-year
                                                         145                                      145         quarter due to project timing and the
                                       128                                                136                 careful selection of new projects
        Revenue                                                          118
       (€ million)                   -2.6%                                                                  • Book-to-bill
                                                                                                  -4.5%       At 0.6, continued focus on profitability
                                                        -8.9%           -8.9%             -9.0%               improvement and execution
                                                                                                            • Revenue
                                      Q3/18              Q4/18          Q1/19             Q2/19   Q3/19
                                                                                                              +13% (org.: +15%) increase based
                                                                                                              on good order backlog
                                                      Δ compared with           organic
                                   EBITA adj.                           x/x
                                   margin (%)            prior year                                         • Adjusted EBITA
                                                                                                              Still negative; positive EBITA contri-
    Book-to-bill                                                                                              bution expected in the fourth quarter.
          ratio                       1.7                1.0             1.0               0.8      0.6       One-time effect of -€4 million:
                                                                                                              unexpected judgement by the
                                                                                                              German High Court (BGH) that
      EBITA adj.                                                                                              revoked an arbitration award from
      (€ million)                      -3                -13             -10               -12      -7
                                                                                                              2017 (work executed in 2011)

Bilfinger SE | Company Presentation | November 2019                                                                                                page 31
Operating and free cash flows positive and above prior year
      DSO improved y-o-y with higher portion of receivables already invoiced

                                                                                                                                                                                                                             Adjusted
                        Adjusted operating cash flow1) (€ million)                                                         Net profit (€ million)                                                                       net profit (€ million)
                                                                                                                                                                                       6
                                                                      33
                                                                                                                                                                                                                                                17
                                                             15                                                                                                            6
                    Adjust-                                                                                                                                                                                                      12
                                                                                                                                               1
                     ments                 11                                                      Continuing operations
                                                             18                                                                                -1                          1
                 Reported            9                                                                     Discontinued
                                 2                                                                           operations                                                           -1
                                                                                                                                                      -1                                                                      Q3/18            Q3/19
                                 Q3/18                      Q3/19                                                          Minority  -2
                                                                                                                           interest Q3/18
 1)   Adjustments correspond to EBITA adjustments, Q3 2019 includes +€9m from IFRS 16                                                                                Q3/19

                                          Net Trade Assets                                                                                                        Net liquidity (€ million)

                                                                                                                                                    -15
                                         658                                                                                    33
          619           605                             87                                                                                                            -13
                                                                        78 65           84
                                                              67                             66                                                                                                 0             -4            -1         -4
                                                                                                           -271
                                                                                                                                                                                                                                                -275

                                                                                                            Jul. 1, 2019

                                                                                                                                OCF adjusted

                                                                                                                                                    Adjustments

                                                                                                                                                                      Net Capex

                                                                                                                                                                                           disposals
                                                                                                                                                                                           Acquisitions/

                                                                                                                                                                                                           activities
                                                                                                                                                                                                           financing
                                                                                                                                                                                                           Cash flow

                                                                                                                                                                                                                        operations
                                                                                                                                                                                                                        discontinued
                                                                                                                                                                                                                        Cash flow

                                                                                                                                                                                                                                       Other

                                                                                                                                                                                                                                                 Sep. 30, 2019
        Sep. 30,      Jun. 30,       Sep. 30,           Sep. 30,        Jun. 30,        Sep. 30,
         2018          2019           2019               2018            2019            2019
                 Net Trade Assets (€ million)                DSO (days)          DPO (days)
DSO: Trade receivables + WIP - advance payments received, DPO: Trade payables
Bilfinger SE | Company Presentation | November 2019                                                                                                                                                                                                              page 32
Disclaimer

        This presentation has been produced for support of oral information purposes only and contains forward-
        looking statements which involve risks and uncertainties. Forward-looking statements are statements that are
        not historical facts, including statements about our beliefs and expectations. Such statements made within this
        document are based on plans, estimates and projections as they are currently available to Bilfinger SE.
        Forward-looking statements are therefore valid only as of the date they are made, and we undertake no
        obligation to update publicly any of them in light of new information or future events. Apart from this, a number
        of important factors could therefore cause actual results to differ materially from those contained in any forward-
        looking statement. Such factors include the conditions in worldwide financial markets as well as the factors that
        derive from any change in worldwide economic development.
        This document does not constitute any form of offer or invitation to subscribe for or purchase any securities. In
        addition, the shares of Bilfinger SE have not been registered under United States Securities Law and may not
        be offered, sold or delivered within the United States or to US persons absent registration under or an
        applicable exemption from the registration requirements of the United States Securities Law.

Bilfinger SE | Company Presentation | November 2019                                                                           page 33
You can also read