Analysts' Ideas of the Week - www.researchfrc.com Aphria's Acquisition of Tilray Signals Industry Consolidation and More - Baystreet.ca
←
→
Page content transcription
If your browser does not render page correctly, please read the page content below

Analysts' Ideas of the Week
Aphria’s Acquisition of Tilray Signals Industry Consolidation and More
                              M&A in 2021

                       December 21, 2020
                     www.researchfrc.com
Page 2

                                             FRC Top Picks

The following table shows the last week’s top five performers among our Top Picks; all
five were juniors resource companies, including two focused on electric vehicle (“EV”)
metals, two silver, and one gold. The top performer, Fortune Minerals (TSX: FT), was
up 33% WoW, on no company specific news. We estimate that FT’s NICO project is the
largest undeveloped primary cobalt project in North America, with significant gold. A
feasibility study (completed in 2014), based on US$16/lb cobalt (vs spot price of
US$14.5), had shown an after-tax Net Present Value @ 7% of $224 million, with an
after-tax Internal Rate of Return of 15.1%. FT’s current market cap is just $27 million.
Our most recent note on FT can be viewed here.

                                   Top Five Performers Last Week

                                                  Source: FRC

Overall, our portfolio (equally weighted) was up 3.7% in the past week versus the
benchmark’s (TSXV) 4.6%. Our top picks were up 59.3%, on average, since initiation
of coverage vs the benchmark’s -7.9%.

                                                  Source: FRC

   ©2020 Fundamental Research Corp. “17+ Years of Bringing Undiscovered Investment Opportunities to the Forefront”
                    Click here to view FRC’s complete list of top picks
      PLEASE READ THE IMPORTANT DISCLOSURES AT THE BACK OF THIS REPORT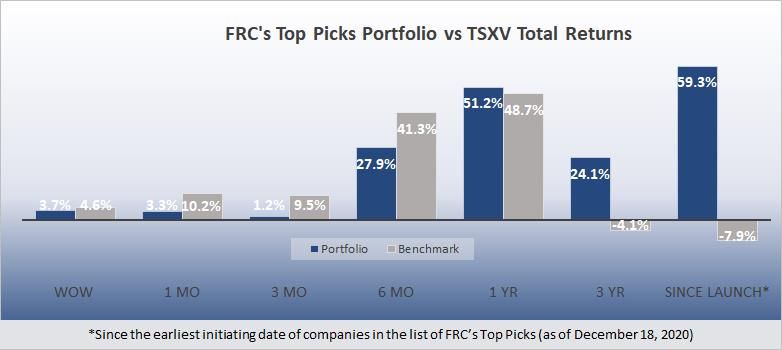
Page 3

                                         Performance by Sector

                                                  Source: FRC

Our complete list of top picks (updated weekly) can be viewed here.

                                  Weekly Mining Commentary

Global equity markets fell today on concerns of a new variant of the coronavirus that
emerged in the U.K. The U.K. has tightened restrictions, and several countries have
closed their borders to travellers from the U.K. Although the new strain is 70% more
transmissible than other variants, health officials stated that there is no evidence that
the new strain is more deadly. Sources indicate that there is no evidence to suggest
that current vaccines will be less effective against the new strain.

We believe that this new development will further delay the global economic recovery.
We believe that restrictions are unlikely to be relaxed until there is a decline in new
cases. As shown below, except India, most of the hardest-hit nations continued to
experience a surge in new cases last week.

   ©2020 Fundamental Research Corp. “17+ Years of Bringing Undiscovered Investment Opportunities to the Forefront”
                    Click here to view FRC’s complete list of top picks
      PLEASE READ THE IMPORTANT DISCLOSURES AT THE BACK OF THIS REPORT
Page 4
Source: https://www.worldometers.info/coronavirus/
Four of the seven indices we track declined WoW.
Source: FRC / Various
©2020 Fundamental Research Corp. “17+ Years of Bringing Undiscovered Investment Opportunities to the Forefront”
Click here to view FRC’s complete list of top picks
PLEASE READ THE IMPORTANT DISCLOSURES AT THE BACK OF THIS REPORTPage 5
However, a weaker US$ supported prices of mainstream metals.
As gold had a relatively strong week, valuations of gold producers increased, while that
of base metal producers remained flat.
©2020 Fundamental Research Corp. “17+ Years of Bringing Undiscovered Investment Opportunities to the Forefront”
Click here to view FRC’s complete list of top picks
PLEASE READ THE IMPORTANT DISCLOSURES AT THE BACK OF THIS REPORTPage 6
Inventory levels of base metals on both the LME and the SHFE (Shanghai) were
down WoW, which we believe was primarily a result of the strong rebound of the
Chinese economy.
©2020 Fundamental Research Corp. “17+ Years of Bringing Undiscovered Investment Opportunities to the Forefront”
Click here to view FRC’s complete list of top picks
PLEASE READ THE IMPORTANT DISCLOSURES AT THE BACK OF THIS REPORTPage 7
With restrictions tightening in Europe, we expect base metal prices to be under
pressure in the coming weeks. As mentioned last week, we do not expect the global
economy to recover to pre-COVID levels until mid-2021, as the rollout of vaccines is
expected to take three to six months. Our commodity price forecasts (unchanged) are
shown below:
In the following section, we review companies that announced key developments in the
past week.
©2020 Fundamental Research Corp. “17+ Years of Bringing Undiscovered Investment Opportunities to the Forefront”
Click here to view FRC’s complete list of top picks
PLEASE READ THE IMPORTANT DISCLOSURES AT THE BACK OF THIS REPORTPage 8
Mining / Exploration
Company Ticker Current Share FRC Fair Value Date of PR:
Name: Symbol Price: Estimate:
CopperBank CSE: CBK $0.24 N/A Dec 21, 2020
Resources Corp
PR Content FRC Opinion
CBK announced that it is planning a Positive – We consider this to be an
detailed review to monetize its portfolio by excellent strategy to raise capital without
potentially selling a NSR on its flagship share dilution. We commenced due
copper assets. diligence on CBK last month, and will be
initiating coverage in January.
CBK’s flagship assets are the Copper Creek
project in Arizona, and the Contact Copper
project in Nevada. Both are 100% owned by
CBK. Copper Creek has a completed PEA
(2013), which showed 4.9 Blbs of copper
equiv. (0.49%) measured and indicated
resource, and 3.7 Blbs (0.38%) inferred.
Contact Copper has a completed PFS
(2013), with 0.83 Bls of copper (0.2%) in the
measured and indicated category. The
projects combined have a before-tax NPV of
US$867M at US$3.5/lb copper, and
US$315M at US$3.0/lb copper. CBK’s
market capitalization is just US$14M.
We estimate that CBK’s shares are trading
at ¢0.2 per lb (U.S.) versus an average of
¢2.4 for companies with large copper
focused projects in the Americas. This is
based on 100% of measured and indicated,
and 50% of inferred resources. As
mentioned earlier, we will be initiating
coverage in January.
©2020 Fundamental Research Corp. “17+ Years of Bringing Undiscovered Investment Opportunities to the Forefront”
Click here to view FRC’s complete list of top picks
PLEASE READ THE IMPORTANT DISCLOSURES AT THE BACK OF THIS REPORTPage 9
Company Ticker Current Share FRC Fair Value Date of PR:
Name: Symbol Price: Estimate:
Gran Colombia TSX: GCM $7.11 $11.69 Dec 15, 2020
Gold Corp
PR Content FRC Opinion
Produced 17,915 oz of gold in November, Neutral – Although we were pleased with
including 15,741 oz from Segovia and the drill results (which will likely result in
2,174 oz from Marmato. Production in the resource expansion), Segovia’s November
first 11 months of 2020 was 200,235 oz production was below our expectations. We
vs 217,600 oz in the comparable period in are lowering our full year production
the previous year. Management’s forecast from 223.5 Koz to 220 Koz. Our
production guidance remains unchanged revenue forecast has been adjusted to
at 218,000 and 226,000 oz. $393M (previously $401M). Net income has
been adjusted to $52M / EPS: $0.84
GCM also announced promising results (previously $55M / EPS: $0.89). The
from its ongoing drill program (71 holes company’s shares remain undervalued
totalling 10,634 m) at Segovia. Very high- relative to its peers. The current dividend
grade intercepts were reported: yield is 2.9% p.a., compared to the sector
average of 1.4% (Source: FRC and S&P
➢ 51.22 g/t Au and 1.9 g/t Ag over 1.91 m Capital IQ).
➢ 63.92 g/t Au and 458.4 g/t Ag over 0.63 m
➢ 162.70 g/t Au and 77.0 g/t Ag over 0.51 m
➢ 87.40 g/t Au and 13.4 g/t Ag over 0.56 m
➢ 100.30 g/t Au and 59.3 g/t Ag over 1.26 m
Company Ticker Current Share FRC Fair Value Date of PR:
Name: Symbol Price: Estimate:
Caldas Gold TSXV: CGC $2.30 $3.74 Dec 15, 2020
Corp
PR Content FRC Opinion
Produced 2,174 oz of gold in November, Neutral - We are maintaining our 2020
bringing the total for the first 11 months of production forecast at 23.5 Koz, with $43M
2020 to 21,312 oz vs 23,492 oz in the in revenue, and $3M in EBITDA.
same period last year. Management’s
2020 guidance remains unchanged at
23,000 to 26,000 oz.
©2020 Fundamental Research Corp. “17+ Years of Bringing Undiscovered Investment Opportunities to the Forefront”
Click here to view FRC’s complete list of top picks
PLEASE READ THE IMPORTANT DISCLOSURES AT THE BACK OF THIS REPORTPage 10
Company Ticker Current Share FRC Fair Value Date of PR:
Name: Symbol Price: Estimate:
Southern Silver TSXV: SSV $0.50 $1.06 Dec 16, 2020
Exploration
Corp
PR Content FRC Opinion
Initial results of an ongoing 10,000 m drill Positive - These results are promising
program on the Cerro Las Minitas project considering the program is focused on step-
in Durango state returned promising out drilling for resource expansion.
values. Key highlights are listed below: Approximately 7,500 m of drilling has been
completed to date. Note that the project
➢ 28.5 m averaging 1.41 g/t Au and 36 already has a resource estimate of 134 Moz
g/t Ag (201 g/t AgEq), including 2.8 m AgEq indicated, and 138 Moz inferred.
of 5.1 g/t Au and 72 g/t Ag (552 g/t
AgEq); and
➢ 6.1 m averaging 421 g/t Ag, 0.45 g/t
Au, 5.5% Pb and 1.9% Zn (704 g/t
AgEq; 17.9% ZnEq), including 0.9 m
of 1420 g/t Ag, 0.64 g/t Au, 16.8% Pb
and 0.6% Zn (2012 g/t AgEq; 51.0%
ZnEq).
Company Ticker Current Share FRC Fair Value Date of PR:
Name: Symbol Price: Estimate:
Wealth Minerals TSXV: WML $0.09 N/A Dec 14, 2020
Ltd
PR Content FRC Opinion
Announced a non-brokered private Neutral – Funds will be used towards
placement for up to $1.5M at $0.10 per WML’s Atacama project (lithium brine in
unit. Each unit will consist of a common Chile). WML had recently announced a one-
share and half warrant (exercise price of year extension of its memorandum of
$0.15 per share for two years). understanding (“MOU”) with Uranium One
Group (“U1G”), a subsidiary of Russia’s
state nuclear company. Although deal terms
are yet to be finalized, U1G is likely to have
an option to acquire a 51% interest in
Atacama. We expect management to
outline their exploration plans for 2021 upon
completing this financing.
©2020 Fundamental Research Corp. “17+ Years of Bringing Undiscovered Investment Opportunities to the Forefront”
Click here to view FRC’s complete list of top picks
PLEASE READ THE IMPORTANT DISCLOSURES AT THE BACK OF THIS REPORTPage 11
Technology
Company Ticker Current Share FRC Fair Value Date of PR:
Name: Symbol Price: Estimate:
Microsoft Corp. NASDAQ: $218.59 $223.67 Dec 15, 2020
MSFT
PR Content FRC Opinion
Facing a class-action settlement in Neutral – We believe this case is just a
Canada for alleged anti-competitive small bump in the road. We note that the
behaviour. Canadians who purchased capped amount of $517M represents 0.4%
Microsoft’s software during 1998-2010 of MSFT’s cash as of Q1-FY2021, and just
are entitled for a claim of up to $250 (for 0.3% of our projected cash at the end of
individuals) and $650 (companies) FY2021.
without receipts. Total claims, which will
be capped at $517M, are projected to be
$400M. Refund applications will run until
September 2021, and payments will be
processed in 2022.
©2020 Fundamental Research Corp. “17+ Years of Bringing Undiscovered Investment Opportunities to the Forefront”
Click here to view FRC’s complete list of top picks
PLEASE READ THE IMPORTANT DISCLOSURES AT THE BACK OF THIS REPORTPage 12
Company Ticker Current Share FRC Fair Value Date of PR:
Name: Symbol Price: Estimate:
Kontrol Energy CSE: KNR $3.20 $6.72 Dec 15, 16 &
Corp. 17, 2020
PR Content FRC Opinion
Announced that it has entered into a Positive – We believe the agreement with
distribution agreement with Grande West Grande West is a significant development
(TSXV: BUS; a Canadian vehicle as it is the market leader in Canada’s mid-
manufacturer) to offer BioCloud size bus category. It has delivered over 450
technology as an option to its line of buses to Canada and the U.S. since
buses. Grande West also purchased two inception, to customers such as B.C.
BioCloud units for its offices. Transit.
KNR also successfully refinanced $3.7M We were also pleased with the debenture
of the $5.3M debentures that matured on refinancing, as it strengthens the company’s
December 15, 2020. balance sheet.
Management has initiated a process toFrom the demo event, we learned that the
list its shares from the CSE to the TSX,
company has received interest for BioCloud
with a longer-term plan to list on the
from multiple sectors. KNR is working on
NASDAQ. establishing partnerships in international
markets. We will publish an update report
The company held its first public shortly, highlighting our key takeaways from
demonstration on BioCloud last week. the recent demo.
Cannabis
Company Ticker Current Share FRC Fair Value Date of PR:
Name: Symbol Price: Estimate:
FinCanna CSE: CALI $0.06 $0.20 Dec 21, 2020
Capital Corp.
PR Content FRC Opinion
Provided a corporate update on its three Positive – We are pleased to see that all
portfolio companies: QVI, CTI, and GCI. three companies are making progress in
The company expects to start receiving their respective business lines. We found
royalty payments from QVI in early 2021. the websites of each of its portfolio
QVI has currently onboarded 25 brands companies to be operational, with
per management. partnerships, and brands listed, which is an
encouraging sign. Our revenue projection
for FY2021 remains unchanged at $861k.
©2020 Fundamental Research Corp. “17+ Years of Bringing Undiscovered Investment Opportunities to the Forefront”
Click here to view FRC’s complete list of top picks
PLEASE READ THE IMPORTANT DISCLOSURES AT THE BACK OF THIS REPORTPage 13
Company Ticker Current Share FRC Fair Value Date of PR:
Name: Symbol Price: Estimate:
Captiva Verde CSE: PWR $0.30 $0.95 Dec 14, 2020
Land
Corporation
PR Content FRC Opinion
Announced that Esmeralda, the Mexican Positive – The facility’s completion is inline
pharmaceutical company that PWR is in with our estimated timeline. We have
the process of acquiring, has completed projected $6.48M in revenue from
the buildout of its manufacturing facility in Esmeralda, and $22.95M in total revenue
Mexico. Sales are expected to begin in for the company in 2021 (unchanged).
March 2021. Esmeralda has an
agreement with the Mexican Health Care
Workers Union that would give PWR
access to its 1.2M members, implying a
potential for up to US$142M per year in
revenue. The acquisition is pending
approval from the exchange.
Other Updates on Coverage:
• We are terminating coverage on Siyata Mobile (NASDAQ: SYTA) upon completing a
term of coverage, per our agreement with the company. Our fair value estimate and
rating are no longer in effect.
©2020 Fundamental Research Corp. “17+ Years of Bringing Undiscovered Investment Opportunities to the Forefront”
Click here to view FRC’s complete list of top picks
PLEASE READ THE IMPORTANT DISCLOSURES AT THE BACK OF THIS REPORTPage 14
Weekly Cannabis Commentary
Cannabis Industry Performance
December 18, 2020
Company YTD 1-Week 1-Year
Aphria Inc. 50% -5% 52%
Aurora Cannabis Inc. -61% -4% -61%
Canopy Growth Corp. 27% -1% 28%
Cronos Group Inc. 4% -3% 8%
Tilray Inc. -46% 12% -48%
HEXO Corp. -36% -2% -46%
Organigram Holdings Inc. -42% 3% -45%
The Supreme Cannabis Co., Inc. -71% -3% -70%
AVERAGE -22% 0% -23%
MIN -71% -5% -70%
MAX 50% 12% 52%
Indexes YTD 1-Week 1-Year
HMMJ -2% 1% -4%
MCAN 10% 4% 9%
XCAN -25% 1% NA
Source: TMX Money, FRC
Over the past week, the Horizons Marijuana Life Sciences ETF (TSX: HMMJ / “HMMJ”),
the Standard & Poor’s/MX International Cannabis Index (“MCAN”), and the Standard &
Poor’s/TSX Cannabis Index (“XCAN”) generated returns of 1%, 4%, and 1%,
respectively.
Last week, Aphria (TSX: APHA) announced that it will be acquiring Tilray (NASDAQ:
TLRY) for US$3.9B. The combined entity will become the largest company in the
sector by revenue.
©2020 Fundamental Research Corp. “17+ Years of Bringing Undiscovered Investment Opportunities to the Forefront”
Click here to view FRC’s complete list of top picks
PLEASE READ THE IMPORTANT DISCLOSURES AT THE BACK OF THIS REPORTPage 15
Source: Yahoo! Finance
We expect to see consolidation in the space, which will result in improved margins from
synergies. We believe that larger companies will be targeting well-run small/mid
cap companies in the space.
Valuation of Select Canadian LPs
The following chart shows the average Enterprise Value to Revenue (“EV/R”) ratio of
the Canadian cannabis companies we track.
Average EV/R (October 2019 – December 2020)
©2020 Fundamental Research Corp. “17+ Years of Bringing Undiscovered Investment Opportunities to the Forefront”
Click here to view FRC’s complete list of top picks
PLEASE READ THE IMPORTANT DISCLOSURES AT THE BACK OF THIS REPORTPage 16
Dec 11, 2020 Dec 18, 2020
Company Ticker TEV/Revenue TEV/EBITDA TEV/Revenue TEV/EBITDA
Aphria Inc. TSX: APHA 5.4 41.7 5.2 40.0
Aurora Cannabis Inc. TSX: ACB 8.7 NM 8.5 NM
Canopy Growth Corp. TSX: WEED 24.6 NM 24.2 NM
Cronos Group Inc. TSX: CRON 63.1 NM 60.9 NM
Tilray Inc. NASDAQ: TLRY 7.6 NM 8.4 NM
HEXO Corp. NYSE: HEXO 6.5 NM 6.3 NM
Organigram Holdings Inc. TSX: OGI 5.1 NM 5.3 NM
The Supreme Cannabis Co., Inc. TSX: FIRE 3.9 NM 3.8 NM
AVERAGE 15.6 NM 15.3 NM
MEDIAN 7.0 NM 7.4 NM
MINIMUM 3.9 NM 3.8 NM
MAXIMUM 63.1 NM 60.9 NM
Source: S&P Capital IQ, FRC
The average EV/R, as of December 18, 2020, was 15.3x – a WoW decrease from 15.6x.
The average EV/R, from October 7, 2019, to December 18, 2020, is 11.9x.
Canadian Retail Cannabis Pricing
Province (As of 2020/12/21) Average Price per Gram Average Price per Gram THC Average Price per Gram CBD # of Products Min. Price Max. Price
B.C. $ 10.09 $ 10.18 $ 8.42 273 $ 3.93 $ 80.29
Ontario $ 9.78 $ 9.97 $ 8.08 314 $ 4.20 $ 23.98
Quebec $ 9.20 $ 9.16 $ 9.55 214 $ 4.85 $ 14.55
Alberta $ 11.41 $ 11.40 $ 11.39 322 $ 3.93 $ 22.00
N.B. $ 9.66 $ 9.90 $ 7.58 166 $ 3.50 $ 16.28
P.E.I. $ 9.79 $ 9.81 $ 9.49 159 $ 2.20 $ 23.30
Newfoundland $ 10.13 $ 10.09 $ 10.36 153 $ 4.46 $ 15.40
Yukon $ 14.98 $ 15.07 $ 13.95 12 $ 10.49 $ 16.15
N.S. $ 10.40 $ 10.45 $ 9.82 176 $ 5.36 $ 42.85
Nunavut $ 11.69 $ 11.80 $ 12.41 34 $ 5.19 $ 17.91
Northwest Territories $ 11.54 $ 11.54 3 $ 12.08 $ 13.00
Manitoba $ 11.53 $ 11.50 $ 11.62 316 $ 4.90 $ 20.43
Saskatchewan $ 12.91 $ 12.97 $ 12.08 172 4.95 38.50
CANADA $ 11.01 $ 11.07 $ 10.40
Province (As of 2020/12/14) Average Price per Gram Average Price per Gram THC Average Price per Gram CBD # of Products Min. Price Max. Price
B.C. $ 10.13 $ 10.22 $ 8.42 272 $ 3.93 $ 80.29
Ontario $ 9.79 $ 9.97 $ 8.20 313 $ 4.20 $ 23.98
Quebec $ 9.13 $ 9.09 $ 9.53 209 $ 4.85 $ 14.55
Alberta $ 11.42 $ 11.41 $ 11.39 319 $ 3.93 $ 22.00
N.B. $ 9.74 $ 9.96 $ 7.74 166 $ 3.50 $ 16.28
P.E.I. $ 9.80 $ 9.82 $ 9.49 157 $ 2.20 $ 23.30
Newfoundland $ 10.20 $ 10.18 $ 10.36 151 $ 4.62 $ 15.40
Yukon $ 14.98 $ 15.07 $ 13.95 12 $ 10.49 $ 16.15
N.S. $ 10.40 $ 10.45 $ 9.82 176 $ 5.36 $ 42.85
Nunavut $ 11.69 $ 11.80 $ 12.41 34 $ 5.19 $ 17.91
Northwest Territories $ 11.54 $ 11.54 3 $ 12.08 $ 13.00
Manitoba $ 11.57 $ 11.54 $ 11.62 317 $ 4.90 $ 20.43
Saskatchewan $ 12.95 $ 13.01 $ 12.08 170 4.95 38.50
CANADA $ 11.03 $ 11.08 $ 10.42
Source: Online Provincial Cannabis Stores, FRC
The average retail price per gram declined week-over-week to $11.01 from $11.03.
The below chart shows Canadian retail dried cannabis flower pricing since we began
price coverage.
©2020 Fundamental Research Corp. “17+ Years of Bringing Undiscovered Investment Opportunities to the Forefront”
Click here to view FRC’s complete list of top picks
PLEASE READ THE IMPORTANT DISCLOSURES AT THE BACK OF THIS REPORTPage 17
Canadian Retail Dried Cannabis Flower Pricing
Source: Online Provincial Cannabis Stores, FRC
Canadian Retail Cannabis Stores
As of December 21, 2020, there are 1,373 retail cannabis stores, a week-over-week
increase of 28 stores across Canada, including two in B.C., four in Alberta, and 22 in
Ontario. We expect Ontario’s store count to continue to grow, driven by the recent
mandate of the Alcohol and Gaming Commission of Ontario (AGCO) to approve more
Retail Store Authorizations (RSA).
Nationwide Store Count
Source: Provincial Websites, FRC
©2020 Fundamental Research Corp. “17+ Years of Bringing Undiscovered Investment Opportunities to the Forefront”
Click here to view FRC’s complete list of top picks
PLEASE READ THE IMPORTANT DISCLOSURES AT THE BACK OF THIS REPORTPage 18
Dec-7-2020 Dec-14-2020 Dec-21-2020
Geographic Region Store Count Store Count Store Count Population Population / Store
Alberta 543 543 547 4,428,247 8,096
B.C. 281 298 300 5,120,184 17,067
Manitoba 38 38 38 1,379,121 36,293
N.B. 20 20 20 780,890 39,045
N.S. 20 20 20 978,274 48,914
Newfoundland 27 27 27 520,437 19,275
Northwest Territories 5 5 5 44,982 8,996
Nunavut n/a n/a n/a 39,486 N/A
Ontario 262 290 312 14,745,040 47,260
P.E.I. 4 4 4 158,717 39,679
Quebec 45 45 45 8,552,362 190,052
Saskatchewan 50 50 50 1,181,987 23,640
Yukon 5 5 5 41,293 8,259
CANADA 1,300 1,345 1,373 37,971,020 27,656
Source: Provincial Websites, FRC
©2020 Fundamental Research Corp. “17+ Years of Bringing Undiscovered Investment Opportunities to the Forefront”
Click here to view FRC’s complete list of top picks
PLEASE READ THE IMPORTANT DISCLOSURES AT THE BACK OF THIS REPORTPage 19
Disclaimers and Disclosure
The opinions expressed in this report are the true opinions of the analyst(s) about any companies and industries mentioned. Any
“forward looking statements” are our best estimates and opinions based upon information that is publicly available and that we
believe to be correct, but we have not independently verified with respect to truth or correctness. There is no guarantee that our
forecasts will materialize. Actual results will likely vary. Companies mentioned in pages 2 and 8-13 (except MSFT) are covered by
FRC under an issuer paid model. FRC or companies with related management, and Analysts, may hold shares in some companies
mentioned in this report including Barrick, Rio, MSFT and KNR. Distribution procedure: our reports are distributed first to our web-
based subscribers on the date shown on this report then made available to delayed access users through various other channels for
a limited time.
To subscribe for real-time access to research, visit https://www.researchfrc.com/website/subscribe for subscription options.
This report contains "forward looking" statements. Forward-looking statements regarding the Company, industry, and/or stock’s
performance inherently involve risks and uncertainties that could cause actual results to differ from such forward-looking statements.
Factors that would cause or contribute to such differences include, but are not limited to, continued acceptance of the Company's
products/services in the marketplace; acceptance in the marketplace of the Company's new product lines/services; competitive
factors; new product/service introductions by others; technological changes; dependence on suppliers; systematic market risks and
other risks discussed in the Company's periodic report filings, including interim reports, annual reports, and annual information forms
filed with the various securities regulators. By making these forward-looking statements, Fundamental Research Corp. and the
analyst/author of this report undertakes no obligation to update these statements for revisions or changes after the date of this
report.
Fundamental Research Corp DOES NOT MAKE ANY WARRANTIES, EXPRESSED OR IMPLIED, AS TO RESULTS TO BE
OBTAINED FROM USING THIS INFORMATION AND MAKES NO EXPRESS OR IMPLIED WARRANTIES OR FITNESS FOR A
PARTICULAR USE. ANYONE USING THIS REPORT ASSUMES FULL RESPONSIBILITY FOR WHATEVER RESULTS THEY
OBTAIN FROM WHATEVER USE THE INFORMATION WAS PUT TO. ALWAYS TALK TO YOUR FINANCIAL ADVISOR BEFORE
YOU INVEST. WHETHER A STOCK SHOULD BE INCLUDED IN A PORTFOLIO DEPENDS ON ONE’S RISK TOLERANCE,
OBJECTIVES, SITUATION, RETURN ON OTHER ASSETS, ETC. ONLY YOUR INVESTMENT ADVISOR WHO KNOWS YOUR
UNIQUE CIRCUMSTANCES CAN MAKE A PROPER RECOMMENDATION AS TO THE MERIT OF ANY PARTICULAR
SECURITY FOR INCLUSION IN YOUR PORTFOLIO. This REPORT is solely for informative purposes and is not a solicitation or an
offer to buy or sell any security. It is not intended as being a complete description of the company, industry, securities or
developments referred to in the material. Any forecasts contained in this report were independently prepared unless otherwise
stated, and HAVE NOT BEEN endorsed by the Management of the company which is the subject of this report. Additional
information is available upon request. THIS REPORT IS COPYRIGHT. YOU MAY NOT REDISTRIBUTE THIS REPORT WITHOUT
OUR PERMISSION. Please give proper credit, including citing Fundamental Research Corp and/or the analyst, when quoting
information from this report. The information contained in this report is intended to be viewed only in jurisdictions where it may be
legally viewed and is not intended for use by any person or entity in any jurisdiction where such use would be contrary to local
regulations or which would require any registration requirement within such jurisdiction.
©2020 Fundamental Research Corp. “17+ Years of Bringing Undiscovered Investment Opportunities to the Forefront”
Click here to view FRC’s complete list of top picks
PLEASE READ THE IMPORTANT DISCLOSURES AT THE BACK OF THIS REPORTYou can also read