ANALYSTS' IDEAS OF THE WEEK - KONTROL'S COVID DETECTION UNIT TESTED AT A MCDONALD'S LOCATION - BAYSTREET.CA
←
→
Page content transcription
If your browser does not render page correctly, please read the page content below

Analysts' Ideas of the Week
Kontrol’s COVID Detection Unit Tested at a McDonald’s Location

                      November 30, 2020
                    www.researchfrc.com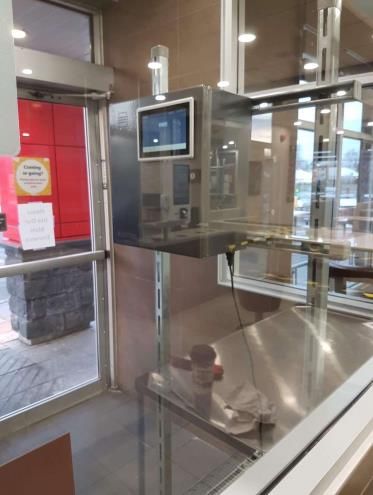
Page 2

                                             FRC Top Picks

The following table shows last week’s top five performers among our Top Picks,
including three resource companies and two cannabis companies. The top performer,
Noram Ventures (TSXV: NRM), was up 73% WoW. The company is drilling its Zeus
lithium project in Clayton Valley, Nevada. An updated resource estimate is expected in
Q1-2021. NRM’s shares are up 100% since we initiated coverage on September 23,
2020. Our initiation report on NRM can be viewed here.

                                   Top Five Performers Last Week

                                                  Source: FRC

Overall, our portfolio (equally weighted) was up 1.5% in the past week versus the
benchmark’s (TSXV) 1.2%. As shown below, our portfolio has outperformed the TSXV
in five out of seven time periods we track:

                                                  Source: FRC

   ©2020 Fundamental Research Corp. “17+ Years of Bringing Undiscovered Investment Opportunities to the Forefront”
                    Click here to view FRC’s complete list of top picks
      PLEASE READ THE IMPORTANT DISCLOSURES AT THE BACK OF THIS REPORT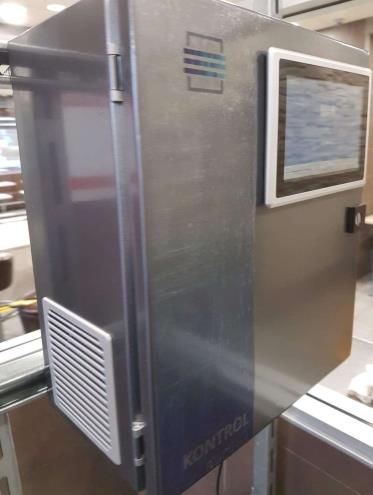
Page 3

                                         Performance by Sector

                                                  Source: FRC

Our complete list of top picks (updated weekly) can be viewed here.

                                  Weekly Mining Commentary

Markets continued to rally based on encouraging developments surrounding vaccines in
the past week. Sources indicate that the U.K. is expected to approve Pfizer’s (NYSE:
PFE) vaccine within days. Moderna (NASDAQ: MRNA) stated that their first vaccine
shots could be ready by December 21st. In anticipation of approvals, pharma
companies have already started preparations to distribute their vaccines.
Goldman Sachs (NYSE: GS) came out with a projected vaccine timeline, which showed
that half of the U.S. and Canada’s population will be vaccinated by April 2021, and 70%
of the population in developed markets by Fall 2021.

Another positive development in the past week was that most of Europe, the U.S. and
India experienced a decline in new cases. Brazil, Mexico, and Canada are on their
second-wave, and experiencing a surge in new cases.

   ©2020 Fundamental Research Corp. “17+ Years of Bringing Undiscovered Investment Opportunities to the Forefront”
                    Click here to view FRC’s complete list of top picks
      PLEASE READ THE IMPORTANT DISCLOSURES AT THE BACK OF THIS REPORT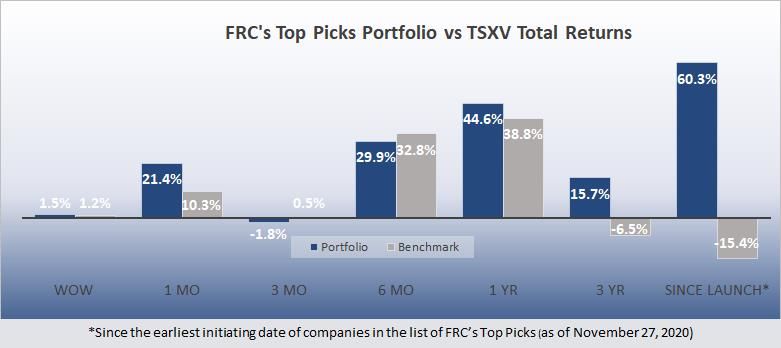
Page 4

                          Source: https://www.worldometers.info/coronavirus/

As a result of all the positive developments in the past week, stock markets and
copper continued to gain strength. Not surprisingly, the US$, gold and silver reported
losses, as demand for safe haven assets typically rises when there is global economic
uncertainty and vice versa.

   ©2020 Fundamental Research Corp. “17+ Years of Bringing Undiscovered Investment Opportunities to the Forefront”
                    Click here to view FRC’s complete list of top picks
      PLEASE READ THE IMPORTANT DISCLOSURES AT THE BACK OF THIS REPORT
Page 5
Five of the seven indices we track are up WoW (orange bars), and four are trading
higher than pre-COVID19 levels (blue bars).
Source: FRC / Various
Copper inventory levels continued to decline on a WoW basis, both on the LME
(London), and on the SHFE (Shanghai). We believe that China is the primary demand
driver. China recently announced several positive macroeconomic data, including strong
industrial production, retail sales, and lower unemployment.
©2020 Fundamental Research Corp. “17+ Years of Bringing Undiscovered Investment Opportunities to the Forefront”
Click here to view FRC’s complete list of top picks
PLEASE READ THE IMPORTANT DISCLOSURES AT THE BACK OF THIS REPORTPage 6
Inline with commodity prices, valuations of base metals increased, while that of
gold declined in the past week.
©2020 Fundamental Research Corp. “17+ Years of Bringing Undiscovered Investment Opportunities to the Forefront”
Click here to view FRC’s complete list of top picks
PLEASE READ THE IMPORTANT DISCLOSURES AT THE BACK OF THIS REPORTPage 7
©2020 Fundamental Research Corp. “17+ Years of Bringing Undiscovered Investment Opportunities to the Forefront”
Click here to view FRC’s complete list of top picks
PLEASE READ THE IMPORTANT DISCLOSURES AT THE BACK OF THIS REPORTPage 8
As the rollout of vaccines is expected to take three to six months, we do not
expect the economy to recover to pre-COVID levels until mid-2021. We believe that
gold prices will remain volatile in the coming months, and gain strength in the second
half of 2021, when inflation kicks-in from the stimulus packages and economic growth.
We are raising our base metal price forecasts for 2021 based on positive developments
surrounding vaccines. That said, we believe that the recent run-up in base metal
prices is an overreaction. Our commodity price forecasts (unchanged) are shown
below:
In the following section, we review companies that announced key developments in the
past week.
©2020 Fundamental Research Corp. “17+ Years of Bringing Undiscovered Investment Opportunities to the Forefront”
Click here to view FRC’s complete list of top picks
PLEASE READ THE IMPORTANT DISCLOSURES AT THE BACK OF THIS REPORTPage 9
Mining / Exploration
Company Ticker Current Share FRC Fair Value Date of PR:
Name: Symbol Price: Estimate:
Azarga TSX: AZZ $0.22 $0.79 Nov 25, 2020
Uranium Corp.
PR Content FRC Opinion
Received Final Class III and Class V Positive – This is another key milestone for
underground injection control permits for AZZ, and brings the company one step
the Dewey Burdock project in South closer to becoming the next uranium
Dakota, from the United States producer in the U.S. With federal permits
Environmental Protection Agency. now in place, the company just needs to
finalize the state permitting process to
commence construction. Note that the
South Dakota Department of Environment
and Natural Resources (“DENR”) staff have
already recommended approval of the key
state permits. Board hearings to finalize the
state permits were deferred until the federal
permits were issued. With federal permits
now place, AZZ will recommence the state
permitting process right away. The project is
planned to be an in-situ recovery operation,
which has a significantly lower
CAPEX/OPEX relative to conventional
open-pit/underground uranium operations. A
recent PEA had returned an After Tax–
Internal Rate of Return (“AT-IRR”) of 50%,
and an After Tax – Net Present Value (“AT-
NPV”) at 8% of US$148M. AZZ’s market
capitalization is $44M.
©2020 Fundamental Research Corp. “17+ Years of Bringing Undiscovered Investment Opportunities to the Forefront”
Click here to view FRC’s complete list of top picks
PLEASE READ THE IMPORTANT DISCLOSURES AT THE BACK OF THIS REPORTPage 10
Company Ticker Current Share FRC Fair Value Date of PR:
Name: Symbol Price: Estimate:
Cornerstone TSXV: CGP $5.45 $7.44 Nov 25, 2020
Capital
Resources Inc.
PR Content FRC Opinion
Pursuing a $7.7M private placement at $5 Positive – This financing is on the back of a
per share. failed attempt by SolGold (LSE: SOLG) to
acquire CGP. We continue to believe that
Cascabel is an excellent acquisition target,
and would not be surprised if BHP (ASX:
BHP) or Newcrest / ASX: NCM (who are
also significant shareholders of SOLG) have
a go at SOLG and CGP at the same time.
Company Ticker Current Share FRC Fair Value Date of PR:
Name: Symbol Price: Estimate:
Grid Metals TSXV: GRDM $0.11 $0.54 Nov 24, 2020
Corp.
PR Content FRC Opinion
Drilled eight holes (1,400 m) on its 100% Positive - These results are promising,
owned East Bull Lake ("EBL") palladium especially considering that EBL is an early
property in Ontario, and announced stage/relatively untested property in
results of five. Key results presented Sudbury. Grid intends to conduct another
below: drill program in Q1-2021. The company’s
flagship asset is an advanced stage nickel-
➢ 43.0 m averaging 0.37 g/t Pd, 0.14 copper-palladium asset in Manitoba, which
g/t Pt and 0.03 g/t Au, including 3.0 has an indicated resource of 201 Mlbs
m of higher-grade values such as 1.43 nickel, 276 Mlbs copper, and 0.2 Moz
g/t Pd, 0.54 g/t Pt and 0.08 g/t Au palladium. A 2014 PEA had returned an AT-
➢ 29.6 m averaging 0.32 g/t Pd, 0.10 g/t NPV of $97M, and an AT-IRR of 16%,
Pt and 0.02 g/t Au, including 3.6 m of based on US$3.4 per lb copper, and
higher-grade values such as 0.99 g/t US$8.5/lb nickel. Grid’s current market
Pd, 0.27 g/t Pt and 0.03 g/t Au capitalization is just $6M.
➢ 5 m of 1.66 g/t Pd, 0.34 g/t Pt and
0.06 g/t Au (2.05 g/t combined Pd + Pt
+ Au), including 1 m of 5.41 g/t Pd and
0.89 g/t Pt.
©2020 Fundamental Research Corp. “17+ Years of Bringing Undiscovered Investment Opportunities to the Forefront”
Click here to view FRC’s complete list of top picks
PLEASE READ THE IMPORTANT DISCLOSURES AT THE BACK OF THIS REPORTPage 11
Company Ticker Current Share FRC Fair Value Date of PR:
Name: Symbol Price: Estimate:
Sirios TSXV: SOI $0.14 $0.41 Nov 26, 2020
Resources Inc.
PR Content FRC Opinion
Announced a $2.1M financing at $0.15 Positive – This financing follows a highly
per unit. Each unit will consist of a encouraging recently updated resource
common share and one-half warrant estimate (1.96 Moz at 0.65 gpt gold) on the
(exercise price of $0.23 per share for 1.5 Cheechoo gold property, located 10–15 km
years). from Newmont Goldcorp’s (TSX: NEM)
Éléonore gold mine.
Special Situations and Technology
Kontrol Energy Corp. (CSE: KNR / Current Share Price: $3.42 / FRC Fair Value
Estimate: $6.72)
Kontrol announced today that it filed patent applications for its BioCloud technology in
the U.S. and Canada. On another positive note, we found that a McDonald’s (NYSE:
MCD) location in London, Ontario, gave BioCloud a test run last week. We reached out
to the location’s management (ended up talking to a shift supervisor), and learned that
KNR’s device was installed for a day to screen employees prior to checking in to work.
The device did not detect virus on any of the employees. Although we were unable to
find details of the arrangement between Kontrol and MCD’s location, we were informed
by the supervisor that the location is likely to conduct further testing, which we believe is
an encouraging sign.
BioCloud installed at McDonald’s (Highbury and Hamilton, London, Ontario)
Source: Twitter
©2020 Fundamental Research Corp. “17+ Years of Bringing Undiscovered Investment Opportunities to the Forefront”
Click here to view FRC’s complete list of top picks
PLEASE READ THE IMPORTANT DISCLOSURES AT THE BACK OF THIS REPORTPage 12
In KNR’s Q3 earnings call today, management did not confirm or deny any of the above
information, and refrained from providing any details as they are under non-disclose
agreements. However, management did indicate that there are multiple units currently
being tested at various locations. We believe the fact that KNR’s units are being
tested by various entities speaks for the market interest for detection devices,
despite the rollout of vaccines. We will publish an update report shortly on the Q3
results.
Cannabis
Company Ticker Current Share FRC Fair Value Date of PR:
Name: Symbol Price: Estimate:
Captiva Verde CSE: PWR $0.23 $0.95 Nov 29, 2020
Land
Corporation
PR Content FRC Opinion
Announced that it has completed Positive – We are pleased to see the
processing of the first harvest from its company complete processing within our
outdoor facility in New Brunswick. expected timeline. Our revenue projections
Management stated that their cost was from the facility (unchanged) for 2020 and
$0.22/gram for dried cannabis, which 2021 are $1.6M and $16.5M, respectively.
consisted of 21.53% THC and 2.7% OPEX of $0.22 is well below management’s
terpenes. original guidance of $0.25, and our
conservative forecast of $0.35. Also, THC
levels are on the higher end (typically 15-
20% is considered high), and terpenes are
in line with average levels (typically 2-5%).
©2020 Fundamental Research Corp. “17+ Years of Bringing Undiscovered Investment Opportunities to the Forefront”
Click here to view FRC’s complete list of top picks
PLEASE READ THE IMPORTANT DISCLOSURES AT THE BACK OF THIS REPORTPage 13
Weekly Cannabis Commentary
Cannabis Industry Performance
November 30, 2020
Company YTD 1-Week 1-Year
Aphria Inc. 65% 23% 74%
Aurora Cannabis Inc. -54% 26% -63%
Canopy Growth Corp. 43% 8% 55%
Cronos Group Inc. 17% 11% 30%
Tilray Inc. -45% 28% -52%
HEXO Corp. -42% 21% -56%
Organigram Holdings Inc. -43% 14% -51%
The Supreme Cannabis Co., Inc. -77% 0% -78%
Indiva Limited 0% 5% 5%
AVERAGE -15% 15% -15%
MIN -77% 0% -78%
MAX 65% 28% 74%
Indexes YTD 1-Week 1-Year
HMMJ 3% 10% -2%
MCAN 15% 10% 12%
XCAN -17% 15% NA
Source: TMX Money, FRC
Over the past week, the Horizons Marijuana Life Sciences ETF (TSX: HMMJ / “HMMJ”),
the Standard & Poor’s/MX International Cannabis Index (“MCAN”), and the Standard &
Poor’s/TSX Cannabis Index (“XCAN”) generated a return of 10%, 10%, and 15%,
respectively, as most cannabis stocks rallied due to optimism around the U.S. House’s
upcoming voting on ending the federal ban on marijuana.
Valuation of Select Canadian LPs
The following chart shows the average Enterprise Value to Revenue (“EV/R”) of the
Canadian cannabis companies that we track.
©2020 Fundamental Research Corp. “17+ Years of Bringing Undiscovered Investment Opportunities to the Forefront”
Click here to view FRC’s complete list of top picks
PLEASE READ THE IMPORTANT DISCLOSURES AT THE BACK OF THIS REPORTPage 14
Average EV/R (October 2019 – November 2020)
Nov 23, 2020 Nov 30, 2020
Company Ticker TEV/Revenue TEV/EBITDA TEV/Revenue TEV/EBITDA
Aphria Inc. TSX: APHA 4.3 33.0 5.4 41.4
Aurora Cannabis Inc. TSX: ACB 6.8 NM 9.4 NM
Canopy Growth Corp. TSX: WEED 22.4 NM 27.5 NM
Cronos Group Inc. TSX: CRON 55.8 NM 69.3 NM
Tilray Inc. NASDAQ: TLRY 7.3 NM 8.1 NM
HEXO Corp. NYSE: HEXO 4.5 NM 5.7 NM
Organigram Holdings Inc. TSX: OGI 4.0 NM 4.5 NM
The Supreme Cannabis Co., Inc. TSX: FIRE 3.3 NM 3.3 NM
AVERAGE 13.5 NM 16.6 NM
MEDIAN 5.7 NM 6.9 NM
MINIMUM 3.3 NM 3.3 NM
MAXIMUM 55.8 NM 69.3 NM
Source: S&P Capital IQ, FRC
The average EV/R, as of November 30, 2020, is 16.6x – an increase from 13.5x a week
ago. The average EV/R, from October 7, 2019 to date, is 11.67x.
Canadian Retail Cannabis Pricing
Province (As of 2020/11/30) Average Price per Gram Average Price per Gram THC Average Price per Gram CBD # of Products Min. Price Max. Price
B.C. $ 10.13 $ 10.21 $ 8.42 265 $ 3.93 $ 80.29
Ontario $ 9.81 $ 9.99 $ 8.20 308 $ 4.20 $ 23.98
Quebec $ 9.13 $ 9.09 $ 9.53 204 $ 4.85 $ 14.55
Alberta $ 11.41 $ 11.41 $ 11.39 317 $ 3.93 $ 22.00
N.B. $ 9.73 $ 9.96 $ 7.74 165 $ 3.50 $ 16.28
P.E.I. $ 9.80 $ 9.82 $ 9.49 151 $ 2.20 $ 23.30
Newfoundland $ 10.20 $ 10.17 $ 10.36 150 $ 4.62 $ 15.40
Yukon $ 14.98 $ 15.07 $ 13.95 12 $ 10.49 $ 16.15
N.S. $ 10.37 $ 10.43 $ 9.82 173 $ 5.36 $ 42.85
Nunavut $ 11.69 $ 11.80 $ 12.41 34 $ 5.19 $ 17.91
Northwest Territories $ 11.54 $ 11.54 3 $ 12.08 $ 13.00
Manitoba $ 11.64 $ 11.62 $ 11.62 311 $ 4.90 $ 20.43
Saskatchewan $ 12.89 $ 12.95 $ 12.08 171 4.95 38.50
CANADA $ 11.02 $ 11.08 $ 10.42
©2020 Fundamental Research Corp. “17+ Years of Bringing Undiscovered Investment Opportunities to the Forefront”
Click here to view FRC’s complete list of top picks
PLEASE READ THE IMPORTANT DISCLOSURES AT THE BACK OF THIS REPORTPage 15
Province (As of 2020/11/23) Average Price per Gram Average Price per Gram THC Average Price per Gram CBD # of Products Min. Price Max. Price
B.C. $ 10.14 $ 10.22 $ 8.48 260 $ 3.93 $ 80.29
Ontario $ 9.77 $ 9.96 $ 8.20 304 $ 4.20 $ 23.98
Quebec $ 9.14 $ 9.10 $ 9.53 203 $ 4.85 $ 14.55
Alberta $ 11.44 $ 11.43 $ 11.39 311 $ 3.93 $ 22.00
N.B. $ 9.78 $ 10.01 $ 7.74 165 $ 3.50 $ 16.28
P.E.I. $ 9.85 $ 9.87 $ 9.49 149 $ 2.20 $ 23.30
Newfoundland $ 10.20 $ 10.17 $ 10.36 146 $ 4.62 $ 15.40
Yukon $ 14.98 $ 15.07 $ 13.95 12 $ 10.49 $ 16.15
N.S. $ 10.37 $ 10.43 $ 9.82 173 $ 5.36 $ 42.85
Nunavut $ 11.69 $ 11.80 $ 12.41 34 $ 5.19 $ 17.91
Northwest Territories $ 11.54 $ 11.54 3 $ 12.08 $ 13.00
Manitoba $ 11.64 $ 11.62 $ 11.62 311 $ 4.90 $ 20.43
Saskatchewan $ 12.89 $ 12.95 $ 12.08 171 4.95 38.50
CANADA $ 11.03 $ 11.09 $ 10.42
Source: Online Provincial Cannabis Stores, FRC
The average retail price per gram decreased by $0.01 week-over-week to $11.02.
The below chart shows Canadian retail dried cannabis flower pricing since we began
price coverage.
Canadian Retail Dried Cannabis Flower Pricing
Source: Online Provincial Cannabis Stores, FRC
Canadian Retail Cannabis Stores
As of November 30, 2020, there are 1,290 retail cannabis stores a week-over-week
increase of nine stores across Canada, including three each in Alberta, B.C., and
Ontario
©2020 Fundamental Research Corp. “17+ Years of Bringing Undiscovered Investment Opportunities to the Forefront”
Click here to view FRC’s complete list of top picks
PLEASE READ THE IMPORTANT DISCLOSURES AT THE BACK OF THIS REPORTPage 16
Nationwide Store Count
Source: Provincial Websites, FRC
Nov-16-2020 Nov-23-2020 Nov-30-2020
Geographic Region Store Count Store Count Store Count Population Population / Store
Alberta 541 540 543 4,428,247 8,155
B.C. 275 276 279 5,120,184 18,352
Manitoba 30 38 38 1,379,121 36,293
N.B. 20 20 20 780,890 39,045
N.S. 15 20 20 978,274 48,914
Newfoundland 26 27 27 520,437 19,275
Northwest Territories 5 5 5 44,982 8,996
Nunavut n/a n/a n/a 39,486 N/A
Ontario 251 251 254 14,745,040 58,051
P.E.I. 4 4 4 158,717 39,679
Quebec 45 45 45 8,552,362 190,052
Saskatchewan 44 50 50 1,181,987 23,640
Yukon 5 5 5 41,293 8,259
CANADA 1,261 1,281 1,290 37,971,020 29,435
Source: Provincial Websites, FRC
©2020 Fundamental Research Corp. “17+ Years of Bringing Undiscovered Investment Opportunities to the Forefront”
Click here to view FRC’s complete list of top picks
PLEASE READ THE IMPORTANT DISCLOSURES AT THE BACK OF THIS REPORTPage 17
Disclaimers and Disclosure
The opinions expressed in this report are the true opinions of the analyst(s) about any companies and industries mentioned. Any
“forward looking statements” are our best estimates and opinions based upon information that is publicly available and that we
believe to be correct, but we have not independently verified with respect to truth or correctness. There is no guarantee that our
forecasts will materialize. Actual results will likely vary. Companies mentioned in pages 2 and 9-12 are covered by FRC under an
issuer paid model. FRC or companies with related management, and Analysts, may hold shares in some companies mentioned in
this report including Indiva, MCD Barrick, and KNR. Distribution procedure: our reports are distributed first to our web-based
subscribers on the date shown on this report then made available to delayed access users through various other channels for a
limited time.
To subscribe for real-time access to research, visit https://www.researchfrc.com/website/subscribe for subscription options.
This report contains "forward looking" statements. Forward-looking statements regarding the Company, industry, and/or stock’s
performance inherently involve risks and uncertainties that could cause actual results to differ from such forward-looking statements.
Factors that would cause or contribute to such differences include, but are not limited to, continued acceptance of the Company's
products/services in the marketplace; acceptance in the marketplace of the Company's new product lines/services; competitive
factors; new product/service introductions by others; technological changes; dependence on suppliers; systematic market risks and
other risks discussed in the Company's periodic report filings, including interim reports, annual reports, and annual information forms
filed with the various securities regulators. By making these forward-looking statements, Fundamental Research Corp. and the
analyst/author of this report undertakes no obligation to update these statements for revisions or changes after the date of this
report.
Fundamental Research Corp DOES NOT MAKE ANY WARRANTIES, EXPRESSED OR IMPLIED, AS TO RESULTS TO BE
OBTAINED FROM USING THIS INFORMATION AND MAKES NO EXPRESS OR IMPLIED WARRANTIES OR FITNESS FOR A
PARTICULAR USE. ANYONE USING THIS REPORT ASSUMES FULL RESPONSIBILITY FOR WHATEVER RESULTS THEY
OBTAIN FROM WHATEVER USE THE INFORMATION WAS PUT TO. ALWAYS TALK TO YOUR FINANCIAL ADVISOR BEFORE
YOU INVEST. WHETHER A STOCK SHOULD BE INCLUDED IN A PORTFOLIO DEPENDS ON ONE’S RISK TOLERANCE,
OBJECTIVES, SITUATION, RETURN ON OTHER ASSETS, ETC. ONLY YOUR INVESTMENT ADVISOR WHO KNOWS YOUR
UNIQUE CIRCUMSTANCES CAN MAKE A PROPER RECOMMENDATION AS TO THE MERIT OF ANY PARTICULAR
SECURITY FOR INCLUSION IN YOUR PORTFOLIO. This REPORT is solely for informative purposes and is not a solicitation or an
offer to buy or sell any security. It is not intended as being a complete description of the company, industry, securities or
developments referred to in the material. Any forecasts contained in this report were independently prepared unless otherwise
stated, and HAVE NOT BEEN endorsed by the Management of the company which is the subject of this report. Additional
information is available upon request. THIS REPORT IS COPYRIGHT. YOU MAY NOT REDISTRIBUTE THIS REPORT WITHOUT
OUR PERMISSION. Please give proper credit, including citing Fundamental Research Corp and/or the analyst, when quoting
information from this report. The information contained in this report is intended to be viewed only in jurisdictions where it may be
legally viewed and is not intended for use by any person or entity in any jurisdiction where such use would be contrary to local
regulations or which would require any registration requirement within such jurisdiction.
©2020 Fundamental Research Corp. “17+ Years of Bringing Undiscovered Investment Opportunities to the Forefront”
Click here to view FRC’s complete list of top picks
PLEASE READ THE IMPORTANT DISCLOSURES AT THE BACK OF THIS REPORTYou can also read