The market is resembling the 1999 rallyfocus on SPAC and crypto - Weekly Letter
←
→
Page content transcription
If your browser does not render page correctly, please read the page content below
Weekly Letter:

The market is resembling
the 1999 rally- focus on
SPAC and crypto
16 February 2021
Carlsquare
Anders Elgemyr, Henrik Harryson and Bertil Nilsson
www.carlsquare.com
The market is resembling the 1999 rally- focus on SPAC and
crypto
    • Despite the pandemic and economic downturn,
      markets are rising in a continuing frenzy fueled by
      liquidity from central banks and governments.
    • SPAC and crypto has been given the same status as the
      “dotcom companies” had in 1999. They are a warning
      sign, but do not forget that the rally tends to survive
      longer than you think…
In 1999, the stock market was driven by a bonanza in tech
during the so-called Dot-com bubble. It was clear that if you
pressed in .com in the company name, you could raise capital
without major problems. Most companies are forgotten
today except maybe Yahoo and the like. But the telecom
companies that were included are still there, such as Akamai,
Cisco, Ericsson, Nokia etc., but there the shine has faded.

Above is the Ericsson share price development between 1995
and 2002.
A market logic that dates to the 1990s is the belief in total
market dominance. In Silicon Valley, pretty much all that
counts is size. Unicorn such as Uber and Airbnb have almost
unlimited access to capital to create a dominant market
position. One of the business logics that exists in the United
States, but not at all in the same way in Europe, is to inflate
the venture capital companies with so much money that they
can force the established players to their knees. Take for
example, Tesla, which is bleeding heavily but despite this and
questionable quality, has become a benchmark for an entire
industry.

1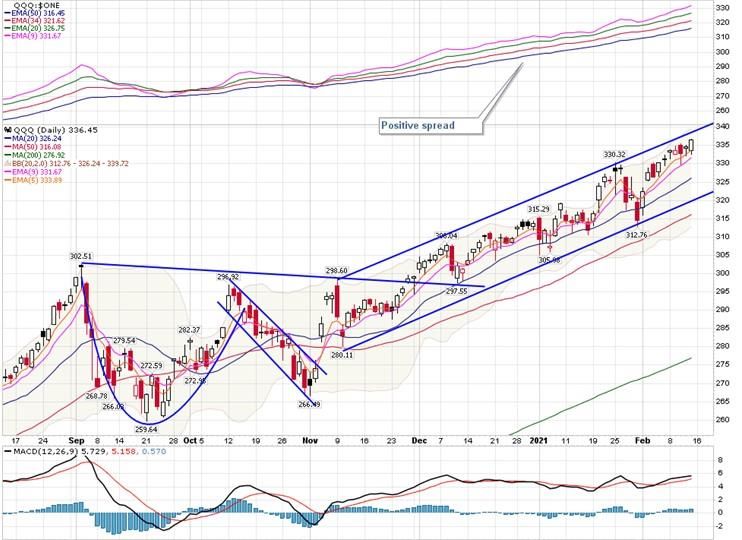
The market is resembling the 1999 rally- focus on SPAC and
crypto
Today, it is SPAC and crypto companies that are the new hot
things.

Above is an ETF that reflects SPAC which is probably the best
input if you do not want to go into the large flora of individual
SPACs.
SPACs are driven by the availability of liquid funds. Central
banks are increasingly pushing for liquidity, which was also
the case during the latter part of the 1990s. Instead of
tightening, the Fed chief Alan Greenspan left the taps open. It
is the same school that governs the Fed today as it is
ideologically a straight line from Greenspan to Ben Bernanke
and current Finance minister Janet Yellen and Fed Chairman
Jerome Powell.
As we wrote in last weekly letter, there is more and more talk
about YCC, which should be interpreted as yield curve
control. The central banks can control the short-term interest
rate in the market today. This is done by setting this interest
rate and checking that everything bought and sold in the
market adheres to this interest rate. Now that speculation
about rising inflation is picking up, long-term interest rates
are starting to rise. These cannot be controlled by the central
banks today. The purpose of the YCC is to take power of this
market as well. To control even long-term interest rates,
central banks must buy so many bonds that they control this
market. This mean additional capital injections.

2
The market is resembling the 1999 rally- focus on SPAC and
crypto
SPAC is the poor man´s path to venture capital companies.
There are few investment companies that have succeeded in
building their operations around companies that are in the
early stages. These forms of business work better on mature
companies that have achieved proper cash flows.
SPAC are companies that are capitalized to make rapid
investments in start-up companies. By forming a blank check
company and selling shares to the public for usually 10 USD
per share, the SPAC sponsor, as the founder is called, can
promise to use the sums to merge with a private company
and thus place the company on the stock exchange.
The sponsors between SPACs range from reputable investors,
business leaders or sports stars who have created a large
network they can use when rising capital or finding a private
company. Among the most famous names is Bill Ackman, who
through his SPAC Pershing Square Tontine Holdings, has
raised four billion USD, but has not yet announced which
company he plans to take to the stock market. SoftBank
Investment Advisers, which manages the well-known “100 b
USD fund”, is another giant that sponsors a SPAC.
SoftBank is a good example of the net working effect that can
be used by SPAC sponsors to find a private company to take
to the stock market. This is because their SPAC may be
merged with one of their own private portfolio companies.
Sport stars and celebrities, such as Shaquille O´Neal and Billy
Beane, are other examples of people associated with SPACs.
SPACs have been around as a tool to go public since a number
of years. They were on the rise in a similar way in the years
leading up to the 2007 financial crisis. But in 2020, SPACs
have returned even stronger than before, much due to
Chamath Palihapitiya. As one of the biggest proponents of
SPACs, Chamath is of the opinion that it is important to bring
more young, high-growth and R&D-heavy companies public,
in order to shift the focus of the capital markets from current
cash flow generation to future growth. With the IPO 2.0-
platform, as he calls it, Palihapitiya hopes that the capital
markets will shift its focus more on future and long-term

3
The market is resembling the 1999 rally- focus on SPAC and
crypto
growth, resulting in more R&D and innovation that can also
be participated in by retail investors.
In 2019 and 2020, Palihapitiya has taken a total of six SPACs
public through Social Capital Hedosophia, a collaboration
between his Social Capital and Hedosophia’s Ian Osborne. His
first SPAC, previous ticker IPOA, merged with Richard
Branson’s Virgin Galactic in 2019. It has since the merger
become one of the highest profiled SPACs. It has developed
from a share price of USD 10 to around USD 50, driven by the
hopes of future growth and a large total addressable future
market. Another company, Palihapitiya, which has gone
public is Opendoor Technologies, a successful merger this far.
His SPACs IPOD and IPOF are still seeking a target to take
public. Palihapitiya hopes to complete this SPAC-platform by
taking companies from IPOA-IPOZ public, in other words
“IPO” followed by every letter of the alphabet.
For a private company, it is easier to get to the stock market
through a SPAC. They face fewer regulatory obstacles and
there is thus greater certainty that the process will be
completed. This makes many people think that the trend is
here to stay, but it can also go wrong. The company Nikola´s
journey to and on the stock exchange is an example that is
usually mentioned in the context when the company´s share
price and confidence, just a few months after its SPAC entry
on the stock exchange, collapsed. This was due to short-term
seller’s analysis of the company that questioned the validity
of the company´s claims about their hydrogen-powered
vehicles. Some believe that if Nikola had been admitted to
the stock exchange through a traditional IPO process, the
company would also have been subject to a much stricter
investigation and audit process. Especially since at that time
the company had not yet manufactured a single product.
Nikola is perhaps the most well-known example, but there
are more cases in existance where retail-investors have over-
paid for a SPAC and then lost money . This has been due to
the sponsor not being able to deliver an exciting enough
company or that an announced merger does not complete at
all. One such example is TGI Fridays, that was supposed to go
4
The market is resembling the 1999 rally- focus on SPAC and
crypto
public through a SPAC, but where the process was terminated
due to COVID-19 and internal discoveries.
You should be aware that a SPAC means that you buy into a
black box. So far, most SPACs have lifted, but one day they
will have to show that they can turn their cash into profit-
making business.
The market for SPACs is growing enormously, so 2021 is
expected to be a record year.

But the crypto trend continues as well. More and more
investment banks are adding crypto to the group of
investments in which funds can invest, creating underlying
demand. It is so large that it lifts a whole group of different
types of companies.

SOS is a crypto company focused on rescue services. But
when we read about it, it feels more like a mining company.
5
The market is resembling the 1999 rally- focus on SPAC and
crypto
https://investorplace.com/2021/02/sos-stock-why-
blockchain-play-sos-limited-is-up-big-today/
For crypto companies, see also MARA and RIOT.
You can never tell when bubbles are bursting. In any case, the
lesson from the dotcom bubble was that it usually lasts for
several years longer than most people could imagine.

The Q4 2020 reporting season in the US
During the past week, another 80 S&P500 companies
reported their Q4 2020 results, which means that 75 percent
of the companies have reported. The outcome is still good
with 82 percent better than the earnings forecast, while 77
percent of the reports have been in terms of revenue.
Technology continues to the best sector with 94 percent of
the reports on the right side of the expectation line, followed
by the financial sector with 88 percent and industrial
companies with 83 percent. The health care sector has
slipped to only 77 percent better results than expected.
                                      Profit, in relation to      Revenues, in relation to
                                       expectations (%)              expectations (%)

S&P500 Universe        Reported    Better    In line    Below   Better    In line     Below
All Sectors (504)      376 / 504    82%        3%         15%    77%        0%         23%

Energy (24)              13 / 24    69%        0%         31%    77%                   23%

Basic Materials (26)     20 / 26    80%        0%         20%    75%                   25%

Industrials (72)         63 / 72    83%        2%         16%    75%                   25%
Consumer Cyclicals
                                    82%        0%         18%    73%                   27%
(79)                     49 / 79
Consumer Non-
                                    81%        0%         19%    81%                   19%
Cyclicals (40)           32 / 40
Financials (60)          59 / 60    88%        3%         8%     80%                   20%

Healthcare (60)          48 / 60    77%        2%         21%    85%                   15%

Technology (85)          65 / 85    94%        0%         6%     86%                   14%

Utilities (28)            7 / 28    71%       29%         0%     14%                   86%

Real Estate (30)         20 / 30    55%       20%         25%    45%                   55%
Source:
Reuters/Carlsquare

6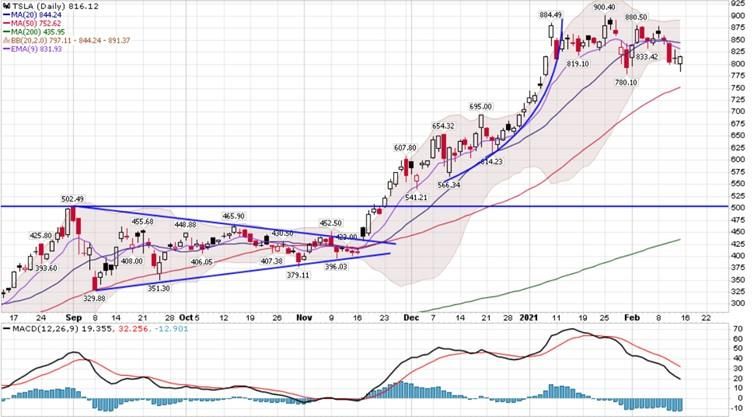
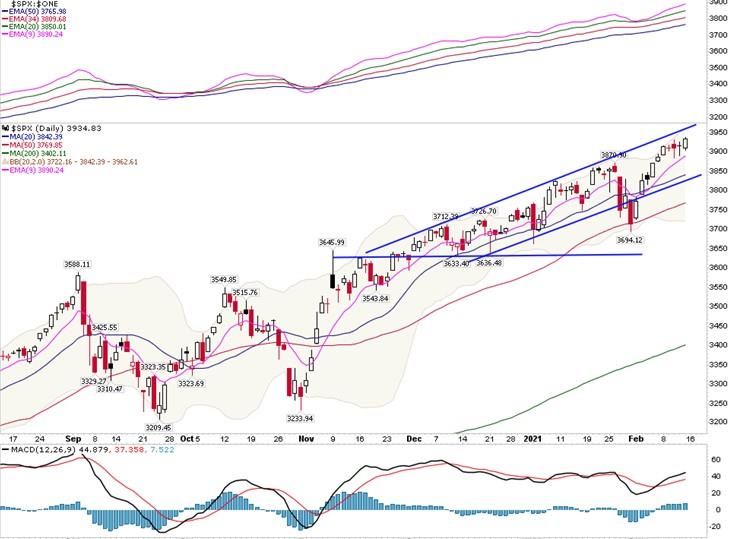
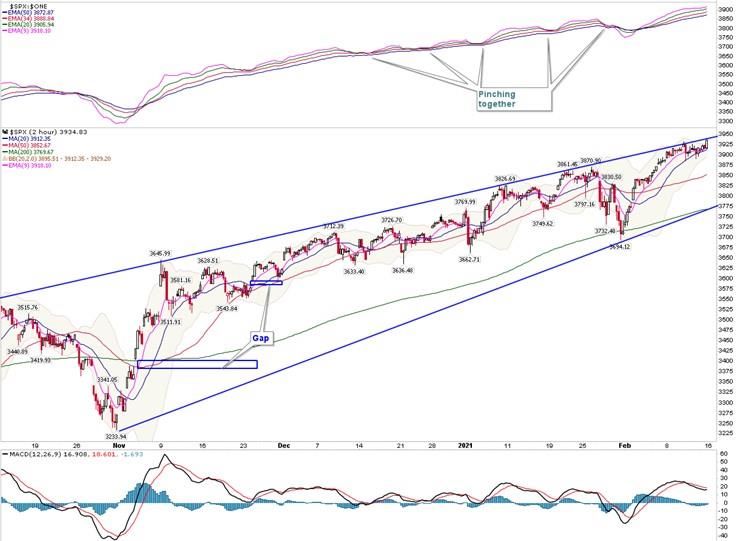
The market is resembling the 1999 rally- focus on SPAC and
crypto

Momentum

The market continues to rise as if the world will open shortly
following Covid-19. The S&P500 index continues to rise in its
channel.

The S&P500 index continues in a rising channel.

7
The market is resembling the 1999 rally- focus on SPAC and
crypto

Nasdaq continues to rise in an extending rising trend channel.

In the daily graph, it has some more height.

8
The market is resembling the 1999 rally- focus on SPAC and
crypto

The FANG companies are leading the rise.

But FANG as a group has broken down. Google is leading the
rise. Historically, it has paid off to buy the laggards of the
group.

There is virtually no difference between the world stock
market indices from this perspective.

9
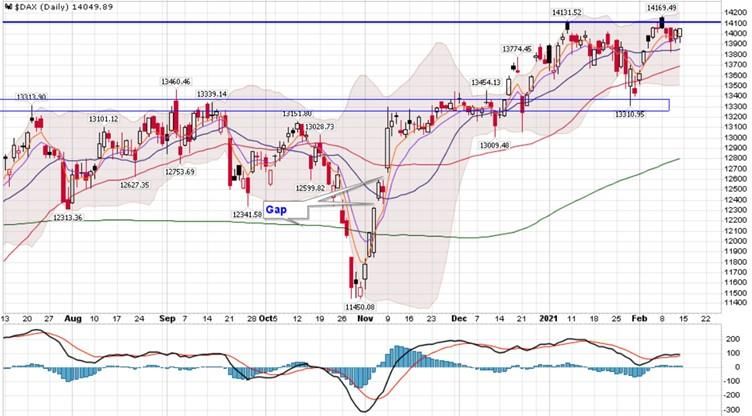
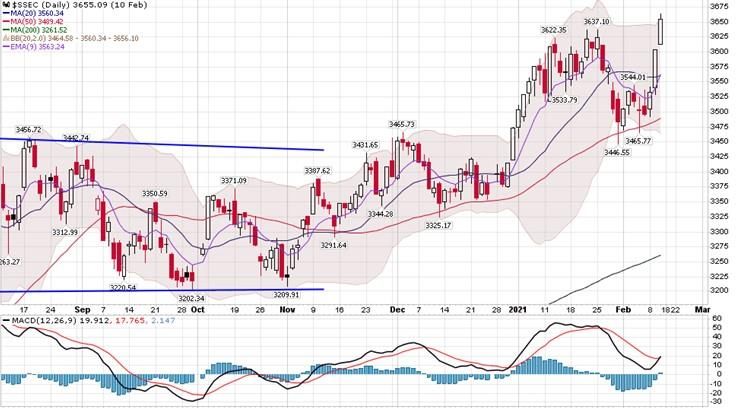
The market is resembling the 1999 rally- focus on SPAC and
crypto

The German DAX index has created two black dojis, but it is
possible to read a reverse head-and-shoulder formation if the
index manages to break the massive line of resistance.

Note how the Shanghai Stock Exchange is now catching up
following China´s weekend last week.

10
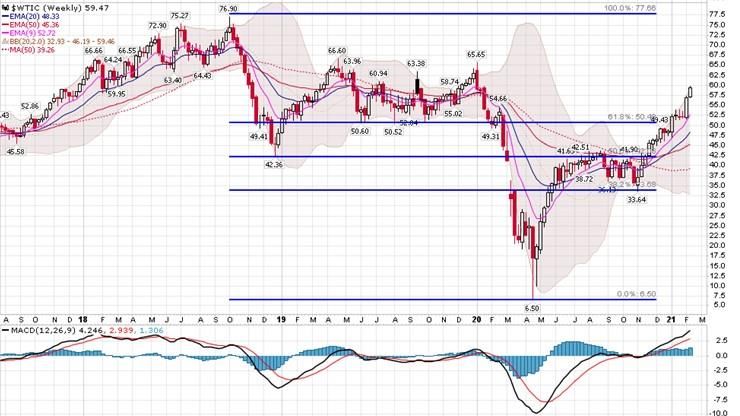
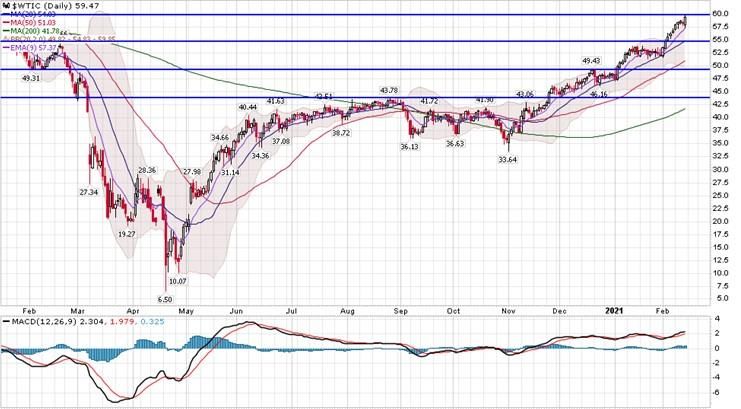
The market is resembling the 1999 rally- focus on SPAC and
crypto
The oil price (WTI) is attracting continued great interest and
has reached the psychological target price of USD 60 per
barrel. Severe cold over the USA creates higher demand at
the same time as the cold means that part of the domestic
production is shut down. The oil-producing state of Texas has
been hit by a cold snap that has prompted President Biden to
declare a state of emergency.

The weekly graph shows that there are plenty of old peaks
around 65 USD per barrel. It is the closest natural break if the
trend continues.

Energy companies in general have been big winners recently.

11
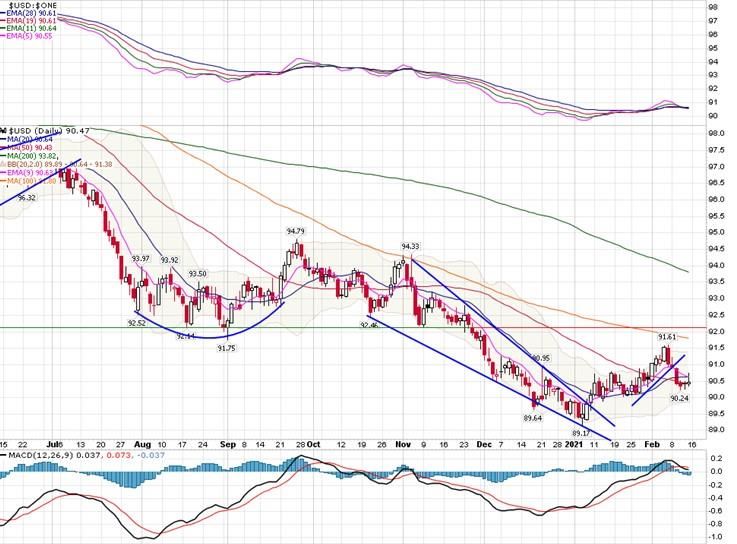
The market is resembling the 1999 rally- focus on SPAC and
crypto

One caveat is that the Tesla stock is breaking down and
fighting at the 800 USD-line.

USD can almost be considered neutral as it has made a
slippery landing against MA50.

12
The market is resembling the 1999 rally- focus on SPAC and
crypto

The weekly calendar
Company reports on Tuesday: Fingerprint Cards, Wihlborgs,
Metso Outotec, Altria, BHP, Bridgestone, Glencore.
Today Tuesday, France’s unemployment for Q4 2020,
Statistics Sweden Industrial Stocks Q4 2020, GDP forecast for
the Eurozone in Q4 2020, Eurozone employment in Q4 2020
and Germany ZEW-index for February will be presented.
From the US, we get the Empire Manufacturing Index in
February, Redbook retail sales (weekly data) and Oil Stocks
(API) weekly statistics.
Company reports on Wednesday: Tieto Evry, Scandic Hotels,
Nibe, Klövern, Aker, Alma Media, Ahold, Twilio, British
American Tobacco, Architect Index AIA in the USA for
November (Assa Abloy), Car Sales in Western Europe in
January from Acea.
On Wednesday, the CPI and PPI in January will come from the
UK as well as the Eurozone Construction production in
December. From the US we get retail sales and PPI in January,
Redbook retail sales (weekly data), industrial production in
January, stocks of unsold goods in December, NAHB Housing
Market Index in February and a Fed protocol.
Company reports on Thursday: Hufvudstaden, Lundin Mining,
Kojamo, Citycon, Finnair, Golden Ocean, NEL, Barclays,
Walmart, Air France-KLM, Airbus, Applied Materials, Credit
Suisse, Daimler, Marathon Oil, Orange.
Thursday´s agenda begins with two news from Statistics
Sweden- CPI in January and new construction of housing in
Q4 2020. Then we get Initial Jobless Claims (weekly data)
from the US, import prices and housing construction both in
January and the Philadelphia Fed Index in February. We will
also receive consumer confidence in February from the
Eurozone, Oil Stocks (DOE) weekly data and an ECB minutes
from the policy meeting on 21 January.

13
The market is resembling the 1999 rally- focus on SPAC and
crypto
Company reports on Friday: Catena, NP3, Leroy Seafood, REC
Silicon, BW Offshore, Avance Gas, Allianz, Deere, Natwest
Group.
Friday´s macro agenda is quite extensive from Europe, where
the most important will be the industrial purchasing
manager’s index for February from Germany, France, and the
Eurozone. But also, the current accounts in December from
the Eurozone and the Swedish Riksbank’s minutes from the
meeting on 9 February. CBI Industrial Trends and the
Purchasing Managers’ Index in February from the UK will be
presented. From the USA, we will receive the Markit
Purchasing Manager Index in February and the sale of existing
homes in January. Finally, there is a G7 summit.

14
The market is resembling the 1999 rally- focus on SPAC and
crypto

Valuation tables Swedish Companies

Lowest P/ E-ratio                              Highest yield
Company                       Price   P/ E12   Company                                 Price   Yield, %
Net Insight AB                 1,9     3,1     Resurs Holding AB                       44,4      11,4
Sagax AB                      31,4     4,8     Nordea Bank Abp                         71,7      9,2
Magnolia Bostad AB            64,8     5,5     Clas Ohlson AB                          74,6      8,4
BE Group AB                   43,7     6,6     Tele2 AB                                110,3     7,9
Hoist Finance AB              34,6     6,7     Skandinaviska Enskilda Banken AB        94,4      7,8
BioInvent International AB    51,4     7,5     Svenska Handelsbanken AB                96,5      7,7
Nelly Group AB                35,0     7,8     Swedbank AB                             149,6     7,3
Resurs Holding AB             44,4     8,3     SSAB AB                                 33,3      7,2
Corem Property Group AB       18,8     9,1     Nobina AB                               67,0      5,8
Intrum AB                     231,6    9,3     Byggmax Group AB                        51,6      5,8
Source: Reuters/ Carlsquare                    Source: Reuters/ Carlsquare

Lowest priced N AV                             Lowest priced N AV on debt-free basis
Company                       Price    PtB     Company                                 Price    EVtB
Oscar Properties Holding AB    0,2     0,08    Egetis Therapeutics AB                   6,9      0,87
Malmbergs Elektriska AB       56,8     0,16    Hufvudstaden AB                         125,3     0,91
Nelly Group AB                35,0     0,25    Fabege AB                               120,1     1,32
Midway Holding AB             15,0     0,32    Elos Medtech AB                         116,5     1,45
ITAB Shop Concept AB          26,0     0,36    Irras AB                                 7,2      1,47
Industrivarden AB             279,2    0,39    Medivir AB                               9,7      1,48
Sagax AB                      31,4     0,41    Bulten AB                               100,6     1,54
Concordia Maritime AB          7,8     0,47    SSAB AB                                 36,5      1,54
Empir Group AB                12,1     0,47    Svenska Cellulosa SCA AB                151,6     1,55
SERNEKE Group AB              50,2     0,53    Holmen AB                               380,0     1,57
Source: Reuters/ Carlsquare                    Source: Reuters/ Carlsquare

Lowest priced profit growth                    Highly priced profit growth
Company                       Price   PEG      Company                                 Price    PEG
Net Insight AB                 1,9    0,002    Axfood AB                               200,4     28,4
Duni AB                       100,2   0,005    Investor AB                             650,8     25,5
Hoist Finance AB              34,6    0,012    ICA Gruppen AB                          412,3     20,2
Magnolia Bostad AB            64,8     0,03    Holmen AB                               380,0     15,8
SSAB AB                       33,3     0,03    Inwido AB                               126,0     14,3
Africa Oil Corp                8,2     0,03    Saab AB                                 227,3     10,4
Corem Property Group AB       18,8     0,03    Sectra AB                               726,0     8,6
Haldex AB                     50,3     0,04    Dios Fastigheter AB                     72,5      8,4
BioInvent International AB    51,4     0,05    Swedish Orphan Biovitrum AB             164,6     7,7
Tethys Oil AB                 62,3     0,06    Castellum AB                            203,8     6,9
Source: Reuters/ Carlsquare                    Source: Reuters/ Carlsquare

15
The market is resembling the 1999 rally- focus on SPAC and
crypto
Disclaimer: The information in this presentation is based on what the publisher Carlsquare
considers to be reliable sources. However, we cannot not guarantee its content. Nothing
written in the presentation shall be considered as a recommendation or advice to invest in
any financial instrument, option, or the like. Opinions and conclusions expressed in the
presentation are intended for the recipient only. The content may not be copied,
reproduced, quoted, or distributed to any other person. Carlsquare shall not be liable for any
losses incurred by decisions made based on information in this presentation. Historical
returns should not be considered as an indication of future returns. Changes in foreign
currency can affect the value, price, or return on an investment made abroad or in a foreign
currency.
The Analysis does not address U.S. Persons (as this term is defined in Regulation S of the
United States Securities Act and interpreted in the United States Investment Companies Act
1940) and may not be disseminated to such persons. The Analysis is also not aimed at such
natural and legal persons where distribution of analysis to such persons would entail or
entail a risk of violation of Swedish or foreign law or the constitution.

16
You can also read