2018 Wells Fargo Healthcare Conference - September 5, 2018 Shawn Cavanagh Executive VP & COO - Cambrex
←
→
Page content transcription
If your browser does not render page correctly, please read the page content below

2018 Wells Fargo Healthcare
Conference
September 5, 2018

Shawn Cavanagh
Executive VP & COO
Forward-Looking Statements & Non-GAAP Financial Measures

           Statements in this presentation regarding the future financial and operating results, outlook, growth, prospects, business strategies,
 future market position, future operating environment and goals of Cambrex Corporation (the “Company”), including statements of expectation
 with respect to the acquisition of Halo Pharma (“Halo”) and expected benefits therefrom, consolidated or product category sales, EBITDA or
 Adjusted EBITDA, depreciation and amortization, capital expenditures, and the type of acquisitions, divestitures, collaborations, or other
 expansion opportunities the Company may consider, as well as any other statements that are not related to present facts or current conditions
 or that are not purely historical, constitute “forward-looking statements.” These forward-looking statements are based on the Company's
 historical performance and its plans, estimates and expectations as of the date of this presentation. The words “anticipates,” “estimates,”
 “believes,” “expects,” “may,” “plans,” “will” and similar expressions are intended to identify forward-looking statements, although not all forward-
 looking statements contain these identifying words. Forward-looking statements are not guarantees that the future results, plans, intentions or
 expectations expressed or implied by the Company will be achieved. Matters subject to forward-looking statements involve known and
 unknown risks and uncertainties that may cause actual results to be materially different than those expressed or implied by forward-looking
 statements. Important factors that could cause or contribute to such differences include: customer and product concentration, the Company’s
 ability to renew to win new customer contracts and renew existing contracts on favorable terms, pharmaceutical outsourcing trends, competitive
 pricing or product developments, government legislation and regulations (particularly environmental issues), the possibility that the conditions to
 closing the Halo Pharma transaction could not be met, that the closing could be delayed, or that the benefits from the acquisition may not be as
 anticipated, tax rates, interest rates, technology, manufacturing and legal issues, including the outcome of outstanding litigation, changes in
 foreign exchange rates, uncollectible receivables, the timing of orders, loss on disposition of assets, cancellation or delays in renewal of
 contracts, lack of suitable raw materials or packaging materials, the Company’s ability to receive regulatory approvals for its products and
 continued demand in the U.S. for late stage clinical products or the successful outcome of the Company’s investment in new products; and the
 other factors set forth in Part I, “Item 1A. Risk Factors” in the Company's most recent Annual Report on Form 10-K, as may be amended or
 updated in the Company's Quarterly Reports on Form 10-Q or subsequent filings with the SEC.

         Except as required by law, the Company specifically disclaims any obligation to update any forward-looking statements as a result of
 developments occurring after date of this presentation, even if its estimates change, and statements contained herein are not to be relied upon
 as representing the Company's views as of any date subsequent to the date of this presentation.

         EBITDA and Adjusted EBITDA are non-GAAP financial measures. The Company defines EBITDA as operating profit plus depreciation
 and amortization expense and Adjusted EBITDA excludes the impact of any potential acquisitions and restructuring activities. These financial
 non-GAAP measures also exclude the adoption of ASC 606. The reconciliation to the most directly comparable GAAP financial measure can
 be found in a table at the end of this presentation.

 © 2018 Cambrex Corporation. All rights reserved.                         2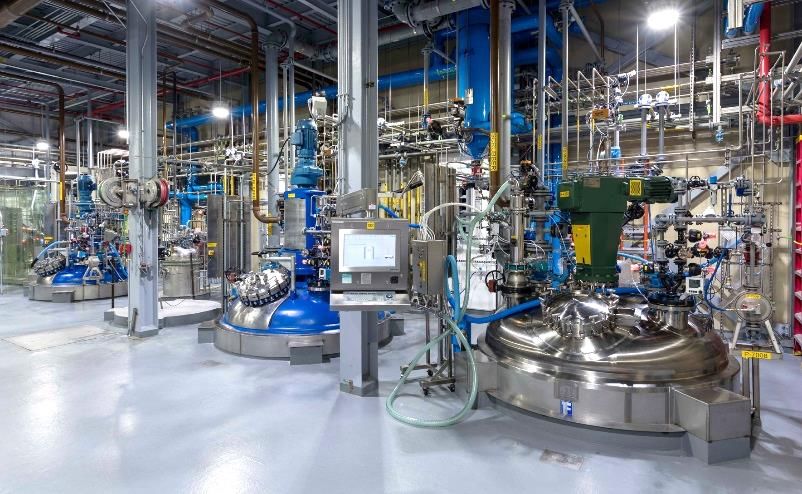
Investor Highlights
Extensive API portfolio of products in
Focused on the development and
3 categories manufacture of small molecule active
• Innovator, Generic APIs, Controlled
Substances
pharmaceutical ingredients (API) for the
innovator and generic pharmaceutical
• Over ~120 APIs and intermediates sold
annually to leading pharmaceutical
markets
companies
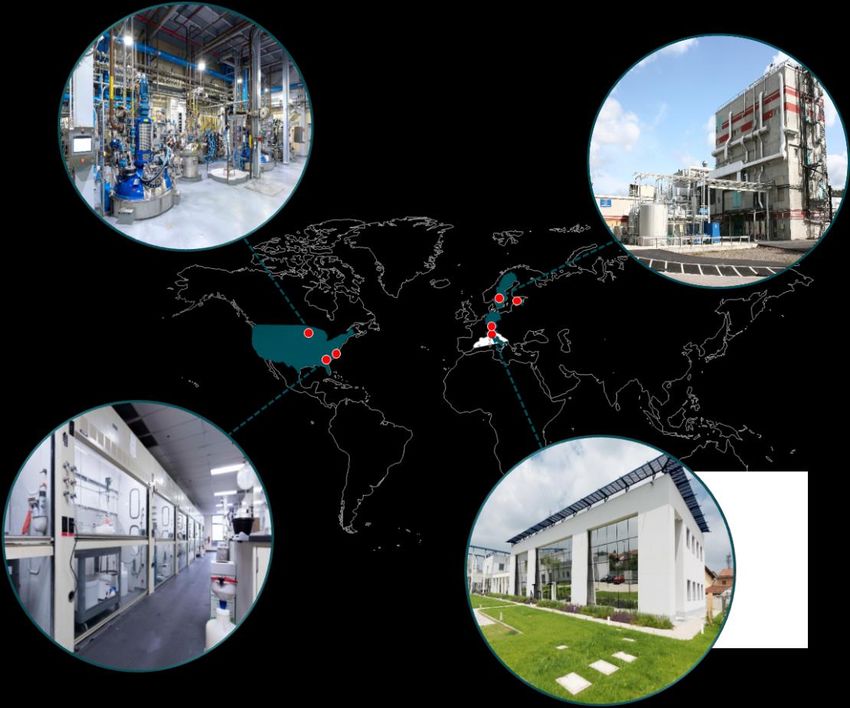
Charles City, Iowa
5 Year revenue CAGR of 14% High Point, North Carolina
Karlskoga, Sweden
• 2017 Net revenue grew 9% to $534.5 million Paullo, Italy
1 Tallinn, Estonia
and Adjusted EBITDA grew 13% to $174.6 Wiesbaden, Germany
million
6 operating sites within US and EU
• Flexible, large-scale manufacturing capacity,
with world-class quality systems and
excellent regulatory record (FDA, EMA, DEA)
• Wide range of capabilities
Entering Finished dosage segment of
CDMO market with Halo acquisition
• Leading dosage form custom development
and manufacturing organization
1. See Appendix
© 2018 Cambrex Corporation. All rights reserved. 3
Favorable Market Dynamics Drive Cambrex Growth

                                                                                                          Large, fragmented, growing,
  Robust funding
    environment                                                                     Increasing
                                                                                                          outsourcing market
 fueling preclinical                                                               outsourcing
       pipeline
                                                                                                                                     Small
                                        Growing number                                                                             Molecule
                                             of small                                                             API / F&F         API and
                                          molecules in                                                                             Fill/Finish
                                         clinical phases
                                                                                                                   Market            $100-
        Annual VC                                                                   Small Molecule
     Investment / $Bn                                                                Outsourcing                                     120B
                11.1         11.3                                                       Big Pharma
                       9.4                                                             plant closures                               Small
          7.4
4.8 5.1                                                                                                                            Molecule
                                                                                     Move from fixed to              API             API
                                       Small Molecule Pipeline                       variablized costs
2012 2013 2014 2015 2016 2017              (Phase I, II, III)                                                                       Market
                                                                        2,413         Access to CMO                                $50-60B
                                                        1,802
                                                                2,004
                                                                                       technologies                                (captive and
                                    1,626 1,599 1,659
                                                                                                                                    merchant)

                                                                                                                    CMO
                                     2012 2013 2014 2015 2016 2017              Limited CMOs with                                   Small
   Strong approval                                                                                                                 Molecule
                                                                                   capabilities,
    rates of small                                                                                                                   API
                                                                                capacity and scale
      molecules                                                                                                                     CMO
                                                                                                               50-60% Outsourced
                                                                                Preference for high                                $25-35B
    34 approved in                      Increased global                                                          5-8% Growth
                                                                                 quality Western-
        2017                             use of generics                           based assets
                                         pushing up API
                                            demand

  © 2018 Cambrex Corporation. All rights reserved.                                               4
Big Growth in the Small Molecule Pipeline
                                                                     NCE Small Molecules Under
Small molecules are big again                                         Development (2012-2017)
• Constitute approximately 2/3 of all              Phase          2012    2013    2014    2015    2016    2017 5 Yr CAGR 2 Yr CAGR
    drugs under development in                     Preclinical    2,462   2,473   2,351   2,786   3,175   3,427   6.8%     10.9%
                                                   Phase I         661     655     676     743     853     927    7.0%     11.7%
    pharmaceutical pipelines                       Phase II        761     742     771     830     866     905    3.5%      4.4%
• Increasing number of small molecules             Phase III
                                                   Pre-Reg
                                                                   204
                                                                   31
                                                                           202
                                                                            39
                                                                                   212
                                                                                    41
                                                                                           229
                                                                                           40
                                                                                                   285
                                                                                                    48
                                                                                                           311
                                                                                                            52
                                                                                                                  8.8%
                                                                                                                 10.9%
                                                                                                                           16.5%
                                                                                                                           14.0%
    in development:                                Registration     8       14      19     15       14      21   21.3%     18.3%
                                                   Pipeline Total 4,127   4,125   4,070   4,643   5,241   5,643   6.5%     10.2%
         •    ~5,600 at the end of 2017 (up
              7.7% from 2016)                                        NCE Small Molecules Moving
         •    ~2,100 in Phase I-III clinical                         Phase Per Year (2012-2017)
              development (up 6.9% from
              2016)
         •    Cambrex focuses on late-stage
              molecules of which there are
              ~380 (up 10.7% from 2016)
• Small molecules rapidly advancing into
    later stages of development:
         •    462 drugs moved from one stage
              to the next in 2017 (up 10.5%
              from 2016)

© 2018 Cambrex Corporation. All rights reserved.   5
Strong Revenue and Profit Growth
 • Revenue grew at 14% CAGR and Adjusted EBITDA1 grew at 25% CAGR between 2012 and 2017
 • 2018 Guidance for currency adjusted sales growth of +2 to -2% and EBITDA of $150-$160 million –
     reflected at mid-point in chart below
                                                                                                               Generics
                                                                                                               •   20% of 2017 Revenue
                                                                                                               •   Serving ~$9-13B market
                                                                                                               •   2018 Guidance*: Flat

                                                                                             Cambrex
                                                                                            Product Mix
                                                                                             Snapshot
                                                                   1

                                                               Innovator                                   Controlled Substances
                                                               • 66% of 2017 Revenue
                                                                                                           • 14% of 2017 Revenue
                                                               • Serving ~$16-22B market
                                                                                                           • Serving ~$350-400M market
                                                               • 2018 Guidance*: Up low single digits to
* Compared to 2017, excluding the impact of foreign currency                                               • 2018 Guidance*: Up mid single
                                                                 down low single digits % growth
and the impact of adopting the new revenue standards                                                         digit % growth
                                                               • Excluding largest product, revenue will
1. See Appendix                                                  be up mid to high teens % growth
     © 2018 Cambrex Corporation. All rights reserved.          6
Cambrex Provides Full Service Offerings at Each Stage of
                      Drug Development
                                                                         Drug Development                                           Commercialization
                                                  File IND                                                             File NDA

                                                                 Clinical             Clinical            Clinical                   Launch
                             Preclinical                                                                                                                 Maturity /
                                                                 Phase                Phase               Phase                      Phase
                            Development                                                                                                                  Generics
                                                                     I                   II                  III                       IV

                        High Point (US)
                        •    APIs and intermediates for early clinical phase
                        •    Controlled substance manufacturing (DEA Schedule II-V)
                        •    Continuous flow process development

                                                                             Charles City (US)
                                                                             •   Custom development and cGMP manufacturing
                                                                             •   High potency (HPAPI) capability down to OEL of
Innovator Market: Custom
                      Development and
                      Manufacturing

© 2018 Cambrex Corporation. All rights reserved.   8
Innovator Market – Overview and Key Trends
Large, fragmented, growing,                                   $25-35B Total CMO API Market

outsourcing market
                                                                           API

Clinical Phase (Custom Development)
• Most new innovator drugs originate in US and Europe
• Venture capital funding for emerging pharmaceutical                     CMO
     companies has driven growth in clinical phase
     pipeline
•    Phase I, II and III projects require cGMP facilities
                                                            Innovator (Patent-protected) Market
                                                                       $16-22B
Commercial Products (Custom Manufacturing)
• Ongoing rationalization of big pharma manufacturing
• Increasing outsourcing of intermediates and APIs to
     reliable, western-based CMOs
•    Periodic shortages of US CMO capacity, recent
     investments by Cambrex to meet rising demand
•    Small number of global players with world-class
     quality systems and ability to scale through
     commercial quantities

© 2018 Cambrex Corporation. All rights reserved.       9
Custom Development for Clinical Phase Projects
Goal is to generate a broad pipeline of commercial
products for custom manufacturing

Leader in providing range of services for clinical
phase projects
• Process and analytical chemistry, development and scale-up of
    manufacturing processes, supply of cGMP materials for clinical
    trials, process validations and CMC support for NDA approvals

Target late-stage clinical projects that match our
assets and capabilities
• Provides pipeline for custom manufacturing
• 17 active late-stage projects with focus on larger clinical
    projects

Early-stage opportunities to broaden the funnel
• Involved with 40-50 development projects per year ranging
  from investigational new drug (IND) support, pre-clinical and
  clinical Phase I and II
• Serves as feeder for late-stage clinical projects and seamless
  transfer to our large scale facilities

© 2018 Cambrex Corporation. All rights reserved.     10
Custom Manufacturing – Growth Initiatives
Currently produce 30-35 products
annually under medium-to-long-term
supply contracts (typically three to five
years)
Custom manufacturing growth
initiatives
• Currently produce 17 late-stage products;
plan to increase number of projects to 25
• Focus on larger volume late-stage clinical
projects better suited to our assets
© 2018 Cambrex Corporation. All rights reserved. 11Generics Market © 2018 Cambrex Corporation. All rights reserved. 12
Generic APIs – Overview and Key Trends
Large, fragmented, growing,                              $25-35B Total CMO API Market
outsourcing market
• Worldwide trend of increasing generic                              API
    penetration rates – generic usage still
    relatively low in many sizable markets
• Generic drug marketers outsource most of                           CMO
    their API volume
• API volumes will continue to increase with
    net global growth projected at mid-single           Generic (Patent-expired) Market
    digits                                                       $9-13Bn
• High level of FDA violations related to quality
    or regulatory issues with plants in low cost
    locations. Recent GDUFA legislation will
    augment funding to increase FDA inspections

• FDA initiatives continue to shorten review
    time and accelerate approval of ANDAs

© 2018 Cambrex Corporation. All rights reserved.   13
Generics continue to grow in developed markets
Generics in the US account for
90% of prescriptions
Generic Penetration / Volume (TRx)
• Generic adoption rates are
increasing across developed
markets
• US is the largest generic market
growing 8.8% CAGR and now
account for nearly 90% of
prescriptions and is projected to
rise to 92% by 2021 as more
medicines lose patent protection
• Generics will account for 31% of
total revenues in developed
markets by 2021 up from 28.8% in
2016 and 27.8% in 2011
© 2018 Cambrex Corporation. All rights reserved. 14Generic APIs – Focus on Niche Markets
Percentage of revenues from
• One of world’s largest products with 2017 sales
producers of generic >$5MM
APIs
33%
• Flexible manufacturing
facilities allow efficient 4 products
production of ~70
different APIs annually
• Niche markets are less
competitive
67% 61 products
Percentage of revenues from
products with 2017 salesGeneric APIs – Growth Initiatives
In addition to increasing our share of business with
our existing product portfolio, we…
Aggressively develop new products
• 12 APIs in development and several more under technical
and economic evaluation
• Target products utilizing biocatalysis technology platform
where we can create a cost advantage
• Apply differentiated technologies and capabilities, including
DEA controlled substances and highly potent compounds
Further penetrate generic market
• Qualify as an additional / secondary source supplier of API
to potential customers
• Leverage API position to capture more of the value chain
and expand into formulated generic drug product
Expand geographically
• Grow sales in high-growth markets where we already have
a presence (Brazil, Japan, Eastern Europe, etc.)
• Continue to develop partners in other new markets
(Russia, Mexico, Asia)
© 2018 Cambrex Corporation. All rights reserved. 16Controlled Substances © 2018 Cambrex Corporation. All rights reserved. 17
Controlled Substances – Limited Competition, Strong Growth
                                                            $600-700M US DEA Schedule II API Market
Heavily regulated market with restricted
competition
• Market entry controlled by DEA through
    licenses

• FDA and DEA oversight, including quota
    system

• Schedule I & II APIs require US manufacture –         Opioids API Market         Non-Opioids API Market
    no low-cost competition
                                                         $250-300M                    $350-400M
                                                          Growth -2.6%                 Growth +8.0%
Business Overview                                         CAGR 2013-2016               CAGR 2013-2016

• Cambrex currently participates primarily in
    large and growing non-opiate pain and ADHD
    markets

• Significant revenue growth in recent years
    driven by increasing market share with existing
    customers, new customers and new products

• One new Schedule II controlled substance in
    development
© 2018 Cambrex Corporation. All rights reserved.   18
Acquisition of Halo Pharma © 2018 Cambrex Corporation. All rights reserved. 19
Halo Pharma Overview
Leading dosage form custom development and manufacturing organization (CDMO)
providing Product Development (PD) and Commercial Manufacturing services to the
innovator and generic pharmaceutical markets
Broad dosage form manufacturing capabilities                                Key Stats
• Oral solids, liquids and sterile ointments and gels
• Specialty offerings include modified release, pediatric dosage forms    400+ approved
    and oral dissolving tablets, among others                                 SKUs

Focus on complex dosage forms
• Differentiated drug delivery, controlled substance and complex          100+ active PD
    formulation competencies
                                                                             projects

Integrated product development and manufacturing                             70+ active
• Product development business feeds clinical and long-cycle commercial      customers
    manufacturing

Diversified customer base with sticky products                            2 state of the art
• Includes large, specialty and generic pharma customers                      facilities
• Sole source supplier for > 80% of commercial customers
Efficient, 2 facility North American manufacturing network                ~450 employees
• Whippany, NJ              (167,000ft2)
                             and Mirabel, Québec   (234,000ft2)
• Strong regulatory history and capacity to fuel expansion
© 2018 Cambrex Corporation. All rights reserved.   20
Efficient Finished Dose Manufacturing Network
Whippany, New Jersey, USA Mirabel, Canada
• 167,000 ft2 (21 Acres) • 234,000 ft2 (23 Acres)
• Controlled substance manufacturing (DEA Schedule I-V) • Controlled substance manufacturing (DEA Schedule I-V)
• Large vault capacity for additional narcotics storage • Capabilities include analytical method development,
• Capabilities include analytical method development, formulation, transfers, release, microbiologic testing,
formulation, transfers, release, microbiologic testing, manufacturing and packaging
manufacturing and packaging
• Production Capacities: • Production Capacities:
o Solid Dose: 3 Billion Units o Solid Dose: 2 Billion Units
o Liquid: 500,000 Liters o Liquid: 12 Million Liters
o Suppository: 5 Million Units o Suppository: 100 Million Units
o Sterile Ointments: 200,000 KG o Semi Solids: 325,000 KG
o Bulk Powder: 1,500 KG
Capacity for growth and room for long term expansions
© 2018 Cambrex Corporation. All rights reserved. 21Strategic Rationale
Creates leading small molecule CDMO with broad range of capabilities
Expands addressable market and creates new avenue for growth within the large,
fragmented and growing market for outsourced finished dosage form contract
development and manufacturing
Diversifies business, expands customer base and broadens molecule funnel
Extends capabilities through addition of finished dose development and manufacturing
and provides a platform for adding new dosage forms in the future
Complements existing innovator, generic and controlled substance offerings
Adds efficient North American network with existing capacity for mid-term growth and
room for longer-term expansions
Opportunity to expand generic drug product initiative
Accretive transaction that accelerates growth
© 2018 Cambrex Corporation. All rights reserved. 22Transaction Overview
• $425 million total cash consideration
• To be funded with balance sheet cash and borrowings on $500
Consideration million senior credit facility
• Halo had Revenue and Adjusted EBITDA of $105 million* and $27
million, respectively for the 12 months ended 06/30/18
Financial • Enhances top-line revenue growth
Impact • Accretive to adjusted EPS in 2019
• Anticipate pro forma total net leverage at closing of 1.2x
• Expected to close in Q3 2018, subject to regulatory approvals and
customary closing conditions
Timing
• Updated 2018 guidance to be provided post-closing in conjunction
with Q3 2018 earnings release in early November
* Halo revenue is reported under ASC 605
© 2018 Cambrex Corporation. All rights reserved. 23M&A – Drive Growth
M&A Strategy
Evaluate all small molecule API acquisition opportunities
Small Molecule
• Synergistic products, technologies or capabilities API Consolidation
• Ability to enhance late clinical phase or already-commercial
project pipeline
Finished
• Increase access and grow customer base Dosage Form
• Development capabilities to support new product development
initiatives Early Discovery
& Development
Assess broader opportunities in outsourced market Services
sectors
• High quality businesses in the US or western Europe with
Biologics
differentiating capabilities
• Opportunity to generate growth synergies – new customers,
expanded services to existing customers
© 2018 Cambrex Corporation. All rights reserved. 24Market Trends and Growth Opportunities
Market Trends Cambrex Advantage
Strong growth in End-to-end supplier from early to late clinical
clinical pipeline phase and commercial manufacturing
Higher demand for Flexible, large-scale manufacturing
outsourced capacity in the US and Europe with
development and substantial capex investment over last 5
manufacturing years
Preference for
dependable US
World-class quality and regulatory systems
and European with excellent track record (FDA, EMA,
suppliers DEA)
Worldwide generic
prescription Growing pipeline of new generic APIs.
growth expected Increasing presence in key developing markets
to continue as
through local partners and direct customer
governments and
payors reduce relationships
costs
Strong growth Established relationships and supply
rates for certain positions with key marketers of US controlled
DEA Schedule II
DEA
substances
products
© 2018 Cambrex Corporation. All rights reserved. 25Cambrex Highlights Leading global Active Pharmaceutical Ingredient (API) manufacturer serving the innovator and generic pharmaceutical markets Extensive portfolio of products in 3 categories • Over ~120 APIs and intermediates sold annually 5 Year Revenue CAGR of 14% • 2017 Net revenue grew 9% to $534.5 million and Adjusted EBITDA1 grew 13% to $174.6 million • Currency-adjusted sales growth of +2 to -2% and Adjusted EBITDA of $150-$160 million expected for 2018 excluding the impact of adopting the new revenue standards Strategic initiatives and investment decisions match key positive market trends • 350-400 NCEs in late-stage clinical trials create over 2,000 API and advanced intermediate outsourcing opportunities • Growing clinical pipeline with strong late stage growth • Generic penetration continues to grow globally Strong balance sheet to allow financial capacity to execute acquisitions and invest internally Experienced management team with track record of success and creating shareholder value 1. See Appendix © 2018 Cambrex Corporation. All rights reserved. 26
Appendix

© 2018 Cambrex Corporation. All rights reserved.   27
EBITDA and Adjusted EBITDA Reconciliation

                                                     Reconciliation of GAAP to non-GAAP Results ($M)
                                                     2012         2013     2014     2015     2016     2017
Operating Profit                                     $35.7        $49.6    $52.3    $91.0   $128.4   $142.7
Depreciation and Amortization                         21.8         22.5     23.8     22.1     24.7     31.8
EBITDA                                               $57.5        $72.1    $76.1 $113.0     $153.0   $174.6
Loss on Voluntary Pension Settlement                    -           -        7.2      -        -        -
Gain on Sale of Asset                                   -          (4.7)    (1.2)     -        -        -
Restructuring Expenses                                  -           -        -       15.6      1.2      -

Adjusted EBITDA                                      $57.5        $67.4    $82.1 $128.6     $154.2   $174.6

  © 2018 Cambrex Corporation. All rights reserved.           28
2018 Wells Fargo Healthcare
Conference
September 5, 2018
© 2018 Cambrex Corporation. All rights reserved. 29You can also read