Roadshow Presentation - Zalando Corporate
←
→
Page content transcription
If your browser does not render page correctly, please read the page content below
Roadshow
Presentation
June 2021

     Roadshow Presentation Q1/21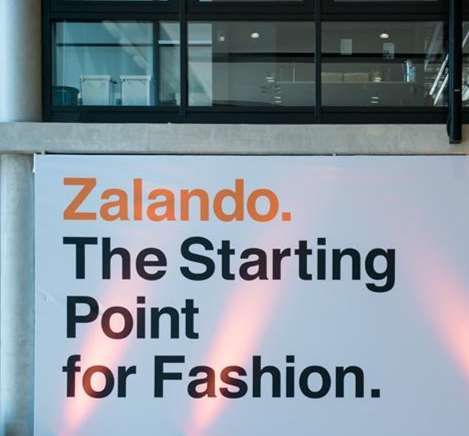
Agenda
                                  Investment highlights
                                  Bringing our growth ambitions to life
                                  Building a truly sustainable platform
                                  Creating long term value
                                  Q1/2021 Results

2   Roadshow Presentation Q1/21
Investment Highlights -
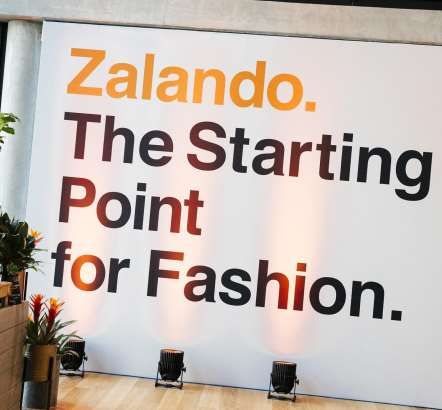
Zalando. The Starting Point for Fashion.
01 We have a clear vision and strategy and our number
one priority is growth
02 Over the last years we have made tremendous progress
and consistently delivered on our targets
The opportunity for Zalando is immense, making us
03 confident that we can reach >30bn EUR GMV by 2025
and capture >10% of the fashion market long-term
04 We continue to drive investments that will
catalyze long-term growth for our business
At scale, our platform strategy will result in an attractive
05 financial profile characterized by a double digit margin
and strong cash generation
3 Roadshow
Roadshow Presentation
Presentation Q1/21
FY/20
Our vision is to be the Starting Point for Fashion

We provide customers a distinct and compelling       … making Zalando THE app for fashion
fashion proposition …

          Most extensive assortment

          Seamless convenience

          Tailored digital experience

4   Roadshow Presentation FY/20
                          Q1/21
The most important building block of the Starting Point vision is to transition towards
a true platform business model

                                                        Customer benefits

                                                            ●   Desirable and
                                                                comprehensive
                                                                assortment

                                                            ●   High availability

                 Zalando benefits                                        Partner benefits

           ●    Platform adds scale to                            ●     Direct access to European
                Zalando                                                 digital consumer

           ●    Less inventory risk – while                       ●     Leverage Zalando
                improving customer                                      capabilities (tech, data,
                offering                                                logistics)

5       Roadshow
    Roadshow      Presentation
             Presentation Q1/21Q1/21
We have a strong and consistent growth track record, growing 4x in 6 years after IPO -
clear confirmation of our strategy

     Group GMV1 2014-2020, in bn EUR                                                                                                                           ~3% market share

                                                                                                                                                                                    Outgrew European online
                                                                                                                                                                                    fashion market by factor of 2-
                                                                                                                                                                                    3x2

                                                                                                                                                                                    Exceeded 10bn EUR GMV
                                                                                                                                               10.7                                 target set on CMD in 2017
                                                                                                                          8.2
                                                                                                     6.6
                                                                                5.5
                                                           4.4                                                                                                                      Remained consistently
                                     3.6                                                                                                                                            profitable with high re-invest
                2.7
                                                                                                                                                                                    into growth

               2014                  2015                 2016                 2017                  2018                 2019                  2020

1)    Gross Merchandise Volume (GMV) incl. VAT
2)    Source: Euromonitor International, February 2020. Values based on actuals and estimates; fixed exchange rates. Fashion data incl. apparel and footwear, bags and luggage, jewelry and watches.
      Data for Europe (excluding Russia) inclusive of sales tax

6           Roadshow
        Roadshow      Presentation
                 Presentation Q1/21Q1/21
We are confident that we can capture more than 10% of the total European fashion market
long-term by further executing on our vision and strategy

         The COVID-19 pandemic has accelerated
         change in the fashion industry that has long
         been in progress and blurred the
         boundaries between offline and online
                                                                                                                                                     Total fashion
                                                                                                                                                     >450bn EUR1
         Our platform strategy allows us to play an
         even bigger role in fashion for customers
         and partners
                                                                                                                                                                >10%

1)   Source: Company estimates and Euromonitor International forecasts, February 2020. Euromonitor forecasts the overall European Fashion Market to grow to roughly 450bn EUR over the next 5-10 years. Values
     based on actuals and estimates; fixed exchange rates. Fashion data incl. apparel and footwear, bags and luggage, jewelry and watches. Data for Europe (excluding Russia) inclusive of sales tax

7          Roadshow
       Roadshow      Presentation
                Presentation Q1/21Q1/21
We significantly upgrade our 2025 GMV ambition to more than 30bn EUR

                          GMV1 growth ambition 2025                                          Margin trajectory
                                  in bn EUR

                                                ~3x               >30

                                  ~2x                                           Primary focus is on capturing the immense
                                                                                           growth opportunity

                                                                               Coming years therefore marked by continued
                                                ~20                                      growth investments
                      ~11
                                                                             Long term double digit profitability ambitions are
                                                                                 unchanged, but on a higher level of scale
                      2020               Old 2023/24 target     New 2025
                                             CMD 2019            target

                                                              CAGR: 20-25%

1)   Gross Merchandise Volume (GMV) incl. VAT

8      RoadshowRoadshow   Presentation
                Presentation Q1/21     FY/20
Our long term profitability ambitions are unchanged, but on a higher level of scale by
transitioning to higher margin business and increasing economies of scale
Target Margin (growth in line with / slightly above online fashion market)
Partner Group margin impact
In % of revenue Wholesale1 Key Drivers
Business vs. 2020
● Transition to a Platform business model and
Gross margin economies of scale
Fulfillment costs ● Reversal of temporary return rate benefit and enhanced,
more sustainable convenience experience
● Starting Point Vision unfolds and share of existing
Marketing costs
customers increases
● Continued focus on overhead-efficiencies and
Admin expenses
economies of scale
● Transition to higher margin platform business and increasing
Adj. EBIT margin 6-8% 20-25% 10-13% economies of scale
1) Wholesale includes Offprice
9 Roadshow
Roadshow Presentation
Presentation Q1/21
FY/20Agenda
Investment highlights
Bringing our growth ambitions to life
Building a truly sustainable platform
Creating long term value
Q1/2021 Results
10 Roadshow
Roadshow Presentation
Presentation Q1/21Q1/21To bring our growth ambition to life, we follow clear strategic priorities
Increase penetration in existing Innovate the way we engage with Build a platform that is relevant for
markets and expand to new markets our customers all our partners
in Europe
Customer choice
Population penetration1
(active customers as % of total population)
+1.4x since
2018
Enabling Partner Connected
Top 5 Wholesale
markets
~21% Direct-to- assortment
Program Retail
assortment assortment
Consumer
All +1.5x since
~10%
markets 2018
Direct-to-Consumer
Bottom
5 ~6% +1.7x since
markets 2018
Driving
internationalisation
ZFS < 50% of GMV
ZFS > 50% of GMV
Connecting
to consumers
1) Excl. UK & Ireland
11 Roadshow
Roadshow Presentation
Presentation Q1/21Q1/21We have substantial leeway to grow active customers in existing markets and will expand
our footprint to reach even more customers
Increasing penetration in existing markets Expanding footprint in Europe
Population penetration1 Market footprint
(active customers as % of total population)
+1.4x since
2018
Top 5
~21%
markets ~100m in population
not yet addressed
Expanding to 8 further markets
All +1.5x since
starting mid 2021
~10% 2018
markets
Existing markets
Bottom 5 +1.7x since To be launched 2021
~6%
markets 2018 To be launched 2022
Increasing our overall penetration to the level already achieved in We want to be the Starting Point for Fashion
top 5 markets would double our active customers1 across Europe
1) Source: Statista, February 2021. Excluding UK & Ireland
12 Roadshow
Roadshow Presentation
Presentation Q1/21Q1/21We are a truly European fashion platform
and have reached key milestones in 2020
>50% of GMV generated outside of
DACH
Exceeded 1bn EUR in GMV in the
Nordics
Generated highest active customer
growth in Southern Europe
13 Roadshow
Roadshow Presentation
Presentation Q1/21Q1/21We innovate and improve the customer experience along two dimensions
Improving the Elevating distinct
core (fashion) experience customer propositions
Endless choice Pre-Owned
Beauty
Seamless convenience
Zalando Lounge
Designer
Zalando Plus
Tailored digital experience
And more.
14 Roadshow Presentation
Roadshow Q1/21FY/20
PresentationAs a result, our customer base is growing, visiting us more often and happier than
ever with our experience
Active customers Site visits1 Customer satisfaction
(Zalando Fashion Store NPS)
+46% +72%
5.4bn 2020
38.7m
26.4m 3.1bn
63
All time
high
2018 2020 2018 2020
1) Based on the change in consent management following the privacy
15 Roadshow Presentation
Roadshow Q1/21FY/20
presentation
requirements, part of the data is estimated on a statistical methodWe are building a platform that provides a scalable solution for brands, retailers and
stores and thereby allows us to serve an increasing number of active customers...
Enabling Direct-to-Consumer Driving internationalisation Connecting to consumers
ZFS > 50% of sold items in PP
Customer choice ZFS < 50% of sold items in PP
Wholesale Partner Connected
assortment Program Retail
assortment assortment
Direct-to-Consumer
Long-term target: 50% GMV share from Long-term target: ~75% of Partner Long-term target: 3-4% GMV share
Partner Program & Connected Retail Program items shipped by ZFS from ZMS
16 Roadshow
Roadshow Presentation
Presentation Q1/21Q1/21Over the past the two years, we achieved important milestones in driving the Platform
Transition
Progress towards our target model
FY 2020 in Germany
2018 Q4 2020 Q4 Target model 34%
Partner Program, 40% Partner Program
incl. Connected 10% 24% share of Fashion Store
Retail GMV1
Zalando
75% ZFS share of
Fulfillment 25% 51%
Partner Program items2
Solutions
Zalando
FY 2020 3-4% ZMS revenue of
Marketing 0.7% 1.5%
1.2% GMV2
Services
1) Partner Program share of 40% refers to our business model mix ambition for 2023/24. In our long-term target model, we aim for a 50% Partner Program share
2) Refers to our long-term target model ambition
17 Roadshow
Roadshow Presentation
Presentation Q1/21Q1/21Agenda
Investment highlights
Bringing our growth ambitions to life
Building a truly sustainable platform
Creating long term results
Q1/2021 Results
18 Roadshow
Roadshow Presentation
Presentation Q1/21Q1/21We are drastically reducing our own emissions and will work with our partners
to do the same
Our own operations (Scope 1+2)
Tons of CO2 from own operations
-64% -80%
As of 2019, we offset all
remaining emissions, making us
carbon neutral in our own
operations, deliveries & returns
2017 2020 2025 target
Our supply chain (Scope 3)
Our Science Based Target:
Zalando commits that 90% of our suppliers
Our aspiration: will have set Science Based Targets by 2025
We are carbon neutral in our own operations
and aim for a 1.5°C pathway
in line with the Paris Agreement
19 Roadshow
Roadshow Presentation
Presentation Q1/21Q1/21We encourage brands to produce and customers to choose more sustainable products
GMV from more sustainable products3
% of total GMV
25%
Upgraded
Increased more
sustainable
16% assortment to
1.7bn EUR
in GMV 80k products
7% Raising the bar
on eligibility
Our aspiration:
We enable customers to make
criteria
more sustainable choices
20191 20202 2023 target2
1) Zalando Fashion Store, after returns
2) Zalando Group, after returns
3) Products carrying the sustainability flag. Does not include Pre-Owned
20 Roadshow
Roadshow Presentation
Presentation Q1/21Q1/21On our path towards having a net-positive impact, we will continue to shape new
business models and expand into circular systems
Products are designed for
Products are collected for
circularity and last longer, or
recycling or other end-of-
consist of recycled and/or
use technologies
recyclable materials
Products are re-used and Products are used for as long
their lives extended as possible within original
Our aspiration: intended purpose (through
We move the fashion industry restyling, care, or repair)
from linear to circular
21 Roadshow
Roadshow Presentation
Presentation Q1/21Q1/21Agenda
Investment highlights
Bringing our growth ambitions to life
Building a truly sustainable platform
Creating long term value
Q1/2021 Results
22 Roadshow
Roadshow Presentation
Presentation Q1/21Q1/21We aim to triple our business to more than 30bn EUR GMV over the next 5 years
GMV Growth Ambition 2025 Revenue Growth Ambition 2025
in bn EUR in bn EUR
>30
~3x ~2.5x
~50%
Partner
~2x share1 ~1.6x
~20
~40%
Partner
share1
~20
~13
~11 ~8
2020 Old 2023/24 target New 2025 2020 Old 2023/24 Target New 2025
CMD 2019 Target CMD 2019 Target
CAGR: 20-25% CAGR: ~20%
1) Partner Program Share in % of Fashion Store GMV
23 Roadshow
Roadshow Presentation
Presentation Q1/21
FY/20New mid-term guidance until 2025 reflects continued strong and profitable growth
2019 Guidance
New Guidance New Guidance for
Transition Phase
2021 2022 – 2025
2019 – 2021
Continue to grow
2-3x faster than
20-25% 27-32% 20-25%
GROWTH online market
(GMV) growth
3-6% (Re-)invest
Starting in lower half platform benefits
2-4% 3.5-4.1% in 2022 and and economies
PROFITABILITY
approaching high end of scale to drive
(ADJ. EBIT)
by 2025 growth
Enable growth
● Cash flow negative ● FCF neutral ● FCF neutral
through
● NWC neutral ● NWC negative ● NWC negative investments in
● Capex of 4-5% of ● Capex of 3.5-3.9% ● Capex of 3.5-4.5% technology and
CASH GENERATION
revenue of revenue of revenue
infrastructure
24 Roadshow
Roadshow Presentation
Presentation Q1/21
FY/20We have the necessary infrastructure and capabilities to support our 2025 ambition
Payments Platform Access to
Fashion Supply
● Powerful inhouse Payments Platform
● Unique ability to access global fashion
equipped with e-Money license
supply via three sources: own Wholesale
● Processing payment volume of ~20bn inventory, Partner Program brand & retailer
EUR in 2020 for all customers and partners inventory, Connected Retail store inventory
● Proprietary Buy Now Pay Later solution ● Enabling broad selection and high
with >70% Offering Rate across 11 countries availability while sharing inventory risk
driving conversion and customer satisfaction with partners
Highly
scalable
Technology & European
Data Platform Logistics Network
● Unique European logistics network
with 10 sites across 5 countries
● Highly scalable proprietary cloud based
● Adding 2 new fulfillment centers
technology platform covering the whole
in Madrid, Spain, and Rotterdam,
value chain of fashion commerce – for us
the Netherlands, in 2021
and our partners
● 12 warehouses can fulfill ~14bn EUR GMV,
● Unique data infrastructure and state of
plan to invest 1bn EUR Capex to build 7
the art AI expertise that drive data based
more and enable 23bn EUR Zalando fulfilled
value creation (e.g. size & fit)
GMV.
25 Roadshow
Roadshow Presentation
Presentation Q1/21Q1/21Platform model to drive higher long-term profitability at scale
Zalando Zalando
Partner
Program CR Connected
Retail ZFS Fulfillment Marketing
Solutions Services
● Curated Marketplace enabling ● Digital Storefront for ● Flexible and cost-efficient ● Data infused marketing
brands’ direct-to-consumer Offline Retailers with turnkey solution for service to elevate
Value Proposition Nationwide Reach
business across Europe European E-Commerce branding and drive sales
logistics on and off premise
~75% of Partner Program
Long-term Target ~50% of GMV1 ~3-4% of GMV
Items Shipped
Current Status ~51% of Partner Program
~24% of GMV ~1.5% of GMV
(Q4 2020) Items Shipped
Revenue Model 5-25% Commission in % of GMV Cost Plus Model Auction Model
Gross Margin Impact
(vs. Group 2020)
1) Partner Program Share in % of Fashion Store GMV
26 Roadshow
Roadshow Presentation
Presentation Q1/21
FY/20Agenda
Investment highlights
Bringing our growth ambitions to life
Building a truly sustainable platform
Creating long term value
Q1/2021 Results
27 Roadshow
Roadshow Presentation
Presentation Q1/21Q1/212021 is off to a great start as we delivered exceptional growth and made fast strides on our
journey towards being the Starting Point for Fashion
Growing our Customer Base: Surpassed 40m active customers in Q1, driven by exceptional
new customer growth.
Building Great Customer Experiences: Expanded pre-owned fashion experience internationally,
enabled more sustainable choices and enhanced our Plus program.
Expanding our European Logistics Network: Adding 5 new fulfillment centers to our network by
2023 to serve our customers even better and to enable continued strong growth.
Exceptional Q1 financial performance: Delivered GMV growth of +55.6% YoY and strong
profitability with adj. EBIT margin of 4.2%.
Upgraded full-year 2021 outlook: GMV growth of 31-36%, Revenue growth of 26-31% and adj.
EBIT of 400-475m EUR.
28 Roadshow Presentation Q1/21We continue to innovate the way we engage with our customers by launching a number of
exciting new experiences
Introduced Pre-Owned Launched New Value Based Enhanced Experience for our
in Seven New Markets Browsing Experience Zalando Plus Customers
Pre-Owned:
14 out of 17
markets
● More customers can now enjoy the most ● Customers are now able to filter our vast selection ● Plus customers get early access to limited product
convenient Pre-owned fashion experience in Europe by different sustainability causes launches ahead of anyone else
● Enables customers to trade in and buy Pre-owned ● New experience allows customers to make more ● Provides brands with an exciting new tool to target
fashion with the same seamless Zalando experience informed choices based on values they care about our best customers with their most exciting offers
29 Roadshow Presentation Q1/21To serve our customers even better, we will expand our European logistics network by adding
five new fulfillment centers by 2023
Key Focus Areas Zalando European Logistics Network
● Offer even more customers faster
and more convenient deliveries New Fulfillment
Center in Germany
New Fulfillment
Center in Poland
● Provide customers with more
New Fulfillment
sustainable logistics services
Center in France
Zalando Fulfilled GMV Capacity
● Enable our long term growth ambition ~23bn+
by providing sufficient capacity ~18bn
~14bn
7+ new FCs
● Continue to drive cost efficiency 10 open sites
to come
through tailored automation 2 to go live in 2021 2022 2023 2025
2022-2025
3 to go live in 2023
30 Roadshow Presentation Q1/21In Q1, we delivered the strongest topline performance since IPO, fueled by a strong momentum
in Germany on the back of an outstanding performance of our Partner Business
Revenue1 – Group (Q1) Fashion Store – DACH (Q1)
(in €m and %) (in €m and %)
Fashion Store
Offprice GMV
Other² 921 +54.6%
664
2,238 GMV
+55.6%
Q1/20 Q1/21
1,524¹
Fashion Store – Rest of Europe (Q1)
(in €m and %)
GMV
1,088 +52.7%
728
Q1/20 Q1/21
Q1/20 Q1/21
1) Q1/21 (Q1/20) contains -€148.0m (-€89.6m) reconciliation. Fashion Store DACH contains -€68.9m (-€43.7m) and Fashion Store RoE contains -€65.6m (-€37.6m).
2) Other segments includes various emerging businesses
31 Roadshow Presentation Q1/21All our key customer metrics showed significant improvements
Active customers
(in #m) Average orders
per active 4.7 4.9
customer
(LTM in #)
Q1/20 Q1/21
Average basket 57.9
size after returns1 56.3
41.8
(LTM in €)
31.9 Q1/20 Q1/21
GMV per active
Q1/20 Q1/21 283.3
customer2 265.9
(LTM in €)
Q1/20 Q1/21
1) Defined as GMV divided by the number of orders, dynamically reported
2) Defined as GMV divided by the number of active customers; rounding differences may occur, dynamically reported
32 Roadshow Presentation Q1/21We delivered exceptional profitability in Q1 on the back of strong topline momentum and
continued tailwind from lower return rate
Adj. EBIT1,2 – Group (Q1) Fashion Store – DACH (Q1)
(in €m and %)
(in €m and %)
Fashion Store
Offprice
4.2% (1.7%) 9.0%
Other3 83
93 26
0.5% (6.5%) 4.2%
(12)
66 Q1/19 Q1/20 Q1/21
6 (99)
8
8 26
4
(7) Fashion Store – Rest of Europe (Q1)
(6)
0 (in €m and %)
(100) (2.8%) (1.6%)
(12.1%)
(18) (17)
(88)
Q1/19 Q1/20 Q1/21 Q1/19 Q1/20 Q1/21
1) Q1/21 (Q1/20) contains €1.4m (€0.0m) reconciliation
2) Excluding share-based compensation (SBC) in Q1/21 (Q1/20 ) of 14.8 €m (14.5€m)
3) Other segment includes various emerging businesses
33 Roadshow Presentation Q1/21The increase in profitability was primarily driven by healthy gross margin improvement and
lower return rates
Costs and margins Q1
(in % of revenue) 2019 2020 2021 YoY Delta
Cost of sales (60.1%) (64.7%) (59.2%) (5.5pp) Strong sell-through
000
and one-off inventory
write-down in Q1/20
Gross profit 39.9% 35.3% 40.8% 5.5pp
Lower return rates and
Fulfillment costs (28.7%) (29.9%) (25.5%) (4.4pp) high network utilization
Marketing costs (7.0%) (8.1%) (7.7%) (0.4pp)
Administrative expenses
(5.4%) (4.7%) (4.0%) (0.7pp)
& Other
EBIT (1.3)% (7.4%) 3.5% 10.9pp
Adj. EBIT1 0.5% (6.5%) 4.2% 10.7pp
1) Excluding equity-settled share-based payment expense (“SBC”), restructuring costs and non-operating one-time effects
34 Roadshow Presentation Q1/21Upgraded FY/21 Outlook
Old FY/21 Guidance New FY/21 Guidance
GMV growth of 27 – 32%, and Revenue growth GMV growth of 31 – 36%, and Revenue growth
of 24 – 29% of 26 – 31%
Adj. EBIT1 of €350 – 425m Adj. EBIT1 of €400 – 475m
Negative net working capital and Negative net working capital and
€350 – 400m in Capex2 €350 – 400m in Capex2
1) Excluding equity-settled share-based payment expense (“SBC”) of ~€65m vs previously communicated ~€57m, restructuring costs and non-operating one-time effects for FY/21
2) Excludes M&A transactions
35 Roadshow Presentation Q1/21Appendix
Management Board
The Zalando Share
Zalando Investor Relations Team
36 Roadshow
Roadshow Presentation
Presentation Q1/21Q1/21Management responsibilities following the Annual General Meeting
Robert Gentz David Schneider Astrid Arndt Jim Freeman David Schröder
Co-CEO Co-CEO Chief People Officer Chief Business and Chief Financial Officer
Product Officer
37 Roadshow
Roadshow Presentation
Presentation Q1/21Q1/21The Zalando Share
Shareholder structure1,2 Share information1
Ordinary bearer shares
Treasury shares. 0.7% Type of Shares
with no-par value (Stückaktien)
Kinnevik AB (publ): 20.71% Stock Exchange Frankfurt Stock Exchange
Market Segment Regulated Market (Prime Standard)
Index Listings MDAX, STOXX600, FTSE4Goods
First day of trading October 1, 2014
Issue price EUR 21.50
Total Number of
Shares Outstanding 260,939,349
Anders Holch Povlsen 9.83% Issued Share capital EUR 260,939,349
Other shareholders (free float) 68.76%
38 Roadshow Presentation
Roadshow Q1/21FY/20Presentation Q1/21
Roadshow
presentationZalando Investor Relations Team
Patrick Kofler Dorothee Schultz
Head of IR Junior Manager IR
Patrick.Kofler@zalando.de Dorothee.Schultz@zalando.de
Team Contact
T: +49 3020 9681 584
Zalando Tamara-Danz-Straße 1
Nils Pöppinghaus Jan Edelmann 10243 Berlin
Senior Manager IR Manager IR
investor.relations@zalando.de
Nils.Poeppinghaus@zalando.de Jan.Edelmann@zalando.de https://corporate.zalando.com/en
39 Roadshow Presentation
Roadshow Q1/21FY/20Presentation Q1/21
Roadshow
presentationUpcoming events
Date Event All events
are virtual
Friday, May 7-12 Roadshow different locations
Tuesday, May 11 Fireside Chat with our CFO David Schröder (Bernstein)
Wednesday, May 19 Annual General Meeting, Berlin
Friday, May 20 Morgan Stanley Virtual Internet Field Trip
Monday, June 7 Deutsche Bank Global Consumer Conference, Paris
Tuesday, June 8 Berenberg Innovation Conference, London
Tue - Wed, June 8-9 Erste Bank Conference, Warsaw
Tuesday, June 15 Barclays Internet Conference, London
Wed-Thu. June 16-17 dbAccess Berlin Conference 2021, Berlin
Friday, June 18 Goldman Sachs Inaugural Digital Economy Conference, London
Thursday, July 1 Unicredit Convertible Bond Conference
Thursday, August 5 Q2/2021 Results
40 Roadshow Presentation
Roadshow Q1/21FY/20Presentation Q1/21
Roadshow
presentationDisclaimer
Certain statements in this communication may constitute forward
looking statements. These statements are based on assumptions
that are believed to be reasonable at the time they are made, and
are subject to significant risks and uncertainties.
You should not rely on these forward-looking statements as
predictions of future events and we undertake no obligation to
update or revise these statements.
Our actual results may differ materially and adversely from any
forward-looking statements discussed on this call due to a number
of factors, including without limitation, risks from macroeconomic
developments, external fraud, inefficient processes at fulfillment
centers, inaccurate personnel and capacity forecasts for fulfillment
centers, hazardous material / conditions in production with regard
to private labels, lack of innovation capabilities, inadequate data
security, lack of market knowledge, risk of strike and changes in
competition levels.
41 Roadshow Presentation
Roadshow
Roadshow Q1/21FY/20
Presentation
presentation Q1/21You can also read