Key events & developments in 2018 - CommSec
←
→
Page content transcription
If your browser does not render page correctly, please read the page content below
Economics | January 2 2019
Year in Review 2018; Year in Preview 2019
Key events & developments in 2018
The US-China trade dispute dominated investor attention over 2018. Other issues in focus over the
year included: Brexit; the US-Canada-Mexico trade negotiations and eventual deal; debate over
“neutral” interest rates in the US; rising, and then falling oil prices; personnel changes in the US White
House; US Mid-term elections; the shape of the US yield curve and implications for the economy;
Australian political instability; falls in Sydney and Melbourne home prices.
The global economy likely grew by 3.7 per cent in 2018, just above longer-term averages.
The Chinese economy softened under the weight of the tariff war with the US.
The US unemployment rate fell to a 49-year low of 3.7 per cent.
The US Federal Reserve lifted the federal funds rate from a range of 1.25-1.50 per cent to 2.25-2.50
per cent - the ninth increase in interest rates of the current monetary policy tightening cycle.
The Australian economy likely grew by 2.8 per cent over 2018, above the 2.6 per cent decade average.
National home prices fell by 4.8 per cent in 2018 after rising by 4.5 per cent in 2017. The decline in
national home prices has been driven by lower Sydney and Melbourne prices.
The Reserve Bank left the cash rate at 1.50 per cent over 2018.
The budget deficit continued to improve with the rolling annual deficit at $1,816 million in the year to
November (less than 0.2 per cent of GDP).
The Australian dollar eased from highs of US81.35 cents in January to US70.18 cents in October and
ended the year at 70.58 cents, down by 9.5 per cent.
The CRB futures commodity index declined by 12.4 per cent in 2018.
The Nymex oil price began the year at US$60.42 a barrel, hit highs of US76.90/barrel in October and hit
lows of US$42.53/barrel in December. The Nymex finished the year at US$45.41/barrel, down by
almost 25 per cent.
The Australian ASX 200 began the year at 6065.1 points; hit highs of 6373.5 in August; and bottomed
at 5467.6 in December. The ASX 200 was down 6.9 per cent over 2018 - its worst year since 2011.
The US Dow Jones index fell by 5.6 per cent over 2018 – its worst yearly performance since the Global
Financial Crisis. It was last at record highs on October 3.
Returns on Australian 10-year government bonds rose by 3.3 per cent in 2018.
Craig James – Chief Economist
(02) 9118 1806 (work); 0419 695 082 (mobile), | craig.james@cba.com.au; Twitter: @CommSec
Ryan Felsman – Senior Economist
(02) 9118 1805 (work); 0457 524 482 (mobile), | ryan.felsman@cba.com.au; Twitter: @CommSec
Produced by Commonwealth Research based on information available at the time of publishing. We believe that the information in this report is correct and any opinions, conclusions or
recommendations are reasonably held or made as at the time of its compilation, but no warranty is made as to accuracy, reliability or completeness. To the extent permitted by law, neither
Commonwealth Bank of Australia ABN 48 123 123 124 nor any of its subsidiaries accept liability to any person for loss or damage arising from the use of this report.
The report has been prepared without taking account of the objectives, financial situation or needs of any particular individual. For this reason, any individual should, before acting on the information
in this report, consider the appropriateness of the information, having regard to the individual’s objectives, financial situation and needs and, if necessary, seek appropriate professional advice. In the
case of certain securities Commonwealth Bank of Australia is or may be the only market maker.
This report is approved and distributed in Australia by Commonwealth Securities Limited ABN 60 067 254 399 a wholly owned but not guaranteed subsidiary of Commonwealth Bank of Australia.
This report is approved and distributed in the UK by Commonwealth Bank of Australia incorporated in Australia with limited liability. Registered in England No. BR250 and regulated in the UK by the
Financial Services Authority (FSA). This report does not purport to be a complete statement or summary. For the purpose of the FSA rules, this report and related services are not intended for
private customers and are not available to them.
Commonwealth Bank of Australia and its subsidiaries have effected or may effect transactions for their own account in any investments or related investments referred to in this report.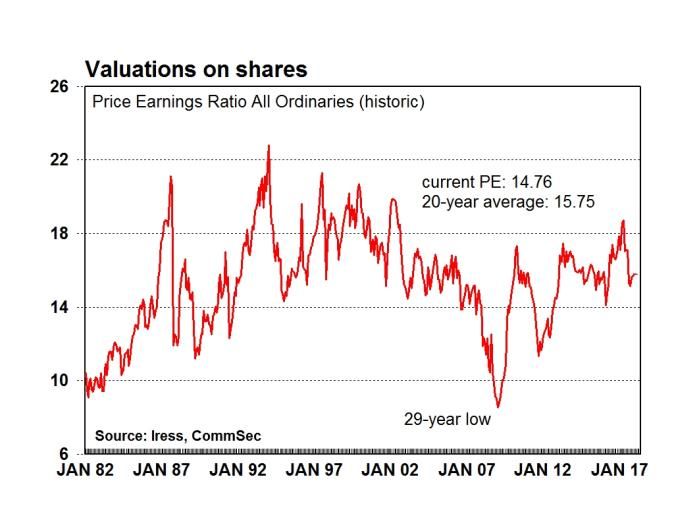
Economic Insights: Year in Review 2018; Year in Preview 2019
International
The International Monetary Fund currently expects the global economy to grow by 3.7 per cent in both
2018 and 2019, a similar outcome to 2017. The 30-year average is 3.6 per cent while the 50-year
average is around 3.7 per cent. The growth rates for 2018 and 2019 were both revised lower by 0.2
percentage points in October from the projections made in April 2018.
The IMF expects the US economy to slow from a three-year high of 2.9 per cent in 2018 to 2.5 per cent
in 2019. The US unemployment rate remains at a 49-year low of 3.7 per cent. But inflation remains low,
near 2 per cent, while wages were up by just 3.1 per cent over the year – the highest in 9 years.
Euro area growth is tipped at 2 per cent in 2018 and 1.9 per cent in 2019 although the European
Central Bank now tips 1.7 per cent growth. The IMF expects Japanese growth of 1.1 per cent in 2018
and 0.9 per cent in 2019.
The Chinese economy grew at a 6.5 per cent annual rate in the September quarter, down from 6.7 per
cent in the June quarter. It was the slowest annual growth rate in 9½ years.
The IMF expects that the Chinese economy grew by 6.6 per cent over the full 2018 year. And growth is
tipped to slow further to 6.2 per cent in 2019. In part the slowdown in growth reflects the maturation of
the economy and its transition from an “emerging” nation to an “advanced” economy. Chinese
economic growth still contributes accounts for around a third of total global growth.
Resolution of the US-China trade dispute is the key factor likely to influence global economic growth
over 2019. The other key issue is US monetary policy. A number of US recessions in recent decades
have occurred due to policy ‘mistakes’ – lifting interest rates too quickly or leaving rates too high in the
face of a weakening economy.
January 2 2019 2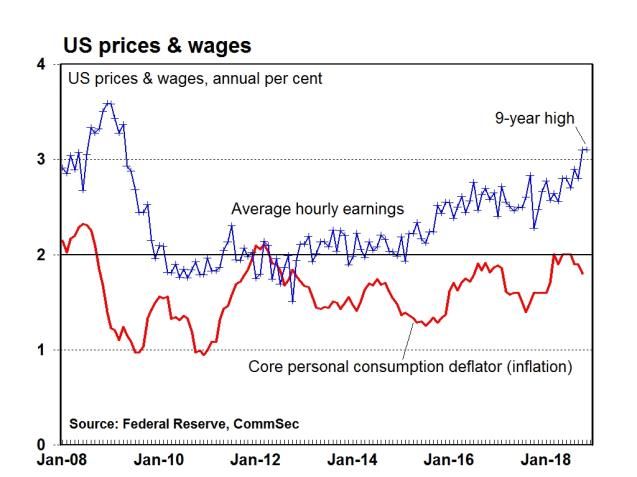
Economic Insights: Year in Review 2018; Year in Preview 2019
Australian economy
The Australian economy grew by 2.8 per cent for the year to September. Over 2018 as a whole, growth
is likely to be around 2.8 per cent, up from 2.4 per cent in 2017. Growth has averaged 2.6 per cent over
the decade and averaged 2.9 per cent over the last 15 years.
While employment has been strong, productivity growth is soft with a key measure up by just 0.4 per
cent over the year.
Business conditions remain good. The NAB business conditions index stood at +12.7 points in
November. The long-term average is +6.0 points. The rolling annual average business conditions index
was +16.1 points in November, modestly below the record high of +17.3 points in June. Profits are at
record highs. And the upgrade in investment plans in the September quarter was the biggest in 19
years.
Consumers remain positive. The Westpac/Melbourne Institute survey of consumer sentiment index
stood at 104.4 in December. The sentiment index is above its long-term average of 101.3. A reading
above 100 denotes optimism.
Consumers continue to spend. Retail trade rose by 3.6 per cent in the year to October, close to the 10-
year average of 3.7 per cent. In real terms, broader household consumption was up by 2.5 per cent in
real terms to the September quarter (decade average 2.6 per cent.)
The trade accounts are in surplus. In October the trade surplus was $2,316 million and the rolling
annual surplus rose from $13.69 billion to $15.29 billion – the highest level in 11 months. Annual
exports to China hit record highs of $112.2 billion in October, up 10.3 per cent over the year.
In the twelve months to November 2018, the Budget deficit stood at $1,816 million (less than 0.2 per
cent of GDP) and down from the $2,345 million deficit in the year to October. The rolling annual deficit
is the lowest for over 9½ years. Over the same 12-month period to November, the fiscal balance was in
surplus by $5.124 billion.
January 2 2019 3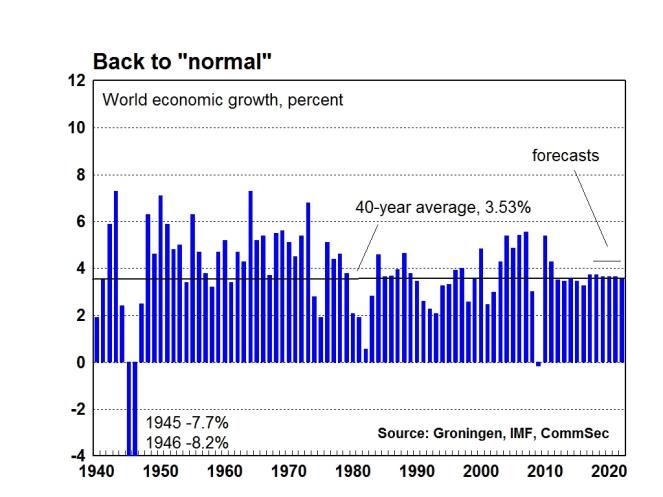
Economic Insights: Year in Review 2018; Year in Preview 2019
Inflation, jobs and wages
Inflation remains low. In the September quarter the annual rate of headline inflation eased from 2.1 per
cent to 1.9 per cent. Over the past decade inflation has averaged 2.18 per cent – the lowest decade-
average inflation result since September quarter 1967.
“Underlying” inflation is also low on an annual basis. The average of the weighted median and trimmed
mean measures stands at 1.75 per cent.
Wage growth is slowly lifting. The wage price index rose by 0.6 per cent in the September quarter.
Annual wage growth lifted from 2.1 per cent to a 3½-year high of 2.3 per cent. Including bonuses,
wages were up by 2.7 per cent on a year ago. But employers are preferring to modestly increase their
labour costs via alternatives to base pay, such as gym memberships and flexible working
arrangements.
The job market improved over the year. In trend terms the jobless rate fell to a 6½-year low of 5.1 per
cent in November.
Annual job growth currently stands at 2.3 per cent (decade average 1.6 per cent) with 285,800 jobs
created over the year to November. Hours worked lifted by 1.1 per cent. The monthly trend
underemployment rate fell to 3½-year lows of 8.4 per cent. The monthly trend underutilisation rate fell to
4½-year lows of 13.5 per cent. While an improvement, still-high underemployment (people wanting to
work more hours) and strong population growth suggest that there is still some spare capacity in the
labour market.
The NSW unemployment rate stood at 4.4 per cent in November while the Victorian jobless rate stood
at 4.6 per cent. Both jobless rates were near the lowest in a decade.
January 2 2019 4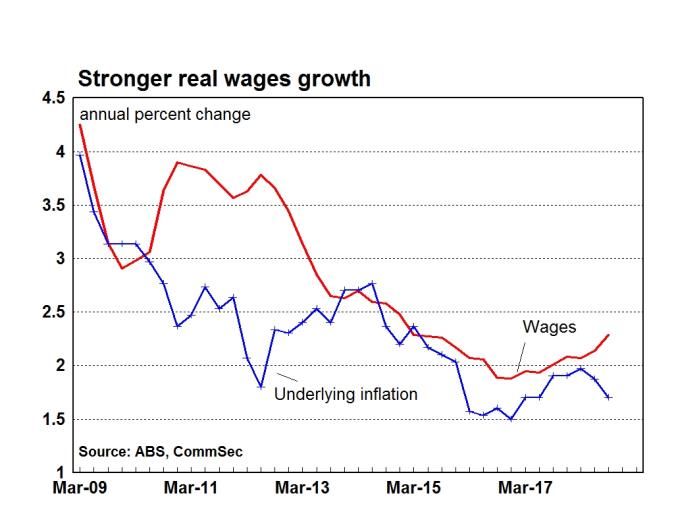
Economic Insights: Year in Review 2018; Year in Preview 2019
Housing
Home prices are easing, especially in Sydney and Melbourne, as the supply of homes lifts to meet the
level of demand. The CoreLogic Home Value Index of capital city home prices fell by 1.3 per cent in
December to stand 6.1 per cent lower over the year. The national home price index fell by 1.1 per cent
in the month to be down 4.8 per cent over the year – the worst annual decline in a decade.
In capital cities, house prices fell by 1.4 per cent in December and apartment prices fell by 1.1 per cent.
House prices were down 6.7 per cent on a year ago and apartments were down by 4.3 per cent.
Home prices were higher than a year ago in four of the eight capital cities in December. Prices
rose most in Hobart (up 8.7 per cent), followed by Canberra (up 3.3 per cent), Adelaide (up 1.3 per
cent) and Brisbane (up 0.2 per cent). But prices fell in Sydney (down by 8.9 per cent); Melbourne (down
7.0 per cent); Perth (down 4.7 per cent) and Darwin (down by 1.5 per cent).
Total returns on national dwellings fell by 1.2 per cent in the year to December with houses down by 1.8
per cent on a year earlier, but units were up 0.4 per cent.
In response to lower prices, demand for properties is rising, especially from first home buyers. The
number of loans (commitments) by home owners (owner-occupiers) rose by 2.2 per cent in October -
the largest gain in 15 months. And the proportion of first-time buyers in the home loan market rose from
18.0 per cent in September to 6-year highs of 18.1 per cent in October (decade-average 17.7 per cent).
Construction activity remains solid. In the year to September, construction work done was at record
highs in NSW, Victoria and South Australia. While engineering continues to ease with the easing in
mining work, Non-residential was up by 2.3 per cent on the year. Residential building was up by 5.4 per
cent over the year.
There is a record amount of private sector infrastructure projects under construction, a key factor that
will support economic activity over 2019.
January 2 2019 5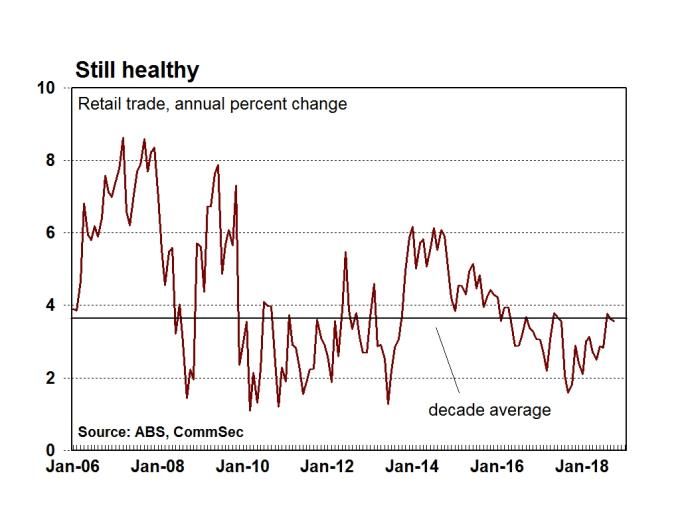
Economic Insights: Year in Review 2018; Year in Preview 2019
International financial markets
Over 2018, the US Federal Reserve lifted the federal funds rate from a range of 1.25-1.50 per cent to
2.25-2.50 per cent – the ninth increase in interest rates of the current monetary policy tightening cycle.
The gap between US 10-year yields and US 2-year yields (measure of the yield curve) was the flattest
since 2007, closing the year at 19 points. US 10-year yields stood at 2.69 per cent (up by 28 points)
with US 2-year yields up by 61 points to near US 2.50 per cent in 2018. The flat yield curve has caused
some investors to fret that a slowdown of the US economy may lie ahead or even a recession. But if
history is any guide, it takes on average 21 months for the economy to slow down significantly after the
curve inverts and 14 months for the US sharemarket to go into reverse.
But while short-term interest rates have lifted over time, it has to be remembered that they have lifted
from essentially zero. Longer-term bonds have been supported by global uncertainties such as the US-
China trade dispute as well as the low level of inflation. Inflation has remained remarkably contained
despite solid economic growth and tight job markets.
Global sharemarkets. The world index (MSCI – Morgan Stanley Capital International index) hit a
record high of 2,248.9 in late January. But by late December 2018 the world MSCI fell to 1,835.7. The
world index fell by 10.3 per cent over 2018.
Only 15 of 73 major sharemarkets posted gains over 2018 (Australia was 42nd). Amongst the best
was Ukraine (up 77.5 per cent). Among the worst was China (down 24.6 per cent).
In 2018, global sharemarkets recorded their worst annual performance since the Global Financial
Crisis. The US Dow Jones (down 5.6 per cent), S&P500 (down 6.5 per cent) and Nasdaq (down 3.9 per
cent) indexes all fell. In Europe, Germany’s Dax (down 18.3 per cent) and the UK FTSE (down 12.5 per
cent) bourses tumbled. In Asia, Japan’s Nikkei fell by 12.1 per cent and the Australian ASX200 index
was down 6.9 per cent – its worst year since 2011 – and the All Ordinaries fell by 7.4 per cent.
Global currencies weakened against the US dollar over 2018. Only nine of 120 currencies rose against
the greenback over the year (Australia 104th or 17th biggest decline.) Strongest was the Japanese yen
(up 3.3 per cent). The US dollar index ended 2018 near a 19-month high.
January 2 2019 6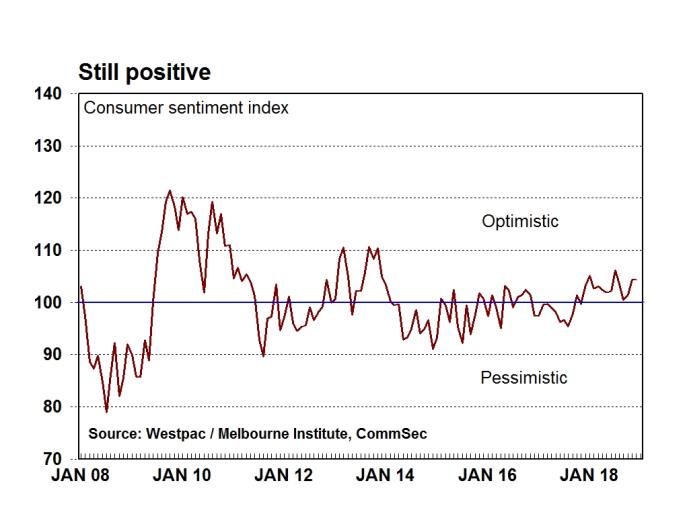
Economic Insights: Year in Review 2018; Year in Preview 2019
Commodity prices
The CRB futures commodity index declined by 12.4 per cent in 2018, more than the 9.5 per cent
decline in the Aussie dollar.
Commodities have been caught in the Sino-US trade crossfire, despite supply-demand fundamentals
remaining bright for late-cycle commodities like copper. While weakening global trade flows and
demand are headwinds, likely Chinese infrastructure stimulus could propel metals higher. US shale
remains the ‘wildcard’ for oil markets, despite OPEC attempts to stabilise the crude price.
Base metal prices eased over 2018 with the London Metal Exchange index down by 18 per cent – its
first annual decline in three years. Copper, aluminium, zinc and nickel fell between 16 and 26 percent.
Iron ore hit the year’s highs of US$79.95 a tonne in late February but softened with equities market
volatility over March and April. After again rallying to around US$77 a tonne in late October/ early
November, iron ore eased again late in the year. Iron ore finished 2018 at US$72.70 a tonne, down just
0.3 per cent on the year.
US Nymex crude began the year around US$60 a barrel. Over the first quarter, crude prices were
relatively settled, broadly holding US$60-65 a barrel. But prices motored to US$74 in the second
quarter and to near 4-year highs in early October. But since early October, crude oil prices slumped by
more than 40 per cent. Nymex ended the year at US$45.41 a barrel, down by almost 25 per cent.
Thermal coal prices remained firm over 2018 and were up 0.8 per cent. And the gold price held
between US$1,184-1,363 an ounce over 2018, although finishing the year down 1.8 per cent at
US$1281.30 an ounce.
Across rural commodities, wheat recorded one of the strongest gains in 2018, up by 19.8 per cent over
the year. Wool lifted 5.8 per cent over the year while cotton fell 9.8 per cent with the beef price down
3.7 per cent and sugar down 20.6 per cent.
January 2 2019 7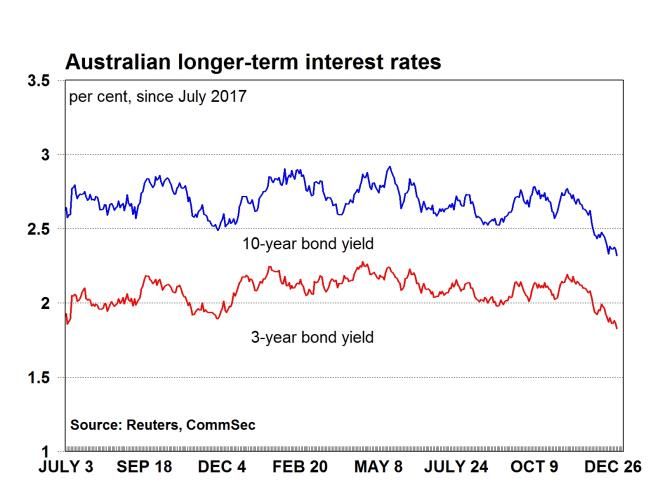
Economic Insights: Year in Review 2018; Year in Preview 2019
Interest rates & exchange rates
The Reserve Bank left the cash rate at 1.50 per cent over 2018. In fact the Reserve Bank hasn’t
changed the cash rate for 28 consecutive months. The last move was a rate cut in August 2016, with
the Reserve Bank cutting the cash rate from 1.75 per cent to a record low – an emergency level – of
1.50 per cent.
Ninety-day bank bill yields continue to hold above the 1.5 per cent cash rate. Ninety-day bills held
between 1.76-2.12 per cent over 2018 and yields are currently near 2.08 per cent – not far below 2-year
highs. Rising international interest rates have increased bank borrowing costs, pressuring margins and
resulting in out-of-cycle variable mortgage rate increases.
At the other end of the yield curve, 10-year bond yields held between 2.32-2.92 per cent over 2018.
Yields peaked in mid-May but eased in the latter months of 2018. Low inflation, weaker global equities
markets and on-going global uncertainties such as the US-China trade dispute have provided support
for safe-haven government bonds. Yields on 10-year bonds ended 2018 at the year’s lows, down 35
points or up 3.3 per cent.
The Australian dollar eased from highs of US81.35 cents in January to US70.18 cents in October and
ended the year at 70.58 cents, down by 9.5 per cent.
Over the year the Aussie tracked a range of just over 11 cents. While up from the 11-year low of 9.64
cents in 2017, it remained below the 30-year average of 13.7 cents.
While commodity prices eased over 2018, the major factor driving the Aussie dollar lower over the year
was rising US interest rates.
January 2 2019 8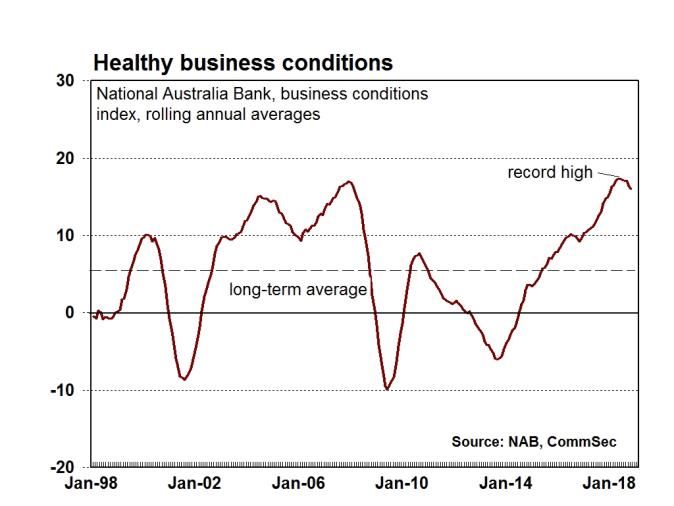
Economic Insights: Year in Review 2018; Year in Preview 2019
Australian shares, bonds, cash
The Australian ASX 200 began the year at 6065.1 points; hit highs of 6373.5 in August; and bottomed
at 5467.6 in December. The ASX 200 was down 6.9 per cent over 2018 - its worst year since 2011. The
broader All Ordinaries index fell by 7.4 per cent.
Total returns on Australian shares as judged by the All Ordinaries Accumulation index hit record highs
in late August but eased to 15-month lows in December. The accumulation index fell by 3.5 per cent
over 2018.
Returns on Australian government bonds rose by 3.3 per cent over 2008 while cash was 1.5 per cent
(with bank term deposits slightly higher).
The MSCI (Morgan Stanley Capital International index) for Australia in US dollar terms fell by 15.8 per
cent in 2018.
Only four of the 22 industry groups lifted over 2018: Pharmaceuticals, Biotech & Life Sciences (up 31.4
per cent); Software & services (up 5.5 per cent); Food, Beverages & tobacco (up 2.0 per cent) and
Food & staples retailing (up 1.1 per cent). The biggest fall was recorded by Household & Personal
Products (down 26.7 per cent); from Telecom (down 17.4 per cent); and Banks (down 15.5 per cent).
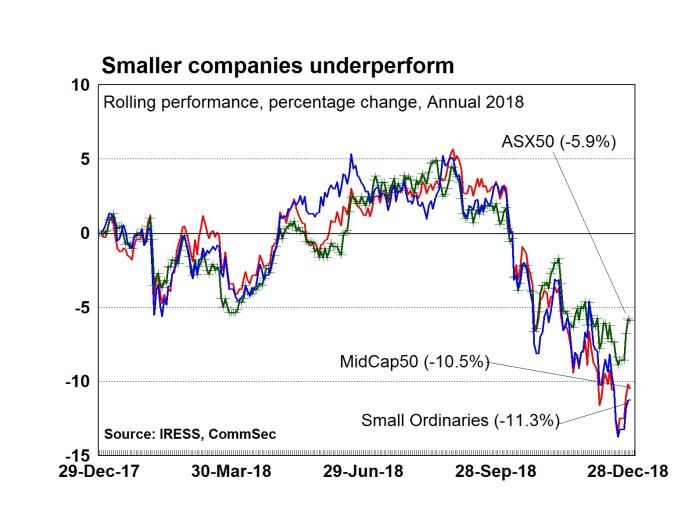
Larger companies out-performed. The ASX 50 index fell 5.9 per cent in 2018; from ASX 100 (down
6.5 percent); ASX 200 (down 6.9 per cent); MidCap 50 (down 10.5 per cent) and Small Ordinaries
(down 11.3 per cent).
Valuations. The historic price-earnings ratio stands at a 32-month low of 14.76, well down on the 5-
year average of 16.1 and decade average of 15.1. The average dividend yield stands at a 29-month
high of 4.31 per cent.
January 2 2019 9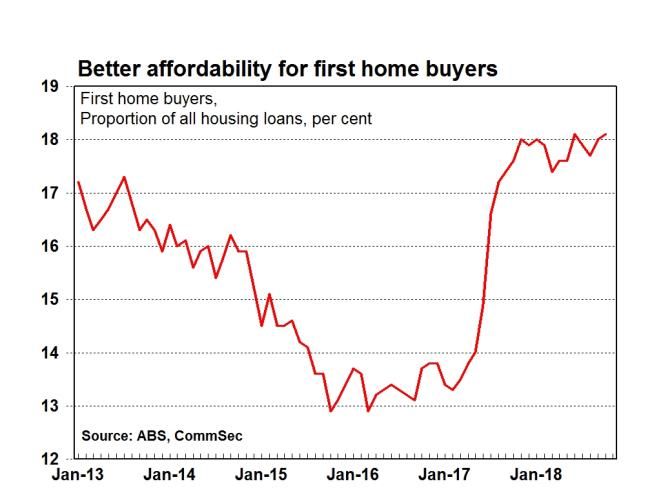
Economic Insights: Year in Review 2018; Year in Preview 2019
Outlook for 2019
Much is riding on the resolution of the US-China
trade dispute. Hopes are increasing after China
FORECASTS
2017/18 2018/19
removed its “Made in China 2025” technology-
Economic Growth 2.8% 3.00-3.50%
focused industrial policy from its local
Underlying inflation 1.9% 2.00-2.50%
government priority list for 2019. And China has Unemployment 5.3% 4.75-5.25%
reportedly proposed to reduce US auto tariffs mid 2019 end 2019
from 40 per cent to 15 per cent in 2019. Cash rate 1.50% 1.50-1.75%
Any forecasts for 2019 are contingent on the Sharemarket (All Ords ) 6,200-6,500 6,450-6,750
assumptions made for resolution of the dispute. Aust ralian dollar US73-80c US73-80c
We take the view that it is very much in the
interests for both countries to have the dispute resolved. And while it may take a little longer than the
March 1 data set for resolution, we believe enough progress will be made to provide optimism for
investors.
So sharemarkets are expected to be on the path of repair in 2019, especially in the second half of the
year. Firm economic growth rates will provide fundamental support. But slower earnings growth will
keep a focus on margins. Companies with pricing power will be tempted to lift prices while at the same
time seeking to constrain growth of expenses.
The Australian ASX 200 share index is expected to rebound by 10-12 per cent in 2019 after a decline
of around 6-8 per cent in 2018. Including dividends, total returns are tipped to lift by 14-17 per cent in
2019. While above-normal growth of total return on equities is expected, this must be seen in the
context of the below-normal performance in the latter part of 2018.
In addition, valuations on Aussie shares are well below historic averages while dividend yields are
above longer-term averages. Fear has been a key driver on global sharemarkets over 2018, especially
the last three months of the year. The hope is that investors return to focussing on ‘fundamentals’ or
earnings and economies in 2019.
The US Federal Reserve is expected to tread more
warily in lifting interest rates in 2019. While there may
still be 1-2 rate hikes over the year, they may be
focussed later in 2019 and dependent on a tighter job
market forcing up wages and prices. The European
Central Bank should start withdrawing stimulus as it
has previously indicated. But rate hikes are still some
way off.
The Chinese economy should grow by between 6.0-
6.5 per cent over 2019 with increased spending on
infrastructure to be a key driver of growth. Success in
supporting economic growth at the upper end of the
range will be pivotal in ensuring firm demand and
prices for industrial economies.
Technology and Globalisation will remain active
themes serving to constrain wage and price growth
across developed economies.
The OPEC+ nations (OPEC and its allies) will
continue to face challenges in trying to engineer an oil
price near US$55-60 a barrel. Output of North
American shale oil and oil sands will ensure that
global supplies remain healthy. Then there is the
competitive threat to gasoline from electric and
hydrogen-powered vehicles. And then there are the
vagaries of global economic growth, especially noting
the over-riding issue of the US-China trade dispute.
The Australian economy is in solid shape. While the
mountain of residential and commercial building
January 2 2019 10Economic Insights: Year in Review 2018; Year in Preview 2019
projects will be reduced over the year, there is a bevy
of infrastructure projects to underpin construction
activity and overall economic growth. Businesses are
also keen to invest. And rural and mining commodities
are expected to remain in strong demand, especially
through Asia.
Economic growth near 3 per cent, inflation near 2 per
cent, wage growth near 2.6 per cent and
unemployment near 4.75 per cent would be solid
outcomes for an economy well into its 28th consecutive
year of growth.
With the US Federal Reserve becoming more ‘data
dependent’ on lifting interest rates, the greenback may
ease against major currencies. And that is especially
the case if there are more compelling local
requirements to lift rates in other nations. We expect
the Aussie dollar to drift higher to the mid-70s against
the greenback over 2019.
Australian interest rates are tipped to remain on hold
over most of 2019. We agree with the Reserve Bank
that the next move in rates is more likely to be up. The
job market is tightening and wages are lifting.
As we noted above, infrastructure building, exports
and business investment are tipped to support growth
in 2019.
Fiscal stimulus is also possible over 2019 with the
Budget in good shape and an election likely to be held
by May.
But inflation is still contained. And wages can only sustainably lift if supported by firmer productivity
growth.
We currently expect the Reserve Bank to begin a “normalisation” task for interest rates in November.
Craig James, Chief Economist, CommSec: (02) 9118 1806; Mobile: 0419 695 082;
Ryan Felsman, Senior Economist, CommSec: (02) 9118 1805; Mobile: 0457 524 482
January 2 2019 11You can also read