The Neutral Rate of Interest - Federal Reserve Bank of Dallas
←
→
Page content transcription
If your browser does not render page correctly, please read the page content below
The Neutral Rate of Interest

                                         Robert S. Kaplan
                                             President and CEO
                                       Federal Reserve Bank of Dallas

                                                 October 24, 2018

     The views expressed are my own and do not necessarily reflect official positions of the Federal Reserve System.

  I would like to acknowledge the contributions of Tyler Atkinson, Jennifer Chamberlain, Daniel Crowley, Jim Dolmas,
Marc Giannoni, Everett Grant, James Hoard, Evan Koenig, Karel Mertens, Alex Richter, William Simmons, Kathy Thacker,
                                Joe Tracy and Mark Wynne in preparing these remarks.
The Neutral Rate of Interest
Robert S. Kaplan
In the September Federal Open Market Committee (FOMC) meeting, the Federal Reserve raised
the federal funds rate to a range of 2 to 2.25 percent. In our statement announcing the decision, we
ceased to include language that described the current stance of monetary policy as
“accommodative.”
I supported the most recent federal funds rate increase. In my recent speeches and essays, I have
been arguing that the Federal Reserve should be gradually and patiently raising the federal funds
rate until we get into the range of a “neutral stance.” Once we’ve reached that point, I intend to
assess the outlook for the U.S. economy and look at a broad range of factors before deciding what
further actions, if any, might then be appropriate.
One challenge in moving toward a neutral stance is the inherently imprecise and uncertain nature
of estimating what constitutes “neutral.” This judgment is more of an art than a science and
involves observing and analyzing a wide variety of factors. The uncertainty of this judgment is
complicated by the fact that 2018 U.S. gross domestic product (GDP) growth has been
substantially aided by sizable fiscal stimulus, whose impact is likely to fade somewhat in 2019 and
further in 2020.
The purpose of this essay is to explore a number of the key issues associated with using the neutral
rate concept in formulating monetary policy. In particular, I will discuss several of the challenges
associated with estimating this rate, describe limitations on the use of this concept, and explain
how it might best be used in debating and determining the appropriate path for the U.S. federal
funds rate.
What Is the Neutral Rate?
The neutral rate is the theoretical federal funds rate at which the stance of Federal Reserve
monetary policy is neither accommodative nor restrictive. It is the short-term real interest rate
consistent with the economy maintaining full employment with associated price stability.
You won’t find the neutral rate quoted on your computer screen or in the financial section of the
newspaper. The neutral rate is an “inferred” rate—that is, it is estimated based on various analyses
and observations.
This rate is not static. It is a dynamic rate that varies based on a range of economic and financial
market factors. A number of economists inside as well as outside the Federal Reserve System do
extensive work to model and estimate this rate. While the estimates produced by these models can
differ substantially, they all typically draw on a variety of inputs which reflect, to varying degrees,
prospects for U.S. economic growth, global growth and various aspects of overall financial
conditions. (See the Appendix, “Modeling the Neutral Rate.”)
The neutral rate can be measured for different time horizons. Estimates of the “shorter-run” neutral
rate are typically influenced by nonmonetary drivers of near-term GDP growth such as changes in
current fiscal policy.
1Estimates of the “longer-run” neutral rate are typically influenced by nonmonetary drivers which
reflect more enduring secular factors such as expected medium-term growth in the workforce and
the expected rate of increase in labor productivity. Productivity growth, in turn, is influenced by
investment in capital equipment and technology, regulatory policies, and policies which impact
the education and skill levels of the U.S. workforce. In addition, the longer-run neutral rate is likely
to be influenced by trends in the global supply and demand for safe and liquid financial assets.
To illustrate the difference between short- and long-run measures, I will use an example regarding
fiscal policy. If the federal government passes a substantial tax cut or increases government
spending, it may create a short-term stimulus that materially increases near-term GDP, which will
likely be accompanied by an increase in the shorter-run neutral rate. However, if these policies do
not fundamentally increase the medium- or longer-term growth potential of the U.S. economy,
they may have only a marginal impact on the longer-run neutral rate.
In assessing the stance of monetary policy and making judgments about the future path of the
federal funds rate, I prefer to focus on measures of the neutral rate that de-emphasize the impact
of more volatile, shorter-run transitory factors. I tend to focus more on a range of indicators that
reflect the sustainable (medium-term and longer-run) growth potential for the U.S. economy.
Why Is the Neutral Rate Important?
Despite the fact that judging the level of the neutral rate is inherently uncertain and imprecise,
many of us at the Federal Reserve pay close attention to the various models that seek to estimate
this rate. The reason is that, despite the relatively wide confidence bands around these estimates,
they can provide an indication, albeit imperfect, of whether our monetary stance is
accommodative, neutral or restrictive. Making a judgment on the stance of monetary policy is a
key part of my job as a central banker.
Monetary policy is accommodative when the federal funds rate is below the neutral rate. When
this is the case, economic slack will tend to diminish—the economy will tend to grow faster, the
unemployment rate should decline and inflation should tend to rise. When the federal funds rate is
above the neutral rate, monetary policy is restrictive. When this is the case, economic slack will
tend to increase—economic growth will tend to slow, the unemployment rate should tend to rise
and the rate of inflation should be more muted or decline. The challenge for the Federal Reserve
is managing this process and getting the balance right.
A good analogy is comparing this judgment to the assessment you typically make in approaching
an intersection while driving your car. Should you be pressing on the accelerator, easing off the
accelerator or pressing your foot on the brakes? In this analogy, being accommodative is equivalent
to pressing on the accelerator; being restrictive is equivalent to stepping on the brakes. If the
Federal Reserve is raising the federal funds rate in order to remove accommodation and move
toward a neutral stance, this is analogous to easing your foot off the accelerator. Every driver is
familiar with making these judgments even though they are inherently imprecise and uncertain—
and tend to be made through “feel” by assessing a variety of factors.
While I look at the more volatile and imprecise measures of the shorter-run neutral rate, I am
hesitant to base my monetary policy judgments on these potentially transitory fluctuations. I prefer
to adjust the federal funds rate in response to my assessments of economic conditions, including
2my outlook for inflation, in a patient and gradual manner. This approach is more consistent with
greater emphasis on my estimates of the longer-run neutral rate.
As mentioned earlier, because monetary policy acts with a lag, policymakers have to make
judgments on the stance and direction of policy well in advance, just as a driver has to make a
decision to speed up or slow down well before reaching an intersection. When driving, if you wait
too long to ease up on the accelerator, and consequently need to slam on the brakes, you risk losing
control of your vehicle. Similarly, keeping monetary policy accommodative for too long can lead
to creation of excesses and imbalances that can be very difficult to address—and can create a need
for the Federal Reserve to play “catch-up,” which has historically increased the probability of
recession. History has shown that some moderation can, in fact, increase the likelihood of
extending an economic expansion.
A Reality Check: Historical Trends in Global Interest Rates
As a reality check on estimates of the neutral federal funds rate, I find it very useful to look at
trends in market-determined interest rates—which are not theoretical and can be observed. For
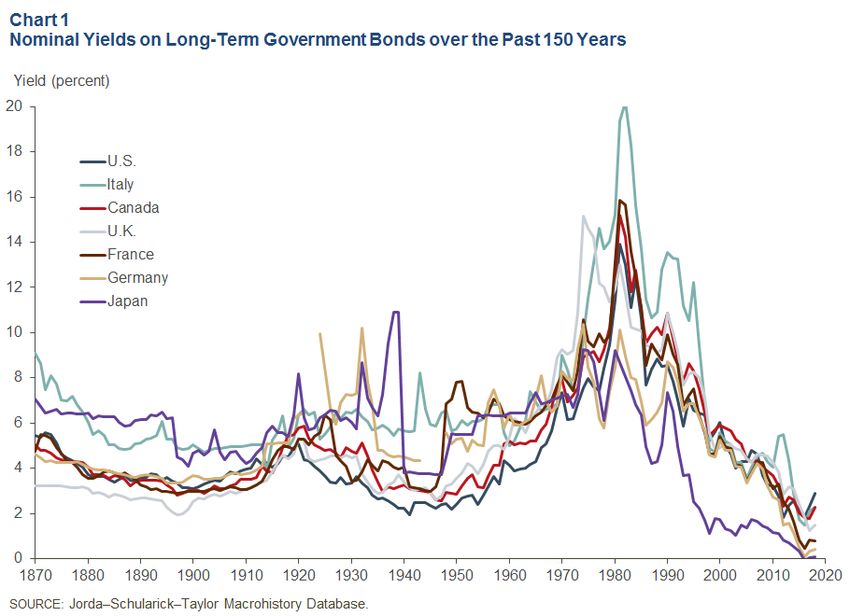
example, it is worth noting that nominal yields on long-term bonds in the Group of Seven (G-7)
countries—Canada, France, Germany, Italy, Japan, the United Kingdom and the United States—
have recently touched their lowest levels in the past 150 years (Chart 1). One driver of the decline
in nominal yields since the 1970s is likely a significant reduction in longer-run inflation
expectations.
3Changes in inflation-adjusted global government bond yields should, over time, reflect changes in
the longer-run neutral real rate of interest. After adjusting for inflation, the real interest rates on
safe and liquid assets—primarily global government bonds of various countries—have declined
significantly over the past 30 years, a decline that precedes the Great Recession. Our economists
at the Dallas Fed believe that this decline in real interest rates is likely due to lower rates of trend
economic growth in these various countries, at least partly as a result of demographic shifts
(particularly aging populations) and lower rates of trend productivity growth.1
Another major factor in the downward trend in bond yields is the substantial growth in worldwide
demand for safe and liquid assets arising from a considerable increase in the size of pension funds,
global central bank balance sheets, and other fixed-income investment pools. When global
investors look for safety and liquidity, they naturally gravitate to U.S. Treasury bonds as well as
other sovereign obligations.
As financial markets have become much more globally integrated, the search for safe assets has
increasingly become global. In this search, much has been made of the shortage of safe assets in
which these global pools of money can be invested. The impact has been to drive down interest
rates on government debt in the U.S. as well as globally. Dallas Fed economist Marc Giannoni and
his research co-authors have argued that the increased demand for safety and liquidity explains a
decline of more than 60 basis points in long-term real rates around the world over the past two
decades.2
It stands to reason that, as global interest rates decline, our estimates of the neutral rate of interest
have also correspondingly declined.
Neutral Rate Uncertainty and the Challenge of Forecasting Productivity Growth
As I mentioned earlier, I tend to view estimates of shorter-run and longer-run neutral rates as just
one factor among several indicators which influence my assessment of the stance of monetary
policy. I also rely on my regular conversations with a broad range of business contacts, our Federal
Reserve business surveys, assessments of labor market dynamics, inflation indicators, the behavior
of various financial market indicators and the shape of the yield curve in assessing overall
economic conditions.
In this context, I use estimates of the neutral rate as part of an overall mosaic of indicators which
help shape my overall assessments of current and future economic activity. When looking at
neutral rate estimates, I am highly cognizant that there is likely to be significant disagreement
between different models, and their outputs can be volatile based on changes in economic and
financial conditions. I always keep in mind that these estimates are inherently uncertain and
imprecise.
One reason for the uncertainty and imprecision is that potential GDP growth is a key driver of the
neutral rate—and this is inherently challenging to forecast. GDP growth is comprised of growth in
the labor force plus growth in the rate of productivity. I would emphasize that, while economists
are reasonably proficient in estimating likely changes in labor force growth, it is far more difficult
and challenging for economists to anticipate changes in the sustainable rate of improvement in
productivity.
4If the rate of workforce growth is likely to slow, can this be offset by improvements in
productivity? Higher rates of sustained productivity growth would mean, all things being equal, a
higher neutral interest rate. The uncertainty regarding future improvements in productivity creates
uncertainty for estimates of the neutral rate of interest. Chart 2 illustrates the difficulty in
forecasting productivity growth by comparing actual productivity growth in the U.S. versus
forecasts.
Implications for Monetary Policy
Currently, with the U.S. unemployment rate at approximately 3.7 percent and the headline personal
consumption expenditures (PCE) rate of inflation at slightly more than 2 percent, I believe that the
Federal Reserve is achieving its dual-mandate objectives.
As we reach our dual-mandate objectives, I believe that the Federal Reserve should be gradually
easing off the accelerator—we no longer need to be stimulating the U.S. economy. As such, I
believe we should be gradually and patiently moving toward a neutral policy stance.
Due to improvements in expectations for near-term U.S. economic growth, estimates of the
shorter-run neutral rate have risen over the past 12 months. However, because these shorter-run
estimates are subject to great uncertainty and can be heavily influenced by near-term transitory
factors, I tend to focus a bit more heavily on expectations for medium- and longer-term growth in
the U.S. economy. As a consequence, estimates of the longer-run neutral rate weigh more heavily
on my thinking.
As mentioned earlier, it is our expectation at the Dallas Fed that the impact of recent fiscal
stimulus, which has substantially contributed to 2018 economic growth, is likely to wane
somewhat in 2019 and further in 2020. At the same time that the recent stimulus begins to wane,
5our Dallas Fed economists believe that the rate of workforce growth, a key driver of longer-term
GDP growth, is likely to slow due to aging-population demographics.
A key question is whether this slowing in workforce growth will be offset by improvements in the
rate of productivity growth in the U.S. How the rate of productivity growth unfolds in 2019 and
2020, and beyond, will have a significant impact on future GDP growth. Because the sustainable
rate of productivity growth is inherently difficult to predict, I have been somewhat cautious in my
judgments regarding the appropriate pace and ultimate level of the federal funds rate.
To help make these assessments, I carefully monitor the Treasury yield curve. This curve serves
as a reality check for my outlook regarding the U.S. and global economies. As of the date of this
essay, the one-year Treasury rate stands at 2.65 percent, the two-year stands at 2.88 percent and
the 10-year and 30-year Treasury rates are at 3.15 percent and 3.36 percent, respectively.3 In my
opinion, the one- and two-year short-term rates are substantially reflective of communications by
the Federal Reserve regarding our expectations for the path of the federal funds rate. I think those
expectations are heavily priced into these shorter-term Treasury securities. While I believe the
more muted rise in the 10- and 30-year Treasuries is reflective of a substantial amount of global
liquidity and demand for safe assets, I also think the yield levels of these securities are consistent
with more sluggish expectations for future economic growth in the U.S. and globally.
I am also cognizant that the 10-year Treasury has recently moved from 2.90 percent at the
beginning of September to 3.15 percent today.4 This may reflect several factors, including greater
optimism regarding the prospects for future GDP growth.
Each of us around the FOMC table submits quarterly, as part of the Summary of Economic
Projections (sometimes referred to as the SEP or the “dot plot”), our best judgments regarding the
appropriate path for the federal funds rate and the “longer-run” federal funds rate. My longer-run
rate submission is my best estimate of the longer-run neutral rate for the U.S. economy. In the
September SEP, the range of submissions by FOMC participants for the longer-run rate was 2.5 to
3.5 percent, and the median estimate was 3.0 percent.
My own estimate of the longer-run neutral rate is modestly below the median of the estimates
made by my colleagues. My suggested rate path for 2019 is also modestly below the 3 to 3.25
percent median of the ranges suggested by my fellow FOMC participants. My SEP estimates are
consistent with my recent public statements which indicated that my base case for 2019 is to
gradually and patiently raise the federal funds rate into a range of 2.5 to 2.75 percent or, more
likely, into a range of 2.75 to 3 percent.
Of course, my judgments regarding both the stance of monetary policy and the appropriate path of
the federal funds rate are subject to change based on incoming economic and financial inputs which
will either confirm or cause me to adjust my views. In particular, as we proceed along this path, I
will be regularly assessing the outlook for the U.S. economy and also closely monitoring prospects
for global economic growth, as well as reviewing indicators of overall financial conditions and a
range of other factors in order to update my judgments regarding the appropriate pace and precise
number of moves necessary to get to a neutral stance.
6I intend to avoid prejudging what, if any, further actions we should take once we get into the range
of our best estimate of a neutral stance. I intend to make that judgment sometime in the spring or
summer of 2019 based on the economic outlook at that time.
Conclusion
My purpose in writing this essay has been to discuss the neutral rate, explore several of the key
issues surrounding this concept, and point out that it is just one aspect of assessing the stance of
U.S. monetary policy. It is worth emphasizing that there are limitations to using the neutral rate
concept—estimates of the neutral rate are imprecise and uncertain, as are estimates of the natural
rate of unemployment, potential GDP and other theoretical concepts we utilize to judge the state
of the U.S. economy. One key reason for uncertainty regarding estimates of the neutral rate is the
difficulty in predicting future changes in the sustainable rate of productivity growth.
Despite its inherent uncertainties, I believe that the neutral rate concept is a useful tool. However,
because it has limitations, it is best used in conjunction with a broad range of other economic
analyses as well as extensive conversations with private sector leaders and a focus on identifying
and differentiating between cyclical and structural drivers of the U.S. and global economies.
7APPENDIX
Modeling the Neutral Rate (r*)
There are various models in use inside and outside the Federal Reserve that produce estimates of
r*. One estimate I closely monitor is produced by Federal Reserve economist Thomas Laubach
and New York Fed President John Williams.5 Another estimate is done by Dallas Fed economist
Evan Koenig along with Alan Armen,6 and yet another is produced by Dallas Fed Research
Director Marc Giannoni along with Marco Del Negro, Domenico Giannone and Andrea
Tambalotti (referred to as “DGGT” in Chart A-1) of the New York Fed.7
These models differ in terms of their structural assumptions and the data they use to produce
estimates of the neutral rate. For example, Laubach–Williams uses data on real GDP, core PCE
inflation, oil prices, import prices and the federal funds rate as inputs for their model. This model
attempts to estimate an output gap to assess the neutral rate of interest. The Koenig model uses
data on long-term bond yields, survey measures of long-term GDP growth and long-term inflation
as inputs for its estimates of long-run r*. Giannoni’s model uses a broad set of key macroeconomic
and financial data series to generate estimates of the neutral rate at different time horizons. 8 Chart
A-1 provides a summary of the outputs of these models over the past 30 years.
8While these models produce estimates which can vary widely, they all agree that the longer-run
neutral rate of interest has declined over the past several years in comparison with the period 1985–
2005. Our Dallas Fed economists believe that drivers of the declines in estimates of the longer-run
neutral rate include lower trend GDP growth due to relatively sluggish productivity growth and to
demographics—namely, an aging population, which slows workforce growth. Increased global
demand for safe, liquid assets also contributes to the decline in estimates.
Separately, our economists find that their shorter-run r* estimates now exceed their longer-run
estimates (see Chart A-2 for estimates of shorter-run r*). They attribute this divergence to recent
fiscal stimulus and other factors that have boosted the confidence of households and firms, leading
them to borrow and invest.
9Notes
1
See, for example, “Measuring the World Natural Rate of Interest,” by Mark Wynne and Ren Zhang, Globalization
and Monetary Policy Institute Working Paper no. 315, revised June 2017,
www.dallasfed.org/~/media/documents/institute/wpapers/2017/0315.pdf, and “Global Trends in Interest Rates,” by
Marco Del Negro, Domenico Giannone, Marc Giannoni and Andrea Tambalotti, Working Paper no. 1812, Federal
Reserve Bank of Dallas, 2018, www.dallasfed.org/-/media/documents/research/papers/2018/wp1812.pdf.
2
See note 1, Del Negro et al.
3
As of Oct. 24, 2018, 8:10 a.m. ET.
4
Yield for beginning of September is as of Sept. 4, 2018.
5
“Measuring the Natural Rate of Interest,” by Thomas Laubach and John C. Williams, Review of Economics and
Statistics, MIT Press, vol. 85, no. 4, 2003, pp. 1,063–70. Also see “Measuring the Natural Rate of Interest:
International Trends and Determinants,” by Kathryn Holston, Thomas Laubach and John C. Williams, Journal of
International Economics, vol. 108, no. S1, 2017, pp. 59–75.
6
“Assessing Monetary Accommodation: A Simple Empirical Model of Monetary Policy and Its Implications for
Unemployment and Inflation,” by Evan F. Koenig and Alan Armen, Federal Reserve Bank of Dallas Staff Papers,
no. 23, 2015, www.dallasfed.org/~/media/documents/research/staff/staff1501.pdf.
7
“Safety, Liquidity, and the Natural Rate of Interest,” by Marco Del Negro, Domenico Giannone, Marc P. Giannoni
and Andrea Tambalotti, Brookings Papers on Economic Activity, Spring, 2017, pp. 235–316.
8
The dynamic stochastic general equilibrium (or “DSGE”) model in the DGGT paper includes growth in real GDP,
consumption, investment, wages, hours worked and productivity as well as inflation, inflation expectations and
various interest rates. The rate labeled DGGT in Chart A-1 is the 10-year-forward neutral rate of interest implied by
the model.
10You can also read