Growth behaviour of census towns in Kolkata metropolitan region, West Bengal, India
←
→
Page content transcription
If your browser does not render page correctly, please read the page content below
Trans.Inst.Indian Geographers
                                                                                                  ISSN 0970-9851

Growth behaviour of census towns in Kolkata metropolitan
region, West Bengal, India

Susmita Bhowmick* and Lakshmi Sivaramakrishnan, West Bengal

                                               Abstract
   The Indian sub-continent shares a long history of urbanization which is characterized by
   spatial and temporal discontinuities. In the post-independence period, large cities grew
   disproportionately at the cost of small and medium towns which either remained stagnant or
   declined. Industries are mainly concentrated in the large cities and this has created problems
   at both ends of the urban system- the mega cities are often overcrowded leading to haphazard
   expansion representing a crisis of asymmetry in the urban system. An important aspect of
   urbanization in the recent times relates to a sudden increase in the in the number of small towns
   in different parts of India ushering a sure shift in the urbanization process. Often referred to as
   ‘in situ urbanization’ West Bengal is witnessing this change more vigorously than most other
   parts of India. The present paper investigates the spatial structure of the distribution of the
   census towns in West Bengal with special reference to Kolkata Metropolitan Region (KMR)
   during 2001-2011 decade. The paper identifies the future potential pockets of urban growth
   in the peripheral areas of Kolkata. Notable reversal has been identified in the direction of
   urban growth in West Bengal and also in the KMR.

   Keywords: Census towns; reversal growth momentum; space saturation; spatial distribution
   pattern.

Introduction
The present urban system in most parts                resulted in overcrowding, congestion and
of the world is characterized by a swath of           inadequacy of infrastructural facilities. This
development in a few kilometers of every              lopsidedness is getting further accentuated as
metropolitan city, giving the urban centre an         more than 60 percent of the urban population
appearance of an island of development in             is concentrated in class-I cities as per 2001
an ocean of deprivation. This is true of India        Census (Sahasranaman, 2012). There is a
as well as that of West Bengal. Economic              general consensus that decentralization of
development during the last fifty years in            the services to the periphery of the cities
India is characterized by spatial lopsidedness        is necessary to integrate socio economic
(Gucchait, 2005), concentrated at the centre          development for making an efficient system
of large cities leaving an adverse effect on the      for sustainable urban future (Jha, 2006).
growth of medium and small towns (Dikshit,            Dispersal of cities is possible when the small
1997) engendering economic inequality                 nodes at the periphery of the big cities are well
across regions. Accelerated rural urban               connected with major cities both physically
migration and growing concentration of                and functionally. According to 2011 Census,
economic activities in a few large cities have        urbanization has increased faster than

                                                                      Transactions | Vol. 43, No. 1, 2021 | 81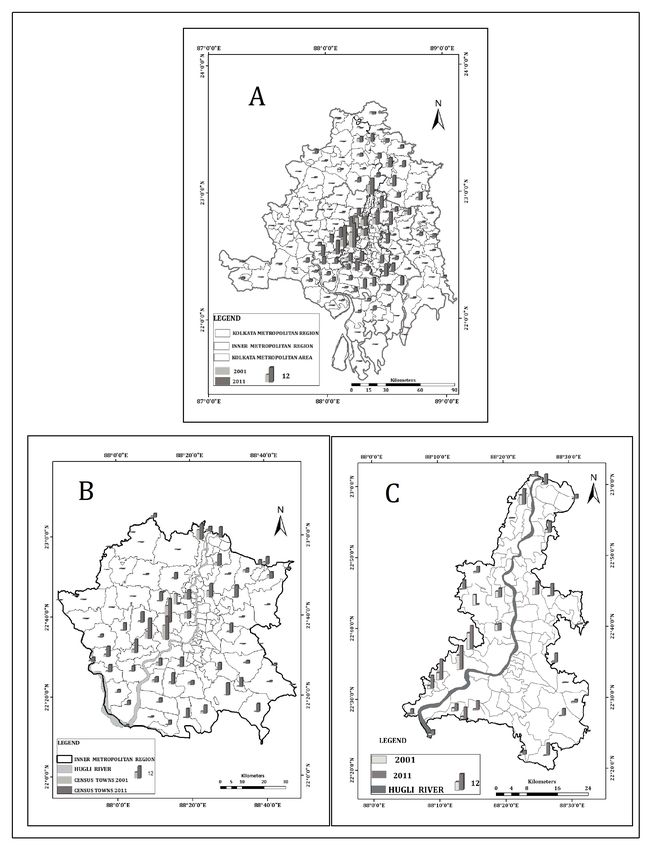
expected. For the first time, absolute increase   urbanization propelled by massive increase in
in urban population is higher than that of the    the number of census towns. The magnitude
rural population which has huge implication       of this growth has more than a marginal
in providing infrastructure and other civic       effect in the evaluation of demographic and
amenities in urban areas (Bhagat, 2011). The      urbanization pattern in Kolkata Metropolitan
natural increase, net rural urban composition     Region (KMR). Kolkata (previously
and rural to urban migration are all essential    Calcutta), the capital city of West Bengal
factors in urban growth. ‘In-situ’ urbanization   and its immediate surrounding area (Kolkata
where rural settlements and its population
                                                  Metropolitian Area) act as an urban magnet to
transform themselves into urban or quasi
                                                  pull huge population. Kolkata Metropolitian
urban ones without geographic relocation of
                                                  Area (KMA) had a population of 10.8
the residents too has been an important force
in the urbanization process (Zhu, Qi, Shao, &     million in 1991. Only Mumbai had more
He, 2007).                                        population than this. During 1951-1991,
                                                  Kolkata conurbation expanded requiring
     Urbanization in India can be broadly         planned intervention. The present study is
divided into two distinct phases, i.e. 1951-      an attempt to probe the spatial extension in
1991 and 1991-2011. The 1st phase of Indian       urbanization and variation of census towns
urbanization (1951-1991) has largely been         in the 21st century in KMR to measure its
propelled by rural to urban migration during      growth behaviour. The present work unfolds
the post partition period. The census of 1971     elements of subaltern urbanization in KMR
recorded an influx of population especially       which refers to the growth of settlement
to the metropolitian cities in Eastern India.     agglomerations that are independent and
Emergence of new commercial cities enhanced       autonomous in their interaction with the other
the metropolitization process which signifies     settlements (Denis, Mukhopadhyay, & Zerah,
the growth of cities with one lakh population     2012)
and above in India. This process is essentially
a product of centralization of administrative     Study Area
or commercial forces. This period witnessed       Kolkata Metropolitan Region (KMR) has
the stagnation and even decline of small          been selected for the present study. The
towns (Ramachandran, 1989). The second            latitudinal extension of the study area (Kolkata
phase (1991-2001) in India has witnessed          Metropolitan Region) is 87°07´ E to 88°98´ E
development of small towns and big cities         and 21°48´ N to 23°21´ N (Figure 1a and 1b).
leading to uneven urban structure. In India       This area is spread over a number of districts
the level of urbanization slowed down             namely, Kolkata, Haora, Hugli, North 24
considerably from 25.72 percent in 1991-          Parganas, South 24 Parganas, ten blocks of
2001 decade to 23.34 percent in 1981-91. But      Nadia, fifteen blocks of Bardhhaman, eight
                                                  blocks of Purba Medinipur and nine blocks
in the last 10 years (2001-2011) urbanization
                                                  of Paschim Medinipur. According to the 2011
in India appears to exhibit a spatial shift to
                                                  census, the total area of KMR is 23677 km2
metropolitan fringe areas which is certainly a    which includes 8 Districts; 87 Blocks; 73
new development. West Bengal during 1991-         Municipalities; and 468 census towns (now
2011 decades has experienced this new turn        467) (Table 1). The region includes the entire
with a phenomenal increase in the level of        district of Haora, Hugli, South 24 Parganas,

82 | Transactions | Vol. 43, No. 1, 2021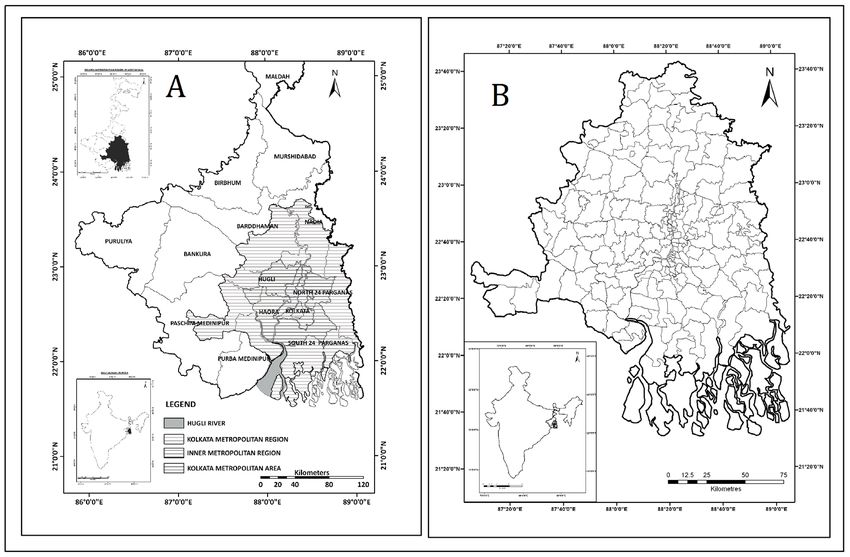
Fig. 1: Location of the study area; (A) KMR in West Bengal (B) Kolkata Metropolitan Region
    Source: Vision 2020 (KMDA Report); 2005, after identifying the Blocks and districts by
    Researcher)

Table 1: Kolkata metropolitan region: administrative units
            Administrative Units                               Administrative Units
            District                                                     8
            Block                                                       87
            Municipal Corporation                                       03
            Municipalities                                              73
            *Census Towns                                          468 (467) *
    N.B: *Joka has been excluded for its inclusion within Kolkata Municipal Corporation in 2012.
    Source: Compiled by the Researcher

North 24 Parganas in West Bengal and some         Handbook 2011; CMDA reports etc. The
parts of the district of Bardhhaman, Paschim      CMDA (Calcutta Metropolitan Development
Medinipur, Purba Medinipur and Nadia.             Authority) reports have been used to delimit
                                                  the study area. The boundary of KMR has
Data and methods
                                                  been determined by identifying the respective
The present study is mainly based on the          districts and blocks. The report of Directorate
secondary data collected from Census of           of Animal Resources and Animal Health,
India 1991, 2001 and 2011; Statistical            Government of West Bengal, 2001 and the

                                                                Transactions | Vol. 43, No. 1, 2021 | 83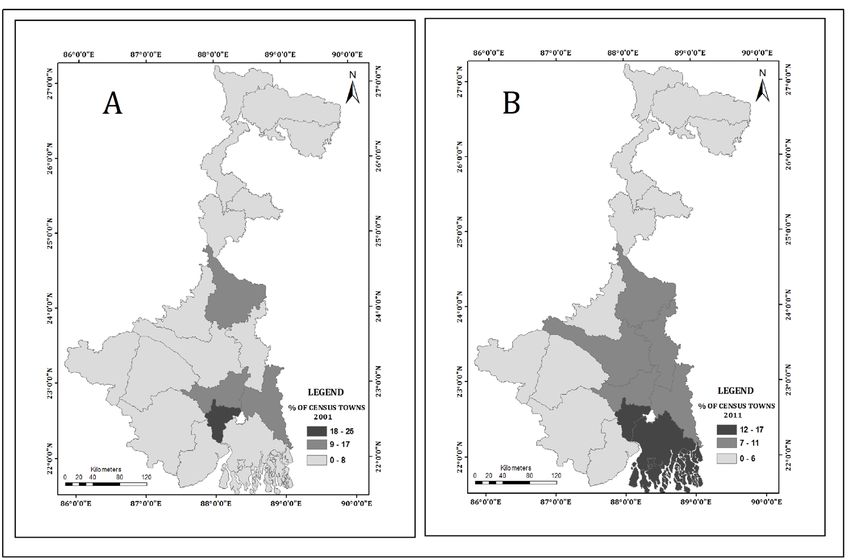
Google Earth Image, as on 16.3.2017 have          towns are administered by rural administrative
also been used to find out the precise location   bodies like Gram Panchayat (GPs) in West
of census towns in the study area. Census         Bengal (Pradhan, 2012) and are referred to
towns have been extracted from Google Earth       as unrecognized towns because they are not
Image as point data which has been transferred    capable of providing services at the level
as Keyhole Markup Language (KML file)             of urban local bodies (ULBs) due to lack of
to GIS platform for making vector data to         allotment of government funds as they are
obtain the appropriate location of it. All the    governed by the GPs. Urban out-growths are
identified census towns and study area which      viable unit such as a village or a hamlet and
were geo coded with Universal Transverse          clearly identifiable in terms of its boundaries
Mercator Projection (UTM) spheroid and            and location like university campus, port area
datum WGS-84, Zone North 45, were                 etc. Well planned development of these cities
assembled in Arc GIS software (9.3 versions).     can help disperse rural migrant population
In order to examine the spatial spread of         and prevent overcrowding in metropolitan
census towns in West Bengal, choropleth           cities (Sahasranaman, 2012). In order to
maps have been prepared using proportion          execute the plan of development of the census
of census towns (2001and 2011 separately)         towns for sustainable future, it is imperative
in each district except Kolkata city which has    to know the present spatial pattern of the
been excluded as it is fully included under       census towns. The 2011 Census highlighted
municipal administration. The spatial data of     the rapid growth in the number of these non-
census towns have also been used to generate      recognized towns which though contributed
the map for the same separately for 2001          more than one third of the urban population
and 2011 to show its growth pattern and also      growth in India during 2001-2011. These
direction of dispersion in KMR (including         newly emerged census towns have added
inner KMR and KMA).                               7.4 per cent in 2001 to 14.4 percent in 2011
                                                  (Roy and Pradhan, 2018) to the total urban
Result and discussion
                                                  population. The present study highlights the
A centre as a settlement node tends to multiply   spatial characteristics of census towns in
and grow. It serves to be both a ‘container’      West Bengal and its contribution in urban
and also a ‘Magnet’ (Jha, 2006). Urban areas      growth of KMR to underscore its importance
in India are broadly classified into three        in urban planning.
types: statutory towns, census towns and
out-growth. Statutory towns are commonly          Growth of Census towns in West Bengal
known as Municipal units which have               West Bengal has the highest number of
administrative bodies like town panchayat,        census towns among all the Indian states
cantonment board etc. Census towns are            where urbanization has taken a new direction
complete settlement units that are classified     by increasing the number of census towns
as urban areas by the Registrar General of        at the periphery of the big core cities in the
India as part of the census operations if they    first decade of the 21st century. The rate of
cross the threshold of three specific urban       urbanization in the existing towns as well as
characteristics like population size with         the growth of new census towns have changed
5000, population density 400 person/square        remarkably in the last 10 years (Figure 2A
kilometer and at least 75 per cent of male        and 2B). Presently (i.e. 2011), West Bengal
workforce in non-firm sectors. The census         has 787 census towns but in 2001, the total

84 | Transactions | Vol. 43, No. 1, 2021
Table 2: Inter district variation in distribution of census towns in West Bengal 2001-2011
Name of The Districts Census Towns 2001 (%) Census Towns 2011 (%) Decadal Growth Rate (%)
Uttar Dinajpur 1.5 0.5 33.33
Hugli 14 8.13 128.57
Jalpaiguri 6.53 4.44 169.23
Haora 25.12 17.15 170
Puruliya 4.5 3.18 177.78
Murshidabad 11 8.25 195.45
Kochbihar 2.01 1.52 200
North 24 Parganas 9.5 9.9 310.53
Nadia 7 8 350
Purba Medinipur 2.01 2.54 400
Dakshin Dinajpur 0 0.5 400
Paschim Medinipur 1 1.39 450
Darjeeling 2.01 2.92 475
South 24 Parganas 7 13.98 685.71
Bankura 1 1.14 800
Malda 1.5 3.43 800
Bardhhaman 3.5 11.18 1157.14
Birbhum 0.5 1.78 1300
Source: Census of India, 2011
Fig. 2: Distribution of census towns in West Bengal. (A) 2001 (B) 2011
Transactions | Vol. 43, No. 1, 2021 | 85number of census towns was 199 and only urbanized districts like Haora, Hugli and
148 in 1991. Thus, increasing number of North Parganas. The number of census towns
census towns has contributed significantly to in these traditionally urbanized districts
an urban growth rate of 29.54 per cent during remained by and large unaltered in both the
2001-2011 in sharp contrast with 3.44 per years with some exceptions in 2011. This is
cent during 1991-2001 (Table 3). The state a sure indication of a transformation of the
also has the highest urban population density urbanization pattern in the state taking a
which is 6789 person/square kilometer reverse direction. Table 2 shows a remarkable
(Samanta, 2011). growth rate of census towns with the exception
The urbanization pattern of West Bengal of Uttar Dinajpur. The increase in the number
has always been characterized by top of census town is particularly significant in
bottom orientation of development where Barddhaman and Birbhum as well as in South
large cities attract more services, functions 24 Parganas, Malda and Bankura. The most
and investments and it disseminated to the outstanding feature of this growth pattern is
medium and small towns. But in West Bengal, that the districts farther away from Kolkata
this pattern is mainly restricted to Kolkata and have experienced relatively high growth rate
its immediate urbanized districts in KMA. compared to the highly urbanized districts
But a remarkable change has been found like North 24 parganas, Hugli, Haora which
in the urbanization pattern of West Bengal are in close spatial proximity to Kolkata. It
is not difficult to conjecture that improved
during 2001-2011. Table 3 indicates high
modern transportation seems to have played
decadal growth rate of census towns and also
an important role in the dispersal of census
proportion of urban population in this period
towns in the peripheral areas of Kolkata as the
in all the districts of West Bengal. However,
new census towns are primarily concentrated
figure 2A and 2B reveal that concentration of
along the transport lines (Fig 4C). It is now
the census towns shifts from the urbanized
pertinent to explore why the census towns are
pockets of KMA to the north east direction of growing disproportionately around Kolkata.
the state especially in 2011. Districts in North
Bengal such as Jalpaiguri, Uttar Dinajpur, Growth of Census Towns in KMR
Dakshin Dinajpur, Darjeeling, Kochbihar The period 1991-2001 in West Bengal is
have fewer census towns in both the years. witness to increased population pressure on
On the other hand, the peripheral districts Kolkata and its immediate surrounding area.
like Barddhaman, Nadia, South 24 parganas With increasing importance, a town or a city
have experienced high growth in the number grows dynamically and gradually becomes
of census towns in 2011 except the most the most important centre to attract huge
Table 3: Decadal overview of urban characteristics in West Bengal
Year % Urban Pop Census Towns Growth Rate (%) % to Urban Pop. KMA Statutory Towns
1991 27.48 148 58.92
2001 27.97 199* 3.44* 58.88 126
2011 31.87 787* 29.54* 48.44 127
Source : Census of India, 2011; * Calculated by Researcher, 2016
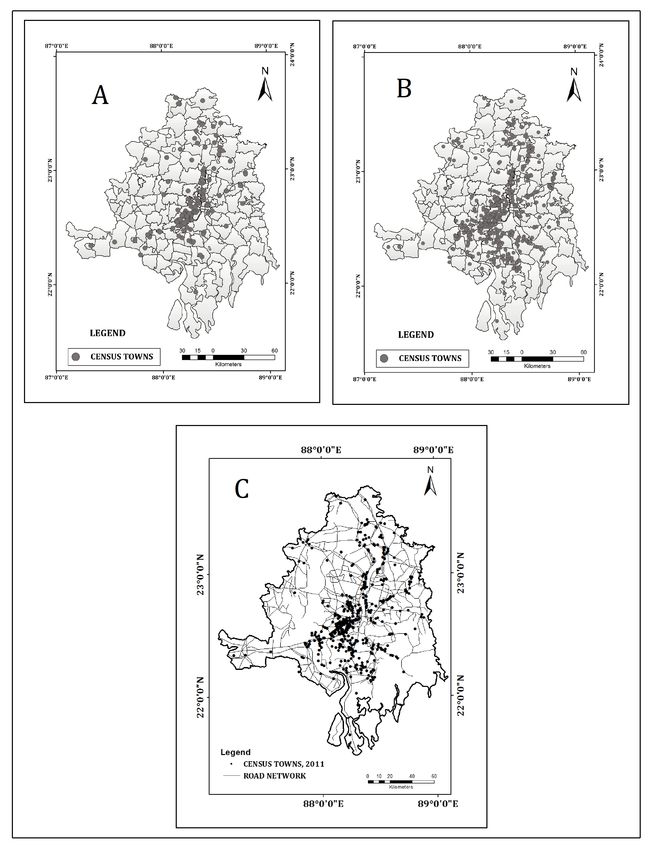
86 | Transactions | Vol. 43, No. 1, 2021Fig. 3: Temporal changes of Census Towns- 2001 and 2011, A: KMR; B: Inner KMR, C: KMA.
Transactions | Vol. 43, No. 1, 2021 | 87Fig. 4: Spatial distribution of census towns in KMR; (A) 2001 (B) 2011 (C) growth of Census Towns along the road connectivity 88 | Transactions | Vol. 43, No. 1, 2021
mass of population. At the juvenile stage of               In this sense, Kolkata and its immediate
the development of towns as stated by Taylor,          surrounding areas can be considered as the
it is observed that towns are simultaneously           magnetic pool attracting huge population and
subjected to both centripetal and centrifugal          services. The KMR has nearly 60 per cent of
forces (Mandal, 2000). The city of Kolkata             census towns of the state and the remaining
experiences centripetal forces while the               40 per cent distributed in rest of the state.
fringe belt grows due largely to the operation         In KMR, Kolkata is the ‘nodal point’ that
of centrifugal forces (Kundu, 1986). The               can rarely keep pace with its increasing
2001 census of the KMA clearly reflects                population. Thus, under this situation, growth
an increased population pressure and the               of census towns should be promoted as sub-
increased multiplicity of census towns in              centers in the periphery of Kolkata to check
the periphery of Kolkata during 2011. The              this expansion which may promote urban
proportion of the state’s urban population             sustainability.
in KMA has sharply declined from 58.88                 Changing Pattern of the growth of
percent in 2001 to 48.44 percent in 2011 in            Census Towns in KMR
correspondence with the emergence of many              Substantial increase in the number of census
medium and small towns as evident from                 towns in Kolkata’s periphery is clearly
decreasing urban population of class I towns           indicative of a process of decentralization
from 81.77 per cent in 1991 to 75 per cent             of urban development unfolding in more
in 2001 (Table 3). Although KMA consists of            recent years. During 1991-2001, districts
a majority of municipalities (39 out of 73 in          more proximate to the city of Kolkata had
KMR) and also accounts for maximum share               greater number of census towns. Table 4
of urban population but the rate of urban              clearly reveals a pattern of asymmetrical
growth has increased in the districts lying            distribution in the spatial packing of the semi
outside of KMA boundary. Out of the 787                urban units i.e. the census towns. For a better
census towns in West Bengal only 195 (25%)             understanding of the relative change in the
are located within KMA and the remaining               census towns, the analysis has been carried
75 percent of new census towns are now                 out separately for the KMR classified into
distributed in districts with overwhelming             two spatial units, namely the inner KMR and
agricultural economy (Samanta, 2011).                  the KMA.

Table 4: KMR: % age of urban population in census towns to the district population, 2011
      Districts       Total Population   Urban Population   Census Towns        % Share of Census Towns
  Hugli                  5519145             2128499             64                       18.01
  Haora                  4850029             3074144            135                       45.26
  North 24 Parganas     10009781             5732162             78                       14.28
  South 24 Parganas      8161961             2087773            110                       13.46
  Nadia                  5167600             1438873             63                       19.10
  Paschim Medinipur      5913457              722686             11                        5.75
  Purba Medinipur        5095875              592714             20                        5.24
  Bardhhaman             7717563             3078299             88                        5.21
    Source: Calculated by the Researcher, 2016, Based on the data of Census of India, 2011

                                                                      Transactions | Vol. 43, No. 1, 2021 | 89
Figure 3A, 3B; 3C show the growth in Urban growth is stimulated by
the number of census towns in each district accelerated flow of population. West Bengal
of the KMR, the inner KMR and in KMA receives sizeable immigrants leading to the
respectively for the year 2001 and 2011. It growth of urban centres in the KMR. The
appears that highly urbanized districts around pattern of urbanization in KMR is linear
Kolkata like Haora, North 24 Parganas, and largely dictated by major communications
Hugli have experienced accelerated growth routes of the Hugli River as well as the road
rate of census towns in both the years and and rail connectivity. On the left bank of the
majority of the urban population is still Hugli River, the Eastern Metropolitan Bypass
concentrated in these districts. On the other (EM Bypass) and the low-lying areas to the
hand, the growth of census towns in the east practically define the existing urban area
between Kalyani and Barrackpur of North 24
peripheral districts like Burdwan, Nadia,
Parganas. Development of urban areas can
Paschim Medinipur, Purba Medinipur in
also be found along the Kona Expressway
KMR is also significantly high. Although
and the Durgapur Expressway on the right
the growth rate of census towns in peripheral
bank of the same River. Overall large
districts was comparatively low in 2001 but
metropolitan centres are generally situated
it began to increase rapidly by the year 2011. near the areas of major communications
This sudden growth of new census towns in intersections (Chatterjee, 1991). The analysis
the peripheral districts indicates the changing also reveals that the degree of primacy has
nature of urbanization pattern in the KMR. promoted most unbalanced urban structure
Figures 4A and 4B reveal a clear in the KMR as found by Chatterjee (1991)
directional shift in the growth of new census Banerjee (1990) and Chakraborty (1990)
towns during 2001-2011 in southwest and in their respective studies. The more recent
northwest direction from Kolkata along major reversal in the urbanization pattern during
arterial roads. Figure 4C confirms the positive 2001-2011 appears to have been largely
correlation between road connectivity in the determined by a change in connectivity mode
during 1980’s from River to Road. Indeed
growth of new census towns in KMR. The
river played a significant role in the growth
maps reflect the process of nucleation and
and development of Kolkata as a primate city
diffusion engendered by space saturation and
from the very beginning. But the recent shift
unavailability of services in Kolkata and its
from river to roads as the primary means of
immediate surrounding areas. The spatial
connectivity has been a major force in the
extent of urbanization around Kolkata is recent mushrooming of new census towns
already quite high stretching about 80 km mainly along the road intersections in KMR
along both the banks of the Hugli River. A (Fig 4C).
huge number of new census towns have
emerged during the 2001-11 decade which Conclusions
has accelerated the rate of urbanization in It may be concluded that until 2001 the
the KMR. The Census of 2011 shows a clear urbanization in Kolkata was primarily
divergence in the urbanization process in the influenced by the Hugli River in the most
form of accelerated suburbanization. urbanized pockets of KMA. The pattern is
90 | Transactions | Vol. 43, No. 1, 2021undergoing substantial modification in the Weekly,46(34), 10-12. Retrieved from http://
first decade of the present century in response www.epw.in/journal/2011/34/commentary/
to changes in transport mode, especially emerging-pattern-urbanisation--india.html.
road connectivity. Emergence of a large Chakraborty, S. C. (1990). The growth of Calcutta
number of census towns associated with in the Twentieth Century. In S. Chaudhury
improved communication lines has been an (Ed.), Calcutta : The Living City;Vol II,The
important driver of the recent diffusion of Present and The Future (pp. 1-14). Kolkata:
the urbanization process both in the state and Oxford University Press.
in the KMR. This changing pattern is more
Chatterjee, M. (1991). Settelement Pattern the
polycentric where each census town acts as
Calcutta Metropolitan Area- A Futuristics
an independent node for its development.
Vision. In B. Dasgupata, M. Bhattachariya,
This newly emerging pattern has its own D. K. Basu, M. Chatterjje, & T. K. Banerjee
dynamics calling attention to an integrated (Ed.), Calcutta’s Urban Future (pp. 177-206).
plan for rural urban development to promote Kolkata: Government of West Bengal.
decentralized development replacing the
earlier emphasis on particular areas. In this Denis, E., Mukhopadhyay, P., & Zerah, M. H.
context the opinion of Jairam Ramesh, then (2012). Subaltern urbanization in India.
Union Minister of Rural Development appears Economic and Political Weekly, 47(30) 52-
significant when he said: ‘our policies have 62. Retrieved from http://www.researchgate.
net/publication/232273029_Subaltern_
been either for rural or for urban areas, we
Urbanization_in_India.html.
lack an approach to such Tri-Sanku (middle
world) areas’ (Pradhan, 2013, p.50). The Dikshit, K. (1997). The large and medium cities
conventional approach needs correction to in India: The former as problem areas and the
focus on this new development of ‘subaltern’ latter as growth centres of future. In J. Diddee
urbanization that has potential for greater (Ed.), Indian Medium Towns: An appraisal of
spatial integration of the two. their role as growth centres (pp. 27-47). New
Delhi: Rawat Publications.
References
Government of India. Census of India.(2001).
Bandopadhyay, A. K. (1991). Traffic and Retrieved from www.censusindia.gov.
Transportation Situation in Calcutta: Pattern in: http://www.censusindia.gov.in/2011
of its growth and outlook for the future. In B. common/census_data_2001.html
Dasgupta, M. Bhattacharya, D. K. Basu, M.
Chatterjee, & T. K. Banerjee (Ed.),Calcutta’s Government of India. Census of India.(2011).
Urban Future: Agonies from the past and Retrieved from www.censusindia.gov.in:
Prospects for the Future (pp. 319-344). http://www.censusindia.gov.in/2011census/
Kolkata: Government of West Bengal. hlo/pca/PCA_pdf/PCA-CRC-1900.pdf
Banerjee, B. (1990). Future of Calcutta Metropolis Government of West Bengal. Kolkata Metropolitan
looking for a new Regional Balance. In J. Development Authority. (April,2005). Vision
Racine (Ed.), Calcutta 1981 : The city, its 2025: Final Draft. Kolkata.
crisis and the debate on urban planning and Guchhait, S (2005). Population Explosion in West
devlopment (pp. 351-370). Kolkata: Concept Bengal: An Enquiry into some aspects of
Publication. its geographical Reality, (Doctoral Thesis).
Bhagat, R. B. (2011). Emerging pattern of The University of Burdwan, Burdwan,West
urbanization in India. Economic and Political Bengal.
Transactions | Vol. 43, No. 1, 2021 | 91Jha, D. V. (2006). Small Towns and Regional Economic and Political Weekly, 47 (24),
Development. New Delhi: Rajesh 59-66.
Publication.
Samanta, G. (2011). In between rural and urban:
Kundu, S. (1986). Urban Agglomeration and Challenges for governance of non-recognised
their role in the urban Development of urban territories in West Bengal. Geo Spatial
West Bengal(India) (Doctoral Thesis) North Issues, August 2013, 44-56.
Bengal.
Zhu, Y., Qi, X., Shao, H., & He, K. (2009). The
Mandal, R. B. (2000). Urban Geography: a evolution of in situ urbanization and quasi
Textbook. New Delhi: Cencept Publishing urban population and their planning and
Company. environmental implications in China: Case
studies from Quanzhou Municipality. In de
Pradhan, K. C. (2012). Unacknowledged
Sherbiniin Alex; A. Rahman, A. Barbieri, J.C.
urbanzation : The New census towns of India.
Fotso, and Y. Zhu (ed.), Urban population
In E.Denis & M.H.Zerah (Ed.), Subaltern
environment dynamics in the developing
Urbanisation in India: An Introduction to the
world: case study and lesson learned. (pp.213-
Dynamics of Ordinary Towns (pp.39-66),
245) Paris: CICRED Retrieved from http://
New Delhi: Springer, Retrieve from https://
www.ciesin.columbia.edu/repository/pern/
doi.org/10.1007/978-81-322-3616-0.
papers/urban_pde_zhu_etal.pdf
Pradhan, K. C. (2013). Unacknowledged
urbanization: New census towns of India.
Economic and Political Weekly ;48 (36), Susmita Bhowmick*
43-48. Department of Geography
Ramachandran, R. (1989). Urbanization and St. Xavier’s College, Purba Burdwan,
Urban System in India. New Delhi: Oxford West Bengal
University Press.
Lakshmi Sivaramakrishnan
Roy, S. N., & Pradhan, K. C. (2018). Predicting Professor, Department of Geography,
the future of census towns. Economic and
Jadavpur University, Kolkata, West Bengal
Political Weekly ; 53 (49), 70-79.
Sahasranaman, A. (2012). Financing the * Author for correspondence
development of small and medium cities. E-mail: susmitaphd2012@gmail.com
92 | Transactions | Vol. 43, No. 1, 2021You can also read