DISTRIBUTION AND POPULATION STRUCTURE OF Avicennia marina (FORSSK.) - VIERH IN RELATION TO THE ENVIRONMENTAL GRADIENT ALONG THE RED SEA COAST OF ...
←
→
Page content transcription
If your browser does not render page correctly, please read the page content below
Ekológia (Bratislava) - Journal of the Institute of Landscape Ecology, Slovak Academy of Sciences Vol. 40, No. 1, p. 48–53, 2021
doi:10.2478/eko-2021-0006
DISTRIBUTION AND POPULATION STRUCTURE OF Avicennia marina (FORSSK.)
VIERH IN RELATION TO THE ENVIRONMENTAL GRADIENT ALONG THE
RED SEA COAST OF EGYPT
RAMADAN A. SHAWKY
Plant Ecology and Ranges Department, Desert Research Center; 1 Mathaf El-Matariya st., Cairo, Egypt; e-mail: ramadan_salam@hotmail.com
Received: 22 August 2020 / Accepted: 4 November 2020
Abstract
Shawky R.A.: Distribution and population structure of Avicennia marina (Forssk.) vierh in relation to the environmental gradient along the Red Sea
Coast of Egypt. Ekológia (Bratislava), Vol. 40, No. 1, p. 48–53, 2021.
This paper presents an assessment of changes in Avicennia marina population along the Egyptian coasts of the Red Sea. A retrospective analysis of
the mangrove cover and distribution was carried out. The populations in Sharm El-Bahary and wadi El-Gimal lack at least one or more volume class
stages, while all volume classes are represented in the last two populations occurring in wadi Al-Qu’lan and Sharm El-Madfa’a. The relationships
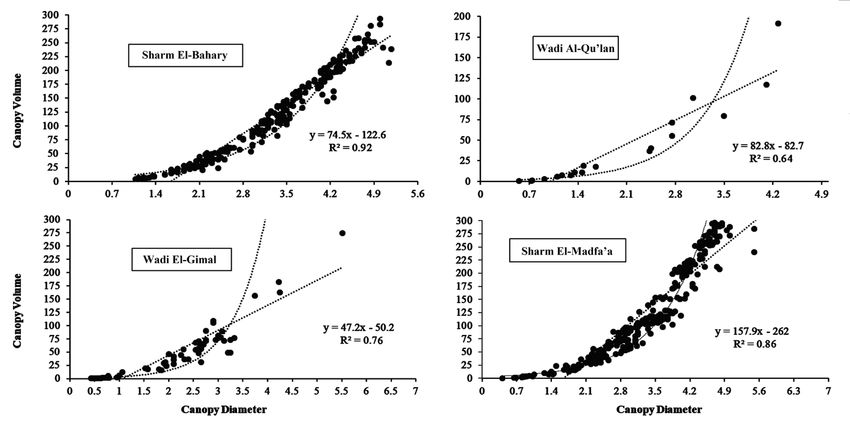
between the individual diameter and canopy volume of A. marina population are simply linear. Strong correlation coefficients are obtained (r2=0.92)
for the population of Sharm El-Bahry and the weak correlation coefficients are obtained (r2=0.63) for the population of wadi El-Gimal. On the other
hand, the relationships between the individual heights and canopy volume of A. marina population are simply linear. Strong correlation coefficients
are obtained (r2=0.72) for the population of Sharm El-Bahry and the weak correlation coefficients are obtained (r2=0.46) for the population of wadi
El-Gimal. All growth performance of A. marina species differ significantly at the four localities except the circumference. The comparison of soil
characteristics A. marina populations in the four study localities showed significant variations in all variables except the silt content and SO4.
Key words: mangrove, Avicennia marina, distribution, Red Sea, population structure.
Introduction ity rates of individuals and of past recruitment events (Hutch-
ings, 1997). The size structure of plant populations has been
Mangrove areas in Egypt are dispersed in numerous small sites frequently used to assess the regeneration status and to predict
along the Red Sea coast, although the overall area of man- future population changes by assuming that populations with
groves is relatively small. The present estimates indicate that many small stems in relation to larger ones are self-replacing or
there are approximately five km2 of mangroves in Egypt. The increasing, whereas populations with relatively few small stems
limited mangrove areas of Egypt suggest that this is a vulner- are believed to be declining in abundance (Hay, 2002; Buyave-
able ecosystem and needs an effective management to ensure jchewin et al., 2003; Baker et al., 2005; Bastian et al., 2020).
its ongoing survival (Saenger, 2002). The mangal vegetation of Also, the tidal inundation influences a number of edaphic fac-
the western coast of the Red Sea was investigated by Kassas, tors including salinity, pH, and concentrations of nutrients that
Zahran (1965, 1967) and Zahran (1977, 1982). are known to influence growth and distribution of mangrove
The population structure of an individual tree or the struc- vegetation (Ball et al., 1988; McKee, 1993).
ture of the population can be conceived as comprising a series The aims of this study were to investigate, from an empiri-
of stages (e.g. seedling, juvenile, mature trees etc.). The size cal data set, whether measures of size structure is related to
class structure indicates a successful regeneration of forest spe- future trends in the number of plant populations, as can be de-
cies (Curtis, McIntosh, 1951; Saxena, Singh, 1984). Also, Harp- rived from the population growth rates and the edaphic factors.
er and White (1974) and Harper (1977) suggested that the tree
size may be a better predictor of reproductive output than age Material and methods
and that balanced or stable size distributions in higher plants
may be analogous to balance or stable age distributions in high-
er plants. Natural disturbance plays a critical role in mediating Study area
old-growth forest dynamics and disturbance vary in type, scale,
and effect on stand structure (Pickett, White, 1985; Pickett et Four main localities encompass the entire coastlines of the Egyp-
al., 1989). tian Red Sea. The natural variation of Avicennia marina popula-
The structure of a plant population is the result of the ac- tions subjected to different climatic, physiographic, and human
tions of biotic and abiotic factors upon the growth and mortal- impact conditions were selected for this study. The first transect
© The Author(s) 2021. This is an open access article distributed under the terms of the CC BY-NC-ND license.
https://content.sciendo.com/view/journals/eko/eko-overview.xml
48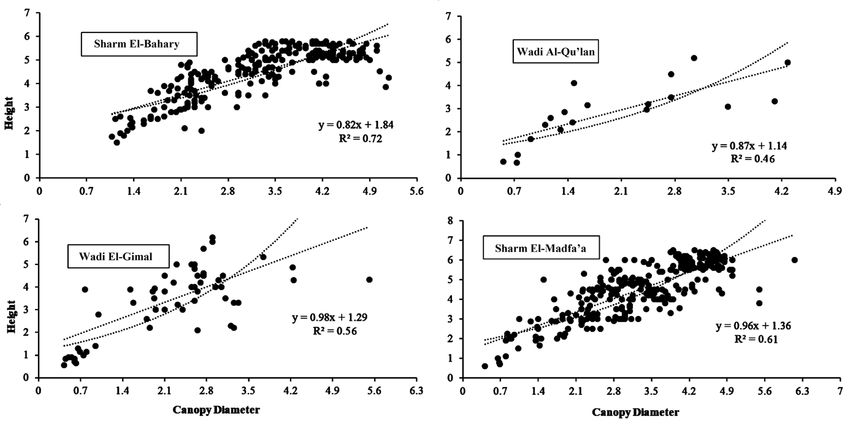
Ekológia (Bratislava) 2021: 40(1): 48–53

was in Sharm El-Bahry (south El-Qusair), the second in Wadi
El-Gimal (south Marsa Alam), the third Wadi Al-Qu’lan (north
Hamata), and the fourth in Sharm El-Madfa’a (south Shalatein).
The exact location and altitude of the study sites are shown in
Table 1 and Fig. 1.

Population size structure

Demographic survey of A. marina population was performed
through field work during 2017. The size was estimated by meas-
uring the height and mean crown diameter. The tree size was
calculated as a spherical shape, in form of the canopy volume V
following Hegazy, Elhag, 2006; Mosallam et al. (2018) according
to the equation: V=4/3*ab, where a is the average canopy radius
and b represents the canopy height. The size class values were
then used to classify A. marina populations into seven size-class-
es (A300 m3) separated the populations
into different sizes (Alatar et al., 2015). Density was calculated as
individuals per hectare. The mean and standard error of circum-
ference, height, diameter, size index, and height to diameter ratio
per individual in each size class were then determined (Shaltout,
Ayyad, 1988; Alatar et al., 2015).

Soil and data analysis

A composite soil sample was collected from each stand as a
profile of 50 cm depth and air-dried. Organic carbon was deter-
mined by the loss on ignition method. CaCO3 was estimated us-
ing Collin’s calciminer. Soil-water extracts (1:5) were prepared
for the estimation of electric conductivity (EC) using electric
conductivity meter, soil reaction using pH meter, chlorides by          Fig. 1. Map of Egypt showing the studied localities along the Red
direct titration against silver nitrate using 5% potassium chro-        Sea Coast.
mate as indicator, and bicarbonates by titration against HCl us-
ing methyl orange as an indicator. Soil extracts of 5 g air-dried
soil were prepared using 2.5% v/v glacial acetic acid for estima-
tion of sodium, potassium, and calcium by flame photometer              Table 1. Study locations with Global Positioning System (GPS) read-
and magnesium by atomic absorption (Allen et al., 1989; Rayan           ings along the Red Sea Coast, Egypt.
et al., 2001). All the edaphic variables were assessed statically
using COSTAT software for Windows version (4.6) and one-                 Location                           Latitude and altitude
way analysis of variance was applied to assess the significance          Sharm El-Bahry                  34° 24’ 52’’ E / 25° 52’ 05’’ N
of variations using SPSS for windows version (25).                       Wadi El-Gimal                   35° 05’ 33’’ E / 24° 40’ 08’’ N
                                                                         Wadi Al-Qu’lan                  35° 15’ 73’’ E / 24° 22’ 36’’ N
Results                                                                  Sharm El-Madfa’a                35° 42’ 12’’ E / 22° 54’ 39’’ N

Population size structure

The canopy volume class distribution of the four study popula-          sented in the last two populations occurring in wadi Al-Qu’lan
tions are shown in Fig. 2. The populations in Sharm El-Bahary           and Sharm El-Madfa’a. The volume class C in wadi Al-Qu’lan
and wadi El-Gimal lack at least one or more volume class stages.        population shows the highest contribution (33.9%), while both
The volume class distribution in the first population (Sharm El-        classes D and E have only a presence of 1.6%. Population in
Bahary) shows the presence of five classes, B to F. The volume          Sharm El-Madfa’a has the highest volume class F (25.7%) and
class E is the highest, making up 36.1% of the total population,        the lowest two classes are A and G making up 1.4% (Fig. 2).
while class B is the lowest, comprising 4.7%. Alternatively, the
volume class distribution in the population of wadi El-Gimal            Population features relations
demonstrates five classes, A to E. The maximum contribution
for volume comes from class C, which makes up 31.6% of the              The relation between the diameter and canopy volume of A.
total population, while the lowest contribution is from class A,        marina population showed a positive relationship (Fig. 3).
which comprises 10.5% (Fig. 2). All volume classes are repre-           Strong correlation coefficients are obtained (r2=0.92) for the

                                                                                                                                           49
Ekológia (Bratislava) 2021: 40(1): 48–53 Fig. 2. Canopy volume class distribution in the four study populations of A. marina: Volume classes are: A300 m3. Fig. 3. The relationships between the individual canopy diameter and canopy volume of A. marina populations in the four study localities. 50
Ekológia (Bratislava) 2021: 40(1): 48–53

Fig. 4. The relationships between the individual height and canopy volume of A. marina populations in the four study localities.

Table 2. Comparison of growth performance (mean±SE) of A. marina populations in the four study localities, Significance levels are shown
as (*): p
Ekológia (Bratislava) 2021: 40(1): 48–53

Table 3. Comparison of edaphic factors (mean±SE) of A. marina populations in the four study localities, Significance levels are shown as (*):
p
Ekológia (Bratislava) 2021: 40(1): 48–53

Ball, M.C., Cowan, I.R. & Farquhar C.D. (1988). Maintenance of leaf tem-           Leak, W.B. (1965). The J–shaped probability distribution. For. Sci., 11, 405–
     perature and the optimization of carbon gain in relation to water loss            409. DOI: 10.1093/forestscience/11.4.405.
     in a tropical mangrove forest. Aust. J. Plant Physiol., 15, 263–276. DOI:     Mckee, K.L. (1993). Determination of Mangrove species distribution patterns
     10.1071/PP9880263.                                                                in Neotropical forests: biotic and abiotic factors affecting seedling survival
Bastian, O., Cudlín, P., Pechanec, V., Brzoska, P., Štěrbová, L., Včeláková, R.,       and growth. Ph.D. dissertation, Louisiana state University. Historical
     Purkyt, J. & Grunewald K. (2020). Assessments of biodiversity and habi-           Dissertations and Theses. 5656. https://digitalcommons.lsu.edu/grad-
     tat services in cities – exemplified by Dresden (Germany) and Liberec             school_disstheses/5656.
     (Czech Republic). Ekológia (Bratislava), 39(2), 174–189. DOI: 10.2478/        Moore, P.D. & Bhadresa R. (1978). Population structure, biomass and pat-
     eko-2020-0013.                                                                    tern in a semi–desert shrub Zygophyllum eurypterum, in the Turan Bio-
Buyavejchewin, S., LaFrankie, J.V., Baker, P.J., Kanzaki, M., Ashton, P.S.             sphere Reserve of northeastern Iran. J. Appl. Ecol., 15, 837–845. DOI:
     & Yamakura T. (2003). Spatial distribution patterns of the dominant               10.2307/2402779.
     canopy dipterocarp species in a seasonal dry evergreen forest in west-        Mosallam, H.A., Shawky, R.A & Hashim A.A. (2018). Size structure and
     ern Thailand. For. Ecol. Manag., 175, 87–101. DOI: 10.1016/S0378-                 floristic diversity of Acacia trees population in Taif Area, Saudi Arabia.
     1127(02)00126-3.                                                                  Journal of Biodiversity Endangered Species, 6(1), 1–7. DOI: 10.4172/2332-
Crisp, M.D. & Lange R.T. (1976). Age structure, distribution and survival              2543.1000210.
     under grazing of the arid–zone shrub Acacia burkitti. Oikos, 27, 86–92.       Pickett, S.T.A. & White P.S. (1985). The ecology of natural disturbance and
     DOI: 10.2307/3543436.                                                             patch dynamics. San Diego: Academic Press.
Curtis, J.T. & McIntosh R.P. (1951). An upland forest continuum in the             Pickett, S.T.A., Kolasa, J., Armesto, J.J. & Collins S.L. (1989). The ecological
     prairie-forest border region of Wisconsin. Ecology, 32, 476–496. DOI:             concept of disturbance and its expression at various hierarchical levels.
     10.2307/1931725.                                                                  Oikos, 54, 129–136. DOI: 10.2307/3565258.
El-Ghonemy, A.A., Wallace, A. & Romney E.M. (1980). Frequency distri-              Rayan, J., Garabet, S., Harmson, K. & Rashid A. (2001). Soil and plant analy-
     bution of numbers of perennial shrubs in the northern Mojave Desert.              sis laboratory manual. Aleppo: ICARDA.
     Great Basin Naturalist Memoirs, 40, 34–38. https://www.jstor.org/sta-         Saenger, P. (2002). Ecological assessment of mangroves in Egypt. Cairo: FAO.
     ble/23376657.                                                                 Saxena, A.K. & Singh J.S. (1984). Tree population structure of certain Hima-
El-Khouly, A.A. & Khedr A.A. (2007). Zonation pattern of Avicennia marina              layan forest association and implications concerning their future com-
     and Rhizophora mucronata along the Red Sea Coast, Egypt. World Ap-                position. Plant Ecol., 58, 61–69. DOI: 10.1007/BF00044928.
     plied Sciences Journal, 2(4), 283–288.                                        Shaltout, K.H. & Ayyad M.A. (1988). Structure and standing crop of Egyp-
Goldberg, D.E. & Turner R.M. (1986). Vegetation change and plant demog-                tian Thymelaea hirsuta populations. Vegetatio, 74, 137–142. DOI:
     raphy in permanent plots in the Sonoran Desert. Ecology, 67, 695–712.             10.1007/BF00044738.
     DOI: 10.2307/1937693.                                                         Ukpong, I.E. (1995). An ordination study of mangrove swamp communities
Harper, J.L. & White J. (1974). The demography of plants. Annu. Rev. Ecol.             in West Africa. Vegetatio, 116, 147–159. DOI: 10.1007/BF00045305.
     Syst., 5, 419–463. DOI: 10.1146/annurev.es.05.110174.002223.                  van Rooyen, N., Theron, G.K. & Breedenkamp G.J. (1994). Population trends
Harper, J.L. (1977). Population biology of plants. London: Academic Press.             of woody species in the Kalahari Gemsbok National Park from 1978 to
Hay, J.D. (2002). Aspectos da ecologia de populações de plantas nativas no             1994. Arid Zone Ecology Forum (AZEF). National Research Founda-
     cerrado do Brasil. In Araújo, E.L., Moura, A.N., Sampaio, E.V.S.B., Ges-          tion, Pretoria, Karoo National Park, Beaufort West.
     tinari, L.M.S. & Carneiro J.M.T. (Eds.), Biodiversidade, conservação euso     Ward, D. & Roher C. (1997). Anthropogenic causes of high mortality and low
     sustentável da flora do Brasil (pp. 153–157). Recife: Imprensa Universi-          recruitment in the three Acacia tree taxa in the Negev desert Israel. Biodi-
     tária UFRPE.                                                                      vers. Conserv., 6, 877–893. DOI: 10.1023/B:BIOC.0000010408.90955.48.
Hegazy, A.K. & Elhag M. (2006). Considerations of demography and life ta-          Weiner, J. (1985). Size hierarchies in experimental populations of annual
     ble analysis for conservation of Acacia tortilis in South Sinai. World Ap-        plants. Ecology, 66, 743–752. DOI: 10.2307/1940535.
     plied Sciences Journal, 1, 97–106.                                            Wiegand, K., Jeltsch, F. & Ward D. (1999). Analysis of the population dynam-
Hutchings, M.J. (1997). The structure of plant populations. In Crawley, M.J.           ics of Acacia trees in the Negev desert, Israel with a spatially explicit
     (Ed.), Plant ecology (pp. 325‒358). Oxford: Blackwell Scientific Com-             computer simulation model. Ecol. Model., 117, 203–224. DOI: 10.1016/
     pany.                                                                             S0304-3800(98)00199-9.
Kassas, M. & Zahran M.A. (1965). Studies on the ecology of the Red Sea             Zahran, M.A. (1977). Wet formations of the African Red Sea coast. In Chap-
     coastal land. II. The district from El-Galala El-Qibliya to Hurghada. Bul-        man, V.J. (Ed.), Wet coastal ecosystem (pp. 215–231). Amsterdam: Elsevier.
     letin of Social Geography, Egypt, 38, 185‒193.                                Zahran, M.A. (1982). Ecology of the halophytic vegetation of Egypt. In D.N.
Kassas, M. & Zahran M.A. (1967). On the ecology of the Red Sea littoral salt           Sen & K.S. Rajpurohit (Eds.), Tasks for vegetation science (pp. 3‒20). The
     marsh, Egypt. Ecol. Monogr., 37, 297–316. DOI: 10.2307/1942326.                   Hague: Dr. Junk.

                                                                                                                                                                 53
You can also read