Snow water scarcity induced by record breaking warm winter in 2020 in Japan - Nature
←
→
Page content transcription
If your browser does not render page correctly, please read the page content below
www.nature.com/scientificreports
OPEN Snow water scarcity induced
by record‑breaking warm winter
in 2020 in Japan
Satoshi Watanabe1*, Shunji Kotsuki2,3,4, Shinjiro Kanae5, Kenji Tanaka6 & Atsushi Higuchi2
This study highlights the severity of the low snow water equivalent (SWE) and remarkably high
temperatures in 2020 in Japan, where reductions in SWE have significant impacts on society due to
its importance for water resources. A continuous 60-year land surface simulation forced by reanalysis
data revealed that the low SWE in many river basins in the southern snowy region of mainland Japan
are the most severe on record. The impact of the remarkably high temperatures in 2020 on the low
SWE was investigated by considering the relationships among SWE, temperature, and precipitation.
The main difference between the 2020 case and prior periods of low SWE is the record-breaking high
temperatures. Despite the fact that SWE was the lowest in 2020, precipitation was much higher than
that in 2019, which was one of the lowest SWE on record pre-2020. The results indicate the possibility
that even more serious low-SWE periods will be caused if lower precipitation and higher temperatures
occur simultaneously.
Japan experienced lowest snowfall in many regions in the boreal winter 2020. Lowest snowfall results in the low-
est amount of snow water equivalent (SWE). Reductions in SWE have significant impacts on society, especially
in Japan. Cities in northern Japan are the snowiest cities in the world, receiving more than 600 cm of snowfall
annually. Snow water plays an important role in terms of water resources in Japan, and many efforts have been
devoted for the e stimation1.
Increasing temperatures worldwide are leading to increased interest in snow levels2. This holds true for
Japan as well, since many cities, including Tokyo, the capital of Japan, rely on snow water for some proportion
of water resources. In fact, water usage restrictions due to low SWE were imposed in 2019. Since low SWE levels
also occurred in 2020, i.e. 2 years in a row, there is increasing need for accurate understanding of SWE under
global warming conditions. The boreal winter of 2020 was among the warmest on record, which was also the
case in Japan.
Many studies have been conducted to understand and project the impacts of global warming. Prior to the
recent period of low SWE in Japan, a significant reduction due to global warming was already p rojected3,4. Espe-
cially, remarkable reduction in snow cover and snowfall are projected in years with light snow cover5. It would
be informative to investigate the low SWE period in Japan in 2020, characterised by low SWE with remarkably
high temperatures, as it represents a case under conditions of global warming, something that previous studies
have tried to project.
This study analyses the case of remarkably low SWE in Japan in 2020 by comparing it with past cases of low
SWE. Given the aforementioned impacts of low SWE, the analysis of the record-breaking case of 2020 is expected
to be beneficial for future predictions and policy-making. The aim of this study was to compare the 2020 case
with past cases, understand its degree of severity, and identify similarities and differences with past cases. Because
of the significant North–South span of Japan, snow tendencies are diverse within the country. Consideration of
this diversity is necessary for the analysis.
We herein performed a continuous 60-year land surface simulation with the Simple Biosphere Model includ-
ing Urban Canopy model (SiBUC;6,7). The Japanese 55-year Reanalysis (JRA55;8) was used as forcing data to
drive the model (see Methods “Land surface simulations” for details). We performed preliminary SiBUC-based
simulations at seven observational sites to validate the snow module, and confirmed the ability to reproduce past
SWE levels (Supplementary Figure S2). Kawase et al.9 used JRA55 as forcing data and successfully simulated the
1
School of Engineering, The University of Tokyo, Tokyo 113‑8656, Japan. 2Center for Environmental Remote
Sensing (CEReS), Chiba University, Chiba 263‑8522, Japan. 3RPRESTO, Japan Science and Technology Agency,
Chiba, Japan. 4RIKEN Center for Computational Science, Kobe, Japan. 5School of Environment and Society, Tokyo
Institute of Technology, Tokyo 152‑8550, Japan. 6Disaster Prevention Research Institute, Kyoto University, Uji,
Kyoto 611‑0011, Japan. *email: stswata@hydra.t.u‑tokyo.ac.jp
Scientific Reports | (2020) 10:18541 | https://doi.org/10.1038/s41598-020-75440-8 1
Vol.:(0123456789)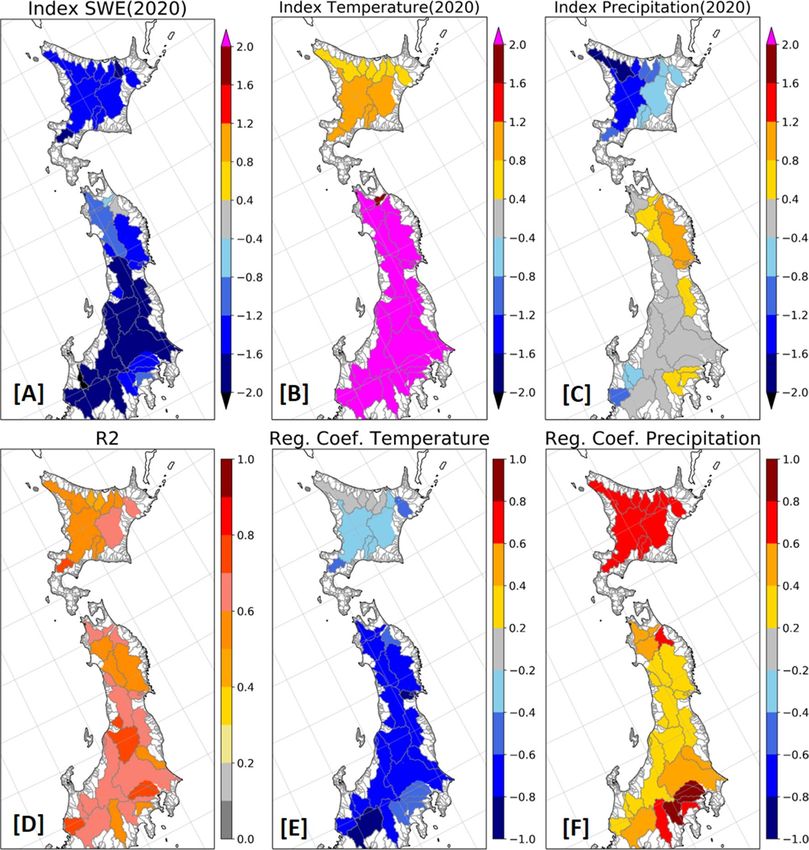
www.nature.com/scientificreports/
Figure 1. (A) Seasonal evolution in domain-averaged SWE and (B) 60-year change in the domain-averaged
temperature, precipitation, snowfall, and SWE. In (A), seasonal evolution from 1961 to 2020 are indicated by
a 60-year average (dashed line), and the years with lowest five SWE are indicated in colours: 1989(orange);
1990 (blue); 2007 (green); 2019 (purple); and 2020 (red). The horizontal axis represents day of year. In (B), the
temperature is averaged over January to February, precipitation and snowfall are shown as the totals during
January and February, and the SWE is averaged over the period from the 1st to the 10th of March, as decided
based on the seasonal evolution results. Vertical lines delineate five lowest SWE years. The bold and dashed
horizontal line delineates mean of 60 years and the value equivalent to two sigma of standardised index
calculated for domain average.
daily variations in snow depth in the Japanese Northern Alps. The SiBUC computes the SWE, which enables
comparisons over long time periods and wide areas. Another possible approach to comparing the 2020 case with
past examples would be to use observed measurements. However, as the locations and time frames for which
observations are available are limited, such measurements are unsuitable for wide-ranging, long-term compari-
sons. The use of a method employing satellite observations could also be considered; in recent years, a wealth
of satellite information has become available, yielding a trove of research results. This method is suitable for
comparisons over a wide area, but cannot provide information for past time periods when satellite observations
were not available. In addition, some challenges remain in the estimation of regional snow trends10.
In this study the severity of low snowfall levels in 2020 was quantified from the SWE variability obtained
from a continuous 60-year land surface simulation. The SWE variability explained by temperature and precipi-
tation was also quantified to understand the meteorological background on low SWE. To conduct a long-term
comparison spanning a wide area, an index capable of standardising characteristics that differ for each region
is necessary. An index that indicates severity in terms of the number of standard deviations from the long-term
mean, was used to quantify the severity of low snowfall levels, which allows severity to be assessed and compared
between multiple regions with differing average values (see Methods “Severity index” for details).
Results
Figure 1 shows the seasonal evolution and long-term changes in SWE in mainland Japan obtained by the 60-year
continuous land surface simulation. The SWE is spatially averaged over the domain 136.0–146.0 E and 35.0–46.0
N, which includes most of the snowy area of mainland Japan. The results show that the peak of the SWE occurred
from late February to early March. Thus, a 60-year time series was calculated by averaging SWE from the 1st to
the 10th of March. The calculation from the 1st to the 10th of April was also examined, and confirmed that our
main conclusions were robust to the change of period (Supplementary Figure S1). In addition to the SWE, the
60-year time series of mean temperature, total precipitation, and total snowfall from January to February were
also examined because high temperatures and low precipitation are considered to be two possible reasons for
the low SWE.
The results show that the SWE in Japan in 2020 was one of the lowest, equivalent to the levels in 1989, 1990,
2007, and 2019. According to the figure indicating seasonal evolution (Fig. 1A), the SWE in 2020 was signifi-
cantly lower than the 60-year average, and lower than that of most other years for almost every day of the year.
According to the time series shown in Fig. 1B, the mean temperature from January to February 2020 was high-
est in the record. The total precipitation from January to February in 2020 was near the average level. The total
snowfall from January to February in 2020 is close to the lowest in the record. In other words, the low snowfall
was not due to low precipitation but rather due to high temperatures, which leads to a situation characterised by
more precipitation occurring as rainfall than as snowfall. The situation in 2020, characterised by low SWE, high
temperatures, and average precipitation, is the same as the situation in 1989 and 1990. On the other hand, the
case of 2019, the other low SWE years, is characterised by precipitation lower than average. The case of 2007 is
characterised by both high temperature and low precipitation while the temperature is lower than in 2020 and
precipitation is higher than in 2019. To understand the relationship among them, it is necessary to examine the
analysis at a specific spatial scale.
Scientific Reports | (2020) 10:18541 | https://doi.org/10.1038/s41598-020-75440-8 2
Vol:.(1234567890)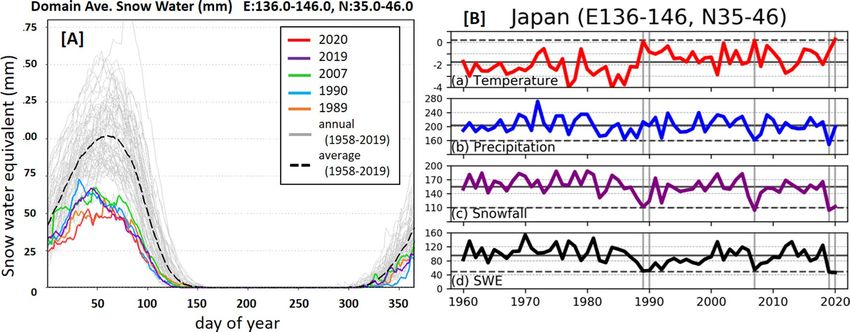
www.nature.com/scientificreports/
Figure 2. Spatial distribution of SWE averaged over the period from March 1st to March 10th from 1961 to
2020.
The SWE in 2020 is one of the lowest across mainland Japan, except for in the regions from 39.0 to 41.0 N,
which is the northern snowy region of mainland Japan (hereafter referred to as NM). Figure 2 shows the spatial
distribution of SWE in Japan over 60 years from 1961 to 2020. The result shows that SWE in 2020 in the domain
under the 39.0 N, which is the southern snowy region of mainland Japan (hereafter referred to as SM), is lower
than or equivalent to 1989, 1990, 2007 and 2019, which domain-averaged SWE is fairly lower than average. This
is significant especially in the southern regions.
In order to understand the characteristics of the SWE at a specific spatial scale and its impact on water
resources, we investigated the average SWE over river basins meeting the criterion that the area is more than
1000 km2 and the basin average SWE is greater than 5 mm for a 60-year average. Here, the standardised index
was used to quantify the severity during the target period and to compare the severity between the river basins.
In addition, a multiple regression analysis was conducted to quantify the SWE variability explained by tempera-
ture and precipitation.
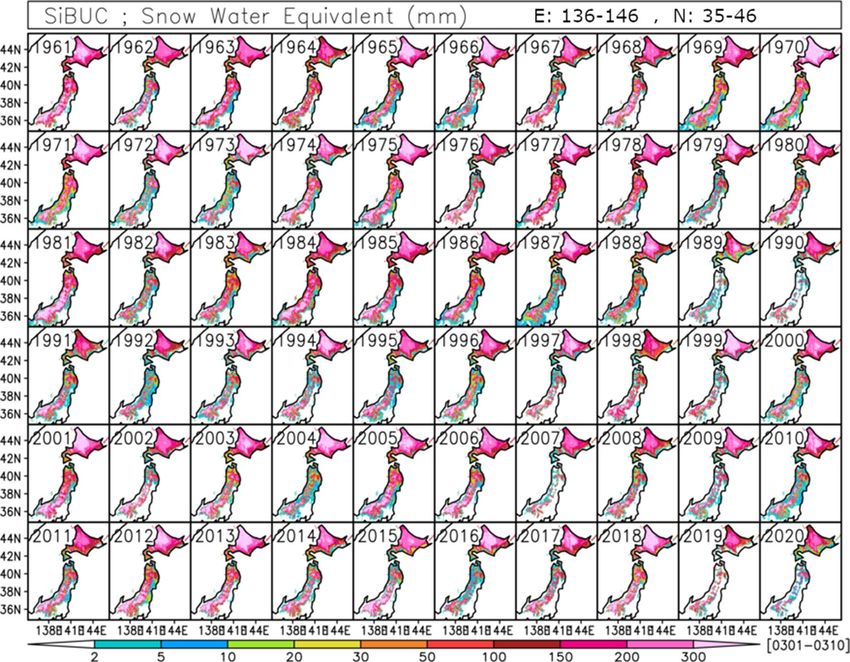
Figure 3 shows the calculated standardised index of SWE, temperature, and precipitation, which indicates
the SWE indices in most river basins are lower than − 1.2, which corresponds to that exceedance probability is
approximately 11.5%. In the southern target river basins, they are lower than − 1.6 and 5.5%. The SWE in 2020
is record-breaking in 8 of 36 river basins. In addition, the temperature indices in most river basins are more
than 2.0, corresponding to that exceedance probability is approximately 2.5%, and are record-breaking in 21 of
36 basins. While the precipitation indices in some of northern river basin is lower, they are not significant in
most river basins.
In 2020, the standardised index of temperature in river basins of the SM are higher and that of precipitation
is lower in river basins of the domain over 41.0 N including Hokkaido, the north island of Japan, which results
in the lower SWE in both basins of the SM and Hokkaido. The result of a multiple regression analysis shows that
SWE variability is explained by temperature more than precipitation in the basins of the SM, and vice versa in
Hokkaido. The coefficient of determination of a multiple regression analysis indicates almost half of the SWE
variability is explained by the variability of temperature and precipitation.
The characteristic of the SWE in 2020, which is the combination of higher temperature in basins of the SM
and lower precipitation in basins of Hokkaido, is unique comparing to other lower SWE years. Figure 4 shows
the relationship among standardised indices in major basins for the five lowest-SWE years. The relationship is
different in each of the lowest 5 years. Each lowest year is explained by low precipitation and/or high temperature.
In 2007, explained by both higher temperature and lower precipitation, SWE is not lower than in 2020 because
Scientific Reports | (2020) 10:18541 | https://doi.org/10.1038/s41598-020-75440-8 3
Vol.:(0123456789)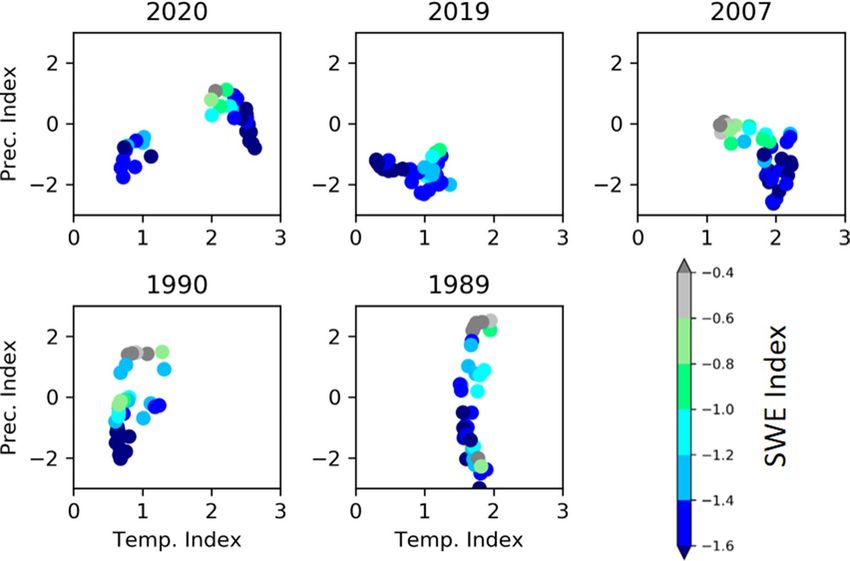
www.nature.com/scientificreports/
Figure 3. Standardised indices for average SWE (A), average temperature (B), and total precipitation (C) in
2020 and the coefficient of determination (D) and the standardised partial regression coefficient of temperature
(E) and precipitation (F) from the result of multiple regression analysis in each major basin.
temperature is lower than in 2020. In 2020, the river basins characterized by high temperature have higher
temperature than other years, and the river basins characterized by low precipitation are comparable to other
years. The results indicate the possibility that lower SWE than in 2020 will be caused if temperature in 2020 and
precipitation in 2007 or 2019 occur simultaneously.
Discussion
The results indicated that the relationships between the severity of SWE, temperature, and precipitation differ
by region. In the basins of the SM, temperature is more important than precipitation for the SWE. This is in line
with the findings of previous studies11–13. Warmer temperatures lead to the conversion of snowfall to rainfall14.
Since the mean temperature in the basins of the SM is higher than those in the basins of the NM and Hokkaido,
the influence of temperature is relatively greater in the basins of the SM.
The record-breaking low SWE in 2020 along with the highest temperatures seems to validate the results of
previous studies assessing the impact of global warming on SWE. Some studies (e.g.3,4) pointed to the significant
impact of increased temperatures on reductions in SWE based on future projections using climate simulations.
As shown in the results, the temperature in 2020 was significantly higher than the average except for the basins
of Hokkaido. The temperature in 2020 was more than 2° above the average. The situation in 2020 is indicative of
a situation under climate change. The projections in above mentioned studies were realized in 2020.
Scientific Reports | (2020) 10:18541 | https://doi.org/10.1038/s41598-020-75440-8 4
Vol:.(1234567890)www.nature.com/scientificreports/
Figure 4. Relationship among standardised indices in major basins for the five lowest-SWE years. The
estimated standardised index of SWE is indicated by the colour gradient, and plotted along with temperature
(horizontal axis) and precipitation (vertical axis). Data points in the bottom-right quadrant represent basins
characterised by higher temperatures and lower precipitation than the respective averages.
The results also indicate the possibility that precipitation levels lower than those in 2020 would lead to an
even lower SWE. As shown in the results, precipitation in the basins of the SM in 2020 was not lower than that
in 2019, which is the year with the next-lowest SWE. If the record high temperatures of 2020 and the low pre-
cipitation levels of 2019 overlapped, it could lead to the lowest SWE among all results. Kawase et al.15 projected
the reductions in winter precipitation under global warming on the coast of the Sea of Japan and over the Pacific
Ocean in the south of the Japanese archipelago.
Although not record-breaking, the SWEs in the basins of Hokkaido in 2020 were also lower than average,
and the situations in the basins of Hokkaido are different from that in the basins of the SM. In the basins of Hok-
kaido, the temperature is not highest but the precipitation is lower in 2020. In the basins of Hokkaido, average
temperatures were relatively low compared to those in the basins of the SM, so the SWE in the basins of Hokkaido
may be more sensitive to changes in precipitation than to changes in air temperature.
In order to consider the impact of low SWE on water resources, it is necessary to consider the effects of
dams and projections of water demand. As mentioned previously, water usage was restricted in Japan in 2019.
Although the SWE in 2020 was less than that in 2019, the lower SWE in 2020 would not necessarily lead to
decreased water resources because the precipitation in 2020 was greater than that in 2019. It should be noted
that the impacts of low SWE and low precipitation on water resources would not be equivalent, due to the dif-
ference between precipitation occurring as snowfall or rainfall. The impact of the conversion of snowfall to
rainfall on water resources would depend on dams and water demand. Hydrological simulations that consider
the difference between snowfall and rainfall, as well as the effects of dams and water demand, will be important
for further investigations.
Methods
Land surface simulations. Land surface simulations were performed using the Simple Biosphere includ-
ing Urban Canopy model (SiBUC;7), in which water, energy, and radiation budgets on the Earth’s surface are
solved. To drive the model, seven meteorological forcing variables are needed: precipitation; short-wave radia-
tion; long-wave radiation; atmospheric pressure; specific humidity; atmospheric temperature; and wind speed.
Kotsuki et al.6 developed a quasi-real-time system to operate SiBUC-based simulations over Japan. Using this
system, we conducted a continuous simulation from January 1958 to March 2020 with 0.04° horizontal resolu-
tion using Japanese 55-year Reanalysis (JRA55) forcing d ata8. The horizontal resolution of JRA55 was 1.25°, and
was bilinearly interpolated onto the 0.04° considering the topography with 0.04° horizontal resolution following
Kotsuki et al.6.
The snow module in SiBUC follows Sellers et al.16 and was validated by Tanaka et al.17. In the snow module,
the canopy-intercepted snow and ground snow are treated separately. The sum of canopy-intercepted snow and
ground snow is defined as the SWE in this study. The performance of the SiBUC was compared in the Snow
Model Intercomparison Project for forest snow processes (SnowMIP2)18. We performed preliminary SiBUC-
based simulations at seven observational sites to validate the snow module. At the observational sites, snow
depth was measured in addition to the meteorological forcing data. With observational (i.e. reliable) forcing
Scientific Reports | (2020) 10:18541 | https://doi.org/10.1038/s41598-020-75440-8 5
Vol.:(0123456789)www.nature.com/scientificreports/
data, the model appropriately reproduced seasonal evolution in snow water depth (Supplementary Information;
Figure S2 and S3). The results show that the SiBUC simulations forced by JRA55 have the ability to reproduce
past SWE levels.
Severity index. To conduct a long-term comparison over a wide area, an index capable of standardising
characteristics that differ by region is necessary. Therefore, this study introduced a standardised index based
on the idea of the standardised precipitation index (SPI)19, a representative index measuring meteorological
drought. SPI represents the probability distribution of precipitation normalised to a normal distribution. The
value of the SPI illustrates the frequency based on the sigma value of the distribution. While gamma or other
distributions have been used in the SPI, we applied the Box–Cox t ransformation20, which is parametric power
transformation into a Gaussian distribution, instead of fitting a probabilistic distribution. We performed a Box–
Cox transformation to the mean temperature, total precipitation, and total snowfall from January to February
and mean SWE from 1st to 10th March for 1961–2020, which the definition is identical to that used in Fig. 1. The
transformation was conducted for each river basin. Thus, the target variables, mean temperature, total precipita-
tion, total snowfall, and SWE were averaged over each river basin before the transformation. The parameter of
the Box–Cox transformation, which determines the accuracy of transformation, was decided by maximum like-
lihood estimation for each variable and river basin separately. The derived standard deviation from transformed
variables is the index representing the severity in this study. In this index, the probabilities that the absolute value
of the index exceeds 1, 2, or 3 are approximately 16%, 2.5%, and 0.15%, respectively. For example, when evaluat-
ing an area where SWE is low, larger negative values imply less-common weather phenomena. Although three
month or longer is appropriate for SPI measuring meteorological drought, the index in this study uses ten days
for SWE and two months for the other variables because these time period can capture the variability.
Received: 17 April 2020; Accepted: 12 October 2020
References
1. Kuribayashi, M. et al. Comparison of snow water equivalent estimated in central Japan by high-resolution simulations using dif-
ferent land-surface models. SOLA 9, 148–152. https://doi.org/10.2151/sola.2013-033 (2013).
2. Barnett, T., Adam, J. & Lettenmaier, D. Potential impacts of a warming climate on water availability in snow-dominated regions.
Nature 438, 303–309. https://doi.org/10.1038/nature04141 (2005).
3. Hara, M., Yoshikane, T., Kawase, H. & Kimura, F. Estimation of the impact of global warming on snow depth in Japan by the
pseudo-global-warming method. Hydrol. Res. Lett. 2, 61–64. https://doi.org/10.3178/hrl.2.61 (2008).
4. Kawase, H. et al. Altitude dependency of future snow cover changes over Central Japan evaluated by a regional climate model. J.
Geophys. Res. Atmos. https://doi.org/10.1002/2013JD020429 (2013).
5. Kawase, H. et al. Changes in extremely heavy and light snow-cover winters due to global warming over high mountainous areas
in central Japan. Prog. Earth Planet. Sci. 7, 10. https://doi.org/10.1186/s40645-020-0322-x (2020).
6. Kotsuki, S., Takenaka, H., Tanaka, K., Higuchi, A. & Miyoshi, T. 1-km-resolution land surface analysis over Japan: impact of
satellite-derived solar radiation. Hydrol. Res. Lett. 9(1), 14–19. https://doi.org/10.3178/hrl.9.14 (2015).
7. Tanaka, K. Development of the new land surface scheme SiBUC commonly applicable to basin water management and numerical
weather prediction model. vol. 289. Doctoral dissertation, graduate school of engineering, Kyoto university (2004).
8. Kobayashi, S. et al. The JRA-55 reanalysis: general specifications and basic characteristics. J. Meteorol. Soc. Jpn. 93, 5–48. https://
doi.org/10.2151/jmsj.2015-001 (2015).
9. Kawase, H. et al. Simulation of extremely small amounts of snow observed at high elevations over the Japanese Northern Alps in
the 2015/16 winter. SOLA 14, 39–45. https://doi.org/10.2151/sola.2018-007 (2018).
10. Bormann, K. J., Brown, R. D., Derksen, C. & Painter, T. H. Estimating snow-cover trends from space. Nat. Clim. Change 8, 924–928.
https://doi.org/10.1038/s41558-018-0318-3 (2018).
11. Ishizaka, M. Climatic response of snow depth to recent warmer winter seasons in heavy-snowfall areas in Japan. Ann. Glaciol. 38,
299–304. https://doi.org/10.3189/172756404781815248 (2004).
12. Suzuki, H. Long-term changes in snowfall depth and snow cover depth in and around Niigata prefecture from 1927 to 2005: analysis
using data observed at railway stations. Tenki 53, 185–196 (2006) (in Japanese with an English summary).
13. Yoshikane, T., Hara, M., Ma, X., Kawase, H. & Kimura, F. S. Simulated snow water equivalent change between the 1980s and 1990s
in the Sea of Japan side area using a regional climate model. J. Meteorol. Soc. Jpn. 89, 269–282. https://doi.org/10.2151/jmsj.2011-
307(2011) (1980).
14. Ishii, Y. & Suzuki, K. Regional characteristics of variation of snowfall in Japan. J. Jpn. Assoc. Hydrol. Sci. 41, 27–37 (2011) (in
Japanese with an English abstract).
15. Kawase, H., Sasaki, H., Murata, A., Nosaka, M. & Ishizaki, N. N. Future changes in winter precipitation around Japan projected
by ensemble experiments using NHRCM. J. Meteorol. Soc. Jpn. https://doi.org/10.2151/jmsj.2015-034 (2015).
16. Sellers, P. J. et al. A revised land surface parameterization (SiB2) for atmospheric GCMs. Part I: model formulation. J. Clim. 9,
676–705. https://doi.org/10.1175/1520-0442(1996) (1996).
17. Tanaka, K., Kojiri, T., & Nakakita, E.: Assessing the impacts of climate change on the water resources in Japan. In Proceedings of
5th International Conference on Water Resources and Environment Research (2010)
18. Rutter, N. et al. Evaluation of forest snow processes models (SnowMIP2). J. Geophys. Res. 114, D06111. https: //doi.org/10.1029/2008J
D011063 (2009).
19. World Meteorological Organization (WMO). Standardized Precipitation Index User Guide, WMO-No.1090 (2012)
20. Box, G. E. P. & Cox, D. R. An analysis of transformations. J. R. Stat. Soc. B 26(2), 211–252 (1964).
Acknowledgement
This study was supported by the Academic-Industry Collaboration Program “Water cycle data integrator”;
Grants-in-Aid for Scientific Research (18K13834, 18H01543, 18H01549, 18KK0117) from Japan Society for
the Promotion of Science(JSPS); JST PRESTO (MJPR1924); the Program for Integrated Research Program for
Advancing Climate Models (JPMXD0717935498) and Data Integration and Analysis System (DIAS) project
Scientific Reports | (2020) 10:18541 | https://doi.org/10.1038/s41598-020-75440-8 6
Vol:.(1234567890)www.nature.com/scientificreports/
from the Ministry of Education, Culture, Sports, Science, and Technology-Japan (MEXT). S. Kotsuki thanks R.
Nakamura of Chiba University for supporting validation of snow depth simulated by SiBUC.
Author contributions
S.W. and S.K. designed the research. S.K. and K.T. carried out the hydrological simulation. S.W., S.K. and S.K.
carried out analysis. A.H. contributed to the data archive. S.W. and S.K. co-wrote the paper.
Competing interests
The authors declare no competing interests.
Additional information
Supplementary information is available for this paper at https://doi.org/10.1038/s41598-020-75440-8.
Correspondence and requests for materials should be addressed to S.W.
Reprints and permissions information is available at www.nature.com/reprints.
Publisher’s note Springer Nature remains neutral with regard to jurisdictional claims in published maps and
institutional affiliations.
Open Access This article is licensed under a Creative Commons Attribution 4.0 International
License, which permits use, sharing, adaptation, distribution and reproduction in any medium or
format, as long as you give appropriate credit to the original author(s) and the source, provide a link to the
Creative Commons licence, and indicate if changes were made. The images or other third party material in this
article are included in the article’s Creative Commons licence, unless indicated otherwise in a credit line to the
material. If material is not included in the article’s Creative Commons licence and your intended use is not
permitted by statutory regulation or exceeds the permitted use, you will need to obtain permission directly from
the copyright holder. To view a copy of this licence, visit http://creativecommons.org/licenses/by/4.0/.
© The Author(s) 2020
Scientific Reports | (2020) 10:18541 | https://doi.org/10.1038/s41598-020-75440-8 7
Vol.:(0123456789)You can also read