Nutrient removal from artificial bathroom greywater by phycoremediation using Botryococcus sp.
←
→
Page content transcription
If your browser does not render page correctly, please read the page content below
Desalination and Water Treatment                                                                          216 (2021) 338–343
                                                                                                                March
      www.deswater.com
      doi: 10.5004/dwt.2021.26854

Nutrient removal from artificial bathroom greywater by phycoremediation
using Botryococcus sp.

Anwaruddin Wurochekkea,b, Radin Maya Saphira Radin Mohamedc,*, Adel Al-Gheethic,*
a
  Jos Electricity Distribution Plc Address: 9 Ahmadu Bello Way Jos, Plateau State, Nigeria
b
  Micro-Pollutant Research Centre (MPRC), Faculty of Civil Engineering and Built Environment, Universiti Tun Hussein
Onn Malaysia, 86400 Parit Raja, Batu Pahat, Johor, Malaysia
c
 Department of Civil Engineering, Faculty of Civil Engineering and Built Environment, Universiti Tun Hussein Onn Malaysia,
86400 Parit Raja, Johor, Malaysia, Tel. +0607 456 4236; Fax: +607 453 6588; email: maya@uthm.edu.my (R.M.S.R. Mohamed),
Tel. +0607 456 4346; Fax: +607 453 6588; email: adel@uthm.edu.my/adelalghithi@gmail.com (A. Al-Gheethi)

Received 1 March 2020; Accepted 5 November 2020

                                                             abstract
                Bathroom greywater represent the major portion of the total greywater production from the house-
                hold activity. These wastes should be subjected to a treatment process before being discharged
                directly into the environment to avoid the occurrence of the eutrophication phenomenon. Hence,
                the current work aimed to investigate the potential of phycoremediation process for removing
                nutrients from artificial bathroom greywater (ABGW) by Botryococcus sp. The phycoremedia-
                tion process was conducted for 30 d, while the microalgae cell growth in ABGW was measured
                daily. The biokinetic absorption using Michaelis–Menten were determined for NO3–N and PO4–P.
                The results revealed that the maximum microalgae cell growth was recorded on the 10th day with
                2.0 × 10⁶ cells/mL. The highest removal of NO3–N (97%) and PO4–P (87%) were achieved on the 30th
                day of phycoremediation. The biokinetic absorption rate using Michaelis–Menten coefficient were
                K = 0.265 mg NO3–N mg/Chl-a/d and Km = 2.38 mg/L, while for PO4–P were K = 1.057 mg PO4–P mg/
                Chl-a/d and Km = 12.04 mg/L. In conclusion, phycoremediation using Botryococcus sp. exhibited a
                high potential for the nutrients removal from ABGW.
                Keywords: Nitrate-N; Phosphate-P; Biokinetics; Absorption; Personal care products

1. Introduction                                                        showers [2]. Therefore, the removal of nutrients and organic
                                                                       contents is an essential step to avert eutrophication and
    Bathroom greywater is a type of wastewater derived
                                                                       water bloom [3].
from the hand basin, shower, bath, and laundry water
                                                                            Numerous systems operated for the removal of nutri-
and represent 30% of household greywater flow [1]. These
                                                                       ents from greywater and other pollutions. However, these
wastes are rich with the nutrients which lead to cause
                                                                       techniques are expensive and generate elevated thick soft
eutrophication phenomenon in the natural water system
                                                                       mud [4–6]. Natural treatment systems via primary set-
after the discharge process. The nutrients in the greywater
                                                                       tling with cascaded water flow, aeration, agitation, and
are originated from the chemical substances used during
                                                                       filtration [7,8] are less expensive. Yet, there is a lack of
the bathing. Besides, some references indicated that the
                                                                       information when it concerns the removal of nutrients espe-
nutrients also originate from the urine passed during the
                                                                       cially phycoremediation with microalgae Botryococcus sp.

* Corresponding authors.

1944-3994/1944-3986 © 2021 Desalination Publications. All rights reserved.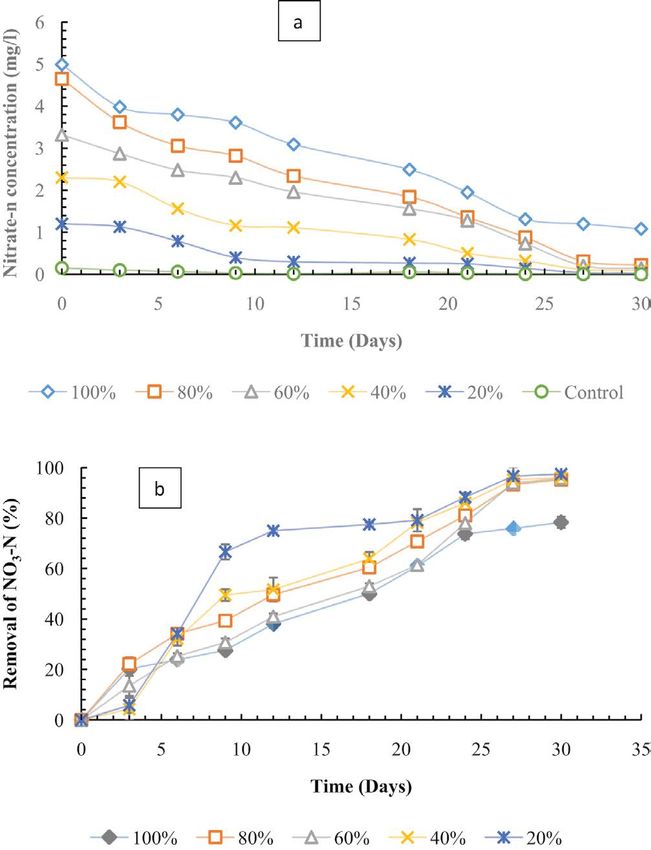
A. Wurochekke et al. / Desalination and Water Treatment 216 (2021) 338–343 339
Greywater management treatment system is a system that Table 1
allows direct utilization of the water. It can use natural grav- Artificial bathroom graywater (ABGW) component
ity by a hybrid treatment process with the use of natural
materials and wetland system. It will facilitate in breaking Parameter Concentrations (mg/L)
down the organic compounds and recovery of nutrients [9]. Soap 0.13
Among several treatment processes for removing nutri-
Detergent 0.97
ents, microalgae through the phycoremediation process is
the most potent due to their capacity to assimilate nutri- Shower gel 0.34
ents. Phycoremediation is an attractive method because Toothpaste 0.37
of their photosynthetic capabilities, changing solar energy Shampoo 0.88
into handy biomasses and embracing nutrients such as pH 6.55
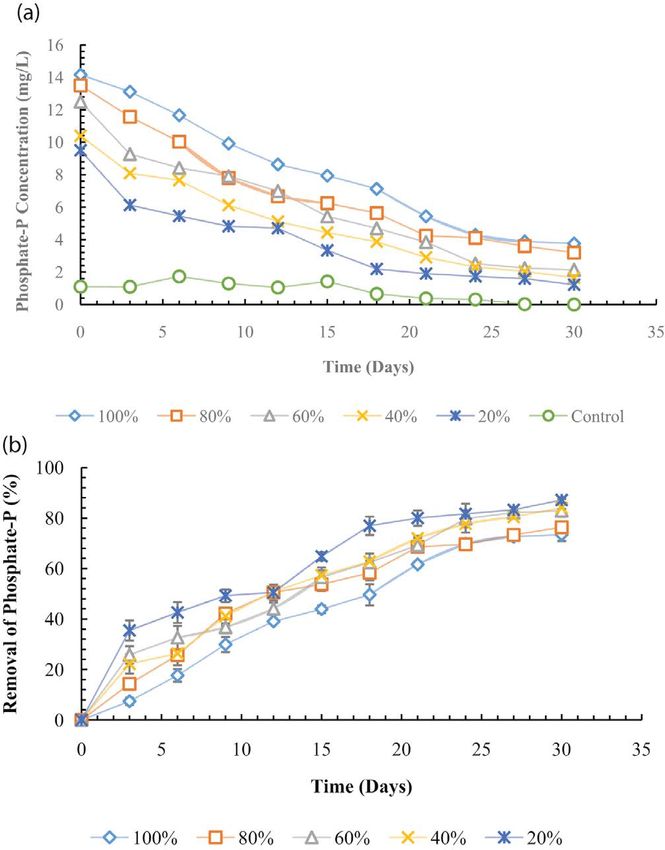
nitrogen and phosphorus which inflicts eutrophication [9].
Phycoremediation process is a green technique used for
removing nutrients from different wastewater as a func- 20%, 40%, 60%, 80%, and 100% and then each dilution was
tion of microalgae such as Botryococcus sp. Due to the high inoculated with 106 cells/mL of Botryococcus sp. cells (each
efficiency of microalgae to assimilate nutrients. Domestic experiment was conducted in triplicate at a different time).
greywater is among different wastewater which is more The ABGW sample (without microalgae inoculation) was
suitable medium for algal growth due to high content of used as control. The inoculated ABGW samples were cov-
carbon, nitrogen, and phosphorus as well as trace elements ered with sterile cotton plugs immediately after the inoc-
necessary for their growth. Nitrogen and phosphorus are ulation and placed under the direction of sunlight (12 h
among the most important nutrients in the greywater and light and 12 h dark) at the ambient temperature for 30 d.
are presented in concentrations ranged between 20 and The concentrations of total nitrogen (TN) and total
40 mg/L for total nitrogen and 50 and 70 mg/L for total phosphorus (TP) were carried out for each sample at the
phosphorus (TP) which lie in the appropriate range for periods of 0, 1, 3, 6, 9, 12, 15, 18, 21, 24, 27, and 30 d. A fixed
microalgae growth. The source of phosphorus in bath- volume (100 mL) from each dilution was transferred from
room greywater is the soap and detergent content used the ABGW and used for determining the final concentra-
by house occupants [7,9]. The phycoremediation with tions of TN and TP according to APHA [13]. The efficiency
microalgae is a really acceptable method because of their of Botryococcus sp. in removing TN and TP from ABGW
photosynthetic capabilities, changing solar energy into bio- was calculated according to Eq. (1).
masses yields, and embracing phosphorus and nitrogen
contents which inflicts eutrophication [9].
R% =
(C 0
− Ci )
× 100% (1)
In the current work, the removal of nutrients from arti- C0
ficial bathroom greywater (ABGW) by phycoremediation
using Botryococcus sp. was investigated. Moreover, the where C0 represents nutrients concentration at the begin-
specific removal rate of the nutrients by Botryococcus sp. ning experiment while Ci represents the nutrients con-
was studied using Michaelis–Menten kinetic model. centration on the day which reading is taken during the
phycoremediation process.
2. Materials and methods
2.2. Biokinetic absorption rate of microalgae Botryococcus sp.
The ABGW with commonly used in the present study
was prepared according to Wurochekke (Table 1) [2]. In this study, ABGW inoculated with microalgae
Botryococcus sp. was selected in this study based on the pre- Botryococcus sp. was used in determining biokinetic coef-
vious studies which exhibited high efficiency for remov- ficients, Km saturation constant and reaction rate constant
ing nutrients from meat processing wastewater [10]. The K using Michaelis–Menten kinetic relationship in Eq. (2)
1 1
microalgae was sub-cultured in bolts basal medium (BBM) [14]. From the experimental data a plot of against
as described by Bischoff and Bold [11]. The medium was Rxi S0
incubated at room temperature (25°C–29°C) for 7 d (12 h yields a slope and intercept on the y-axis and the biokinetic
L:12 h D period with 18–20 MJ/m2/d of solar irradiance). coefficients were calculated:
The microalgae cell biomass was recovered from the culture
medium using a centrifuge (4,020 rcf) washed twice using 1 1 K 1
= + m (2)
sterilized deionized water to remove the residues and then Rxi K K S0
suspended in 10 mL of sterilized normal saline. The concen-
trations of microalgae cells were determined using hemocy- where K is the reaction rate, Rxi is a specific rate of sub
tometer according to APHA [12] and expressed as cell/mL. strate removal, and S is initial substrate concentration.
The Chlorophyll-a (Chl-a) was determined using
spectrophotometer (HACH DR 6000, United States) at
2.1. Phycoremediation of ABGW a wavelength of 664, and 647 according to Jeffrey and
In order to investigate the efficiency of Botryococcus sp. Humphrey [15] using the following formula:
in removing nutrients from ABGW samples, the phycore-
mediation of ABGW was conducted in Erlenmeyer flasks mg
Chl-a = 11.93 E664 − 1.93 E647 (3)
(1 L). The ABGW were diluted with distilled water by L 340 A. Wurochekke et al. / Desalination and Water Treatment 216 (2021) 338–343
where E664 = value of absorbance at wavelength 664 nm; for removing nitrate-N was more than for removing
E647 = value of absorbance at wavelength 647 nm. phosphate-P.
The N and P removal rate was presented as mg of the The Chl-a content increased (from 0.8 to 6.1 mg/L) sig-
nutrient/mg Chl-a/d was used to represent only the live nificantly (P < 0.05) with the increasing of NO3–N concen-
cells, since the counting of microalgae was conducted by trations and associated with Botryococcus sp. growth (Fig. 3).
the light microscope which cannot detect the live and dead This shows the sign of Botryococcus sp. growth in ABGW.
cells. The increasing Chl-a in ABGW indicated for the efficiency
of phycoremediation process in removing nutrients [16].
3. Results and discussion These results are consistent with the previous studies,
Valderrama et al. [17] revealed that Chlorella vulgaris
3.1. Nutrient (nitrate-N and phosphate-P) removal by removed 72% of TN and 28% of TP from the diluted eth-
Botryococcus sp. from ABGW anol and citric acid production effluent, while removed
80% from the high rate algal ponds (HRAP) after 7 d
The phycoremediation of ABGW using Botryococcus
[18]. The researchers in the literature indicated that the
sp. with the different initial of nitrate-N (NO3–N) concen-
microalgae have less affinity to remove phosphate-P in
trations against time for 30 d of batch operation is shown
comparison to nitrate-N. Lee and Lee [19] found that
in Figs. 1a and b. The NO3–N was removed by 96% and
Chlorella kessleri removed between 8% and 20% of phos-
97% from the ABGW at 2.3 and 1.2 mg/L of initial con-
phorus. However, the experimental data obtained in this
centrations in 40% and 20% of ABGW dilution. Similarly,
study revealed that phosphate-P was better removed for
NO3–N the removal efficiency was 95% at 4.65 and
80% ABGW (dropped from 13.5 to 3.19 mg/L in 30 d). Aslan
3.32 mg/L in 80% and 60% of ABGW dilution respectively.
and Kapdan [14] recorded 78% of phosphate-P removal
However, the removal efficiency further decreased to 78%
from synthetic wastewater.
at 4.99 mg/L in 100% ABGW dilution.
The final phosphate-P concentration was 1.22 mg/L
with 87% of the removal efficiency at 9.5 mg/L of the ini- 3.2. Biokinetic coefficients, nitrate-N, and phosphate-P specific
tial concentrations in 20% ABGW. In the 100% ABGW, the removal rate and yield coefficients from ABGW
removal efficiency dropped to 73% (Figs. 2a and b). The
The specific removal rate of NO3–N with varying
results revealed that the efficiency of Botryococcus sp.
NO3–N concentrations is depicted in Fig. 4. The removal
Fig. 1. (a) Nitrate-N final concentration and (b) removal percent- Fig. 2. (a) Final concentrations of phosphate-P in ABGW and
age of nitrate-N from ABGW. (b) removal percentage.A. Wurochekke et al. / Desalination and Water Treatment 216 (2021) 338–343 341
7 0.7
y = 0.024x + 0.227
6
0.6 R² = 0.445
Chl a concentrations (mg/L)
Specific PO4 Removal Rate (mg/mg chl a/day)
5
0.5
4
3 0.4
2
0.3
1
0.2
0
0 1 2 3 4 5 6
0.1
NO3-N concentrations (mg/L)
0
Chl ai Chl af
6 8 10 12 14 16
Fig. 3. Variation of Chl-a content with initial nitrate-N (PO4-P)o mg/L
concentration.
Fig. 5. Effects of initial PO4–P on specific PO4–P removal rate.
0.25
Specific NO3 Removal Rate (mg/mg chl a/day
y = 0.030x + 0.044
From the linear lineweaver–Burke plot transformed in
0.2 R² = 0.845 1 1
Eq. (2), the plot between 1/Rxi against and is
NO − N OP 4
−P
0.15 shown in Figs. 6 and 7. The equations of the straight line for
K 1
0.1
the slope and intercept m and were determined. The
K K
kinetic coefficients for NO3–N removal in ABGW and uptake
0.05 (Fig. 6) by Botryococcus sp. were determined as a reaction
rate constant (K) of 0.256 mg NO3–N mg/Chl-a/d and a
0 saturated constant (Km) of 2.38 mg/L (R2 = 0.83). Similarly,
0 1 2 3 4 5 6 experimental data from PO4–P removal rate (Fig. 7) from
(NO3-N)o mg/L the best fit regression line were determined as a reaction
rate constant (K) of 1.057 mg PO4–P mg/Chl-a/d and satu-
Fig. 4. Effect of initial NO3–N on specific NO3–N removal rate. ration constant (Km) of 12.04 mg/L from the intercept and
the slope (R2 = 0.94). Therefore, the NO3–N and PO4–P sub-
strate removal rates in this study were in line with those
rate increased by increasing in the initial NO3–N concen- reported by Aslan and Kapdan [16]. Thus, the low value
trations. The maximum rate reached was 0.22 mg/mg Chl- of Km in NO3–N over PO4–P means the enzyme has a high
a/d in the concentration from 1.2 to 5 mg/L. The specific affinity with the substrate. Hence, if Km is small, enzymes
PO4–P removal rate increased from 0.02 mg/mg Chl-a/d will reach the maximum catalytic efficiency at low sub-
to around 0.64 mg/mg Chl-a/d for the PO4–P concentra- strate levels. This means optimum nutrient removal or
tions between 9.5 and 14.16 mg/L (Fig. 5). The substrate uptake by Botryococcus sp. occurs in low strain greywater.
(nutrient) removal rates were reported in previous studies For all NO3–N and PO4–P removal, the plot of Chl-a
instead of specific removal rates. produced against substrate depleted is shown in Figs. 8
The maximum values attained in Aslan and Kapdan and 9. The slope gives a yield coefficient for NO3–N (YN)
[14] study were 3.0 mg/mg Chl-a/L/d and 0.52 mg/mg Chl- and PO4–P (YP). The calculated YN was 0.36 mg Chl-a/mg
a/d for NH4–N and PO4–P using C. vulgaris. In another NO3–N (R2 = 0.8358) and the YP was 1.18 mg Chl-a/mg
study, the nitrogen and phosphorus removal rates by PO4–P (R2 = 0.0954). The coefficient (R2) is located between
C. vulgaris were 5.44 and 1.30 mg/L d, respectively [20]. 80% and 90% not very close to 100, might be due
Wong and Tam [21] reported that the removal rates of to the distribution of the raw data.
Chlorella pyrenoidosa as 3.4 mg N/L d and 10.7 mg P/L d. The kinetics of the nutrient uptake model is different
However, significantly higher removal rates of 20.83 mg from other models that are basically on an exponential
P/L d and 83 mg N/L d for suspended growth culture of growth phase. A kinetic nutrient uptake model is derived
Scenedesmus intermedius and 10.15 mg P/L d and 56.06 mg using the same data, but focuses on nutrient uptake rates.
N/L d for Nannochloris sp. were reported by Martínez et al. The kinetic coefficients K and Km in this study were calcu-
[22]. However, the disparity in the result of this study and lated from the overall uptake measurement that reflects
previous studies could be due to differences in wastewa- the substrate carrier ability of Botryococcus sp. Thus, it
ter strain, there is high pollution in wastewater compared demonstrated that NO3–N and PO4–P uptake by Botryococcus
to greywater as well as different microalgae species used. sp. can be described using Michaelis–Menten kinetics [14].342 A. Wurochekke et al. / Desalination and Water Treatment 216 (2021) 338–343
14 3
y = 9.302x + 3.906 y = 0.688x - 2.317
12 R² = 0.840 2.5 R² = 0.835
(chl af- chl ao) mg/L
10
2
8
1/Rxi
1.5
6
1
4
2 0.5
0 0
0 0.1 0.2 0.3 0.4 0.5 0.6 0.7 0.8 0.9 4 4.5 5 5.5 6 6.5 7
1/NO3-N (NO3-No-NO3-Nf) mg/L
Fig. 6. Determination of kinetic coefficients, Km and K for NO3–N Fig. 8. Determination of yield coefficient for NO3–N uptake
removal. by Botryococcus sp.
2.5 8
y = 11.39x + 0.946
R² = 0.579 7 y = -0.502x + 8.099
2 R² = 0.095
6
Chl a 0- Chl a f) mg/L
5
1.5
1/Rxi
4
1
3
2
0.5
1
0 0
0.04 0.05 0.06 0.07 0.08 0.09 0.1 0.11 0.12 4 4.2 4.4 4.6 4.8 5 5.2 5.4 5.6 5.8
1/PO4-P (PO4 -Po-PO4-P f) mg/L
Fig. 7. Determination of kinetic coefficients, Km and K for Fig. 9. Determination of yield coefficient for PO4–P uptake by
PO4–P removal. Botryococcus sp.
Furthermore, Michaelis–Menten kinetics was used to des and its size. In this case, microalgae cell size is associated
cribe nitrate in higher plants like rice [22]. with an increase in Km value [24]. This would create more
The present study established an uptake relationship uptake sites thereby increasing the rate of nutrient uptake.
with NO3–N, the reaction rate constant K of 0.46 mg/Chl- From this study, the Km values were relatively high for both
a/d and a saturation constant or maximum uptake rate or NO3–N and PO4–P possibly due to Botryococcus sp.’s com-
Michaelis–Menten constant Km of 5.75 mg/L. The uptake rates petitive ability with respect to cell size. This implies that
of PO4–P are K of 8.53 mg/Chl-a/d and Km of 176.88 mg/L. It Botryococcus sp. are better competitors with a good uptake
is paramount to note that this model demonstrated a nutri- rate (K). Therefore, the model developed from this study
ent limited uptake rate and not a nutrient limited growth is a representation of complex interacting components.
rate. In addition, Aslan and Kapdan [14] reported a K of The selection of algal species, interspecies differentiation,
1.5 mg NH4–N mg Chl-a/d, Km of 31.5 mg/L and K of 0.5 mg bioreactor size, type, and media composition of greywa-
PO4–P mg Chl-a/d and Km of 10.5 mg/L. These reported ter, light source, temperature, pH, and CO2 concentration
results are different from the results of this study due to sub- will all have an effect on the maximum uptake rate and
strate difference as ABGW was used in this study. Fiksen et reaction rate constant developed for nitrate-N and phos-
al. [23] stated that a higher Km value is associated with an phates-P above. Hence, if Chl-a and substrate concentra-
increase in competitive ability for nutrient concentration. tions were measured, the calculation steps outlined in
The microalgae Botryococcus sp. need to adapt to the com- the results can be easily applied to a larger scale.
position of bathroom greywater during the phycoremedia-
tion process. Thus, the competitive ability of Botryococcus
4. Conclusion
sp. in ABGW might be lower during the early stages of
inoculation but will later increase at an exponential rate The biokinetic coefficients of NO3–N absorption from
thereby increasing the uptake of nutrients. This exponen- experimental data were determined as K = 0.256 mg
tial growth is due to the proliferation of the microalgae cells NO3–N mg/Chl-a/d and Km = 2.38 mg/L (R2 = 0.83) andA. Wurochekke et al. / Desalination and Water Treatment 216 (2021) 338–343 343
PO4–P coefficients were K = 1.057 mg PO4–P mg/Chl-a/d [8] B.L. Pangarkar, S.B. Parjane, M.G. Sane, Design and economical
and Km = 12.04 mg/L (R2 = 0.94). According to these results, performance of gray water treatment plant in rural region,
World Acad. Sci. Eng. Technol., 4 (2010) 782–786.
it proves the potentiality of microalgae Botryococcus sp. as
[9] N. Abdel-Raouf, A.A. Al-Homaidan, I.B.M. Ibraheem,
a successful technique to eliminate nutrients in bathroom Microalgae and wastewater treatment, Saudi J. Biol. Sci.,
greywater. Moreover, in order to explain the efficiency 19 (2012) 257–275.
of Botryococcus sp. in removing the nutrients the removal [10] V. Abirama, R.M.S.R. Mohamed, A. Al-Gheethi, M. Abdul
mechanism should be investigated. Malek, A.H.M. Kassim, Meat processing wastewater phycor
emediation by Botryococcus sp.: a biokinetic study and a techno-
economic analysis, Sep. Sci. Technol., (2020) 1–15.
Acknowledgments [11] H.C. Bischoff, Some Soil Algae from Enchanted Rock and
Related Algal Species, Phycological Studies IV, University of
The authors acknowledge the Ph.D. thesis of Wurochekke Texas Publication No. 6318 6318, 1963, pp. 1–95.
Anwaruddin Ahmed (2017). Phycoremediation of Artificial [12] APHA, Standard Methods for the Examination of Water and
Bathroom Greywater in Village Houses using Microalgae Wastewater, 21st ed., American Public Health Association/
American Water Works Association/Water Environment
Botryococcus sp. PhD. UTHM.) from which this man- Federation, Washington D.C., 2005.
uscript is derived. The authors would like to thank the [13] APHA, AWWA, WPCF, WEF, Standard Methods for the
Ministry of Education Malaysia (KPM) for providing the Examination of Water and Wastewater, Vol. 2, American Public
Fundamental Research Grant Scheme (FRGS) with refer- Health Association, American Water Works Association, Water
ence code: FRGS/1/2019/WAB05/UTHM/02/5 (Modification Pollution Control Federation, Water Environment Federation,
1915.
of Bead Adsorbents with Ceramic Sanitary Ware Waste [14] S. Aslan, I.K. Kapdan, Batch kinetics of nitrogen and
(CSWW) and Chitosan for Laundry Greywater (LGW) Safe phosphorus removal from synthetic wastewater by algae, Ecol.
Disposal) and contract grant H377 as financial support for Eng., 28 (2006) 64–70.
this research project. [15] S.W.T. Jeffrey, G.F. Humphrey, New spectrophotometric
equations for determining chlorophylls a, b, c1 and c2 in higher
plants, algae and natural phytoplankton, Biochem. Physiol.
References Pflanzen, 167 (1975) 191–194.
[16] P.J.D. Janssen, M.D. Lambreva, N. Plumeré, C. Bartolucci,
[1] G.A. Edwin, P. Gopalsamy, N. Muthu, Characterization of A. Antonacci, K. Buonasera, R.N. Frese, V. Scognamiglio,
domestic gray water from point source to determine the G. Rea, Photosynthesis at the forefront of a sustainable life,
potential for urban residential reuse: a short review, Appl. Front. Chem., 2 (2014), doi: 10.3389/fchem.2014.00036.
Water Sci., 4 (2014) 39–49. [17] L.T. Valderrama, C.M. Del Campo, C.M. Rodriguez,
[2] A.A. Wurochekke, R.M.S. Mohamed, A.A. Al-Gheethi, L.E. de-Bashan, Y. Bashan, Treatment of recalcitrant wastewater
H. Atiku, H.M. Amir, H.M. Matias-Peralta, Household from ethanol and citric acid production using the microalga
greywater treatment methods using natural materials and Chlorella vulgaris and the macrophyte Lemna minuscula, Water
their hybrid system, J. Water Health, 14 (2016) 914–928. Res., 36 (2002) 4185–4192.
[3] N.M. Jais, R.M.S.R. Mohamed, A.A. Al-Gheethi, M.K. Amir [18] C. Li, H. Yang, X. Xia, Y. Li, L. Chen, M. Zhang, L. Zhang,
Hashim, The dual roles of phycoremediation of wet market W. Wang, High efficient treatment of citric acid effluent by
wastewater for nutrients and heavy metals removal and Chlorella vulgaris and potential biomass utilization, Bioresour.
microalgae biomass production, Clean Technol. Environ. Technol., 127 (2013) 248–255.
Policy, 19 (2017) 37–52. [19] K. Lee, C.-G. Lee, Effect of light/dark cycles on wastewater
[4] A. Ruiz-Marin, L.G. Mendoza-Espinosa, T. Stephenson, Growth treatments by microalgae, Biotechnol. Bioprocess Eng., 6 (2001)
and nutrient removal in free and immobilized green algae in 194–199.
batch and semi-continuous cultures treating real wastewater, [20] P.S. Lau, N.F.Y. Tam, Y.S. Wong, Operational optimization of
Bioresour. Technol., 101 (2010) 58–64. batchwise nutrient removal from wastewater by carrageenan
[5] K.G. Pavithra, P. Senthil Kumar, P. Sundar Rajan, A. Saravanan, immobilized Chlorella vulgaris, Water Sci. Technol., 38 (1998)
M. Naushad, Sources and impacts of pharmaceutical 185–192.
components in wastewater and its treatment process: a review, [21] Y.-S. Wong, N.F.Y. Tam, Wastewater Treatment with Algae,
Korean J. Chem. Eng., 34 (2017) 2787–2805. 1st ed., Springer Verlag, Berlin, Heidelberg, New York, NY, 1998.
[6] S. Muthusaravanan, N. Sivarajasekar, J.S. Vivek, S. Vasudha [22] M.E. Martínez, J.M. Jiménez, F. El Yousfi, Influence of
Priyadharshini, T. Paramasivan, N. Dhakal, M. Naushad, phosphorus concentration and temperature on growth and
Research Updates on Heavy Metal Phytoremediation: phosphorus uptake by the microalga Scenedesmus obliquus,
Enhancements, Efficient Post-Harvesting Strategies and Bioresour. Technol., 67 (1999) 233–240.
Economic Opportunities, M. Naushad, E. Lichtfouse, Eds., [23] Ø. Fiksen, M.J. Follows, D.L. Aksnes, Trait‐based models of
Green Materials for Wastewater Treatment, Springer, Cham, nutrient uptake in microbes extend the Michaelis‐Menten
2020, pp. 191–222. framework, Limnol. Oceanogr., 58 (2013) 193–202.
[7] S.B. Parjane, M.G. Sane, Performance of grey water treatment [24] H. Hasegawa, M. Ichii, Variation in Michaelis–Menten kinetic
plant by economical way for Indian rural development, parameters for nitrate uptake by the young seedlings in rice
Int. J. ChemTech Res., 3 (2011) 1808–1815. (Oryza sativa L.), Jpn. J. Breed., 44 (1994) 383–386.You can also read