FLOATING TREATMENT WETLANDS: A NEW TOOL FOR NUTRIENT MANAGEMENT IN LAKES AND WATERWAYS - CanadianPond
←
→
Page content transcription
If your browser does not render page correctly, please read the page content below
FLOATING TREATMENT WETLANDS: A NEW TOOL FOR
        NUTRIENT MANAGEMENT IN LAKES AND WATERWAYS

      Chris C. Tanner, James Sukias, Jason Park, Charlotte Yates and Tom Headley*

                              NIWA, PO Box 11-115, Hamilton
*
    Current Address: Helmholtz Centre for Environmental Research (UFZ), Leipzig, Germany.
                                 Emailc.tanner@niwa.co.nz

Abstract
Floating treatment wetlands (FTWs) employing emergent aquatic plants growing on a
buoyant mat are an innovative new tool for nutrient management in ponds, lakes and slow-
flowing waters. Plant roots grow through the floating mat and into the water beneath,
providing a large surface area for nutrient assimilation, growth of biofilms and entrapment of
fine suspended particulates. By shading the surface and buffering water turbulence FTWs can
also promote settling of suspended algae and solids beneath the mats. Microbial nutrient
removal processes, such as nitrate conversion to N gases via denitrification, may also be
stimulated through creation of localized anoxic zones beneath the mats. The ability of FTWs
to be used on deep water bodies and to tolerate wide fluctuations in water depth, means they
can be used to retrofit wetland treatment components into existing retention ponds, or used
directly as nutrient management tools in ponds, lakes and waterways. Nutrient removal rates
recorded in batch and flow-through mesocosm trials are reported. They appear to equal or
exceed those reported under comparable conditions for conventional surface-flow wetlands.

Introduction
Floating treatment wetlands (FTWs) are an innovative new tool for nutrient management in
ponds, lakes and slow-flowing waters (Headley and Tanner 2011). They involve emergent
wetland plants growing on tethered buoyant mats or rafts on the water surface (Figure 1).

     Figure 1: Cross-section of FTWs in a treatment pond (from Headley and Tanner, 2011).

                                              1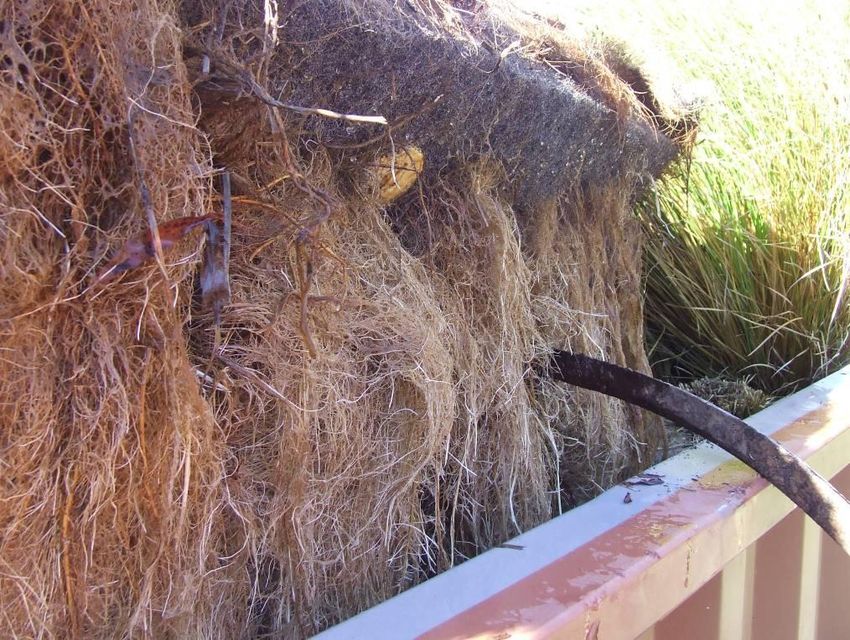
The plant roots grow through the floating mat and into the water below. As well as
assimilating nutrients directly from the water column (rather than the bottom sediments), the
roots provide a large surface area for adsorption and biofilm attachment (Tanner and
Headley, 2011). Because FTWs can tolerate deep and fluctuating water levels, they can be
used in situations where use of conventional surface-flow wetlands with bottom-rooted
emergent aquatic macrophytes would be precluded. As such, FTWs integrate the nutrient
attenuation capabilities of wetlands with the flexibility of deeper pond systems, and so
expand the range of situations where wetland ecotechnologies can be applied for water
quality enhancement.

This paper briefly introduces the key elements of this novel new ecotechnology and
summarises the results of two recent New Zealand studies evaluating their nutrient removal
performance treating eutrophic lake and stream waters. Results of both batch- and flow-
through mesocosm studies are presented. Previous studies have focused primarily on their
potential for treatment of key contaminants in urban stormwaters (Headley and Tanner 2006,
2008, 2011; Tanner and Headley, 2011).

Methods
Batch mesocosms
A series of batch-loaded mesocosm experiments were conducted in 0.7m3 tanks at the
Ruakura Agricultural Research Centre, Hamilton, New Zealand over the summer period from
December 2007 to February 2008. The tanks were supplied with artificial lake water with
nutrients concentrations similar to those found in eutrophic lakes. The FTW treatments
consisted of squares of a fibrous polyester mat injected with expanded polyurethane to
provide buoyancy (0.6 m × 0.6 m, BioHavenTM Floating Islands, Floating Island
International, Sheperd, Montana, USA) (Figures 2 & 3). The centre of the mats were filled
with a growth medium (8 cm deep) consisting of sand, peat and compost (1:2:1), and planted
with one of three native emergent wetland macrophyte species (Cyperus ustulatus, CU;
Juncus edgariae JE; or Schoenoplectus tabernaemontani, ST). These planted mats had been
established over a period of 20 months and so had shoots extending 0.5-0.8m above the mats,
and well developed root systems extending ~0.5 m beneath the mats. The control treatment
comprised a 0.6 x 0.6 m square of plastic sheeting suspended over the mesocosm water
surface, providing a similar area of shading to that of the floating mats. All treatments were
replicated (n=3). After two initial screening trials, changes in nutrient levels and physico-
chemical conditions in the mesocosms were monitored over four consecutive seven day
batches with nitrogen supplied as either nitrate and ammonium or as nitrate alone (± organic
carbon). Only the results of the first three experiments (without organic matter
supplementation) will be discussed here; full experimental details are provided in Park et al.
(2009) and Sukias et al. (2010a).

Flow-through mesocosms
Flow-through mesocosm trials were carried out on the southern shores of Lake Rotoehu, near
Rotorua. The mesocosms comprised a modified steel shipping container split longitudinally
to form two parallel mesocosm tanks, and coated with a non-toxic, epoxy coating (Fig. 4).
One tank received a low inflow rate (110 mm d-1) and one a high inflow rate (270 mm d-1) of
water pumped from the Maero Stream before it entered the lake. These hydraulic loading
rates correspond to nominal hydraulic retention times of 9.4 and 3.6 days, respectively.
Sediments collected from the lake were placed in the bottom of the tanks and pre-established
FTWs planted with native sedges (Carex virgata and Cyperus ustulatus) were placed on the
water surface. The FTWs used were 150 mm thick fibrous polyester mats injected with

                                              2
patches of buoyant polyurethane foam (Floating Islands, Kauri Park, Kaiwaka, NZ). In this
case plants were established directly into the mat matrix without any other growth media. The
trial operated for a period of about a year, including a three month period of establishment
followed by nine months of monthly water quality sampling August 2009—May 2010. Full
details of experimental methods are outlined in Sukias et. al. (2010b).

                                                           Growth
                                                           medium

                                                             0.6 x 0.6 m
                                                             floating mat
                 0.7 m depth

                                                                Filling/
                                                               emptying
                                                                 pipe

                                     1.0 m

Figure 2: Cross section of the batch-fed experimental mesocosm tanks showing key
components.

Figure 3: Batch-fed mesocosm tanks showing FTWs planted with Cyperus ustulatus, Juncus
edgariae and Schoenoplectus tabernaemontani (left to right).

                                             3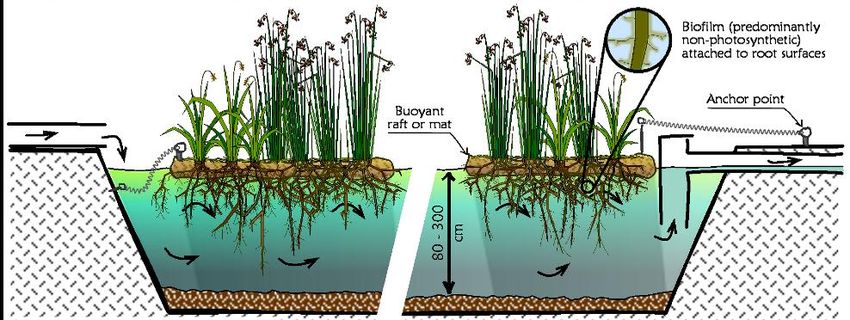
Figure 4: Flow-through mesocosm tanks at Rotoehu showing establishing FTWs.
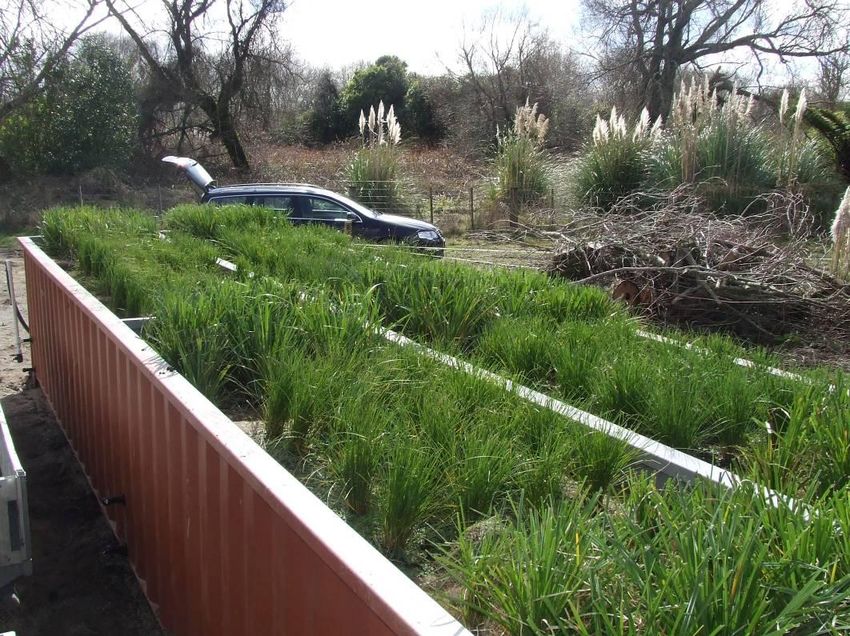
Figure 5: View of the extensive subsurface root development in the flow-through mesocosms
by the end of the trial ( FTWs temporarily raised out of the water).
4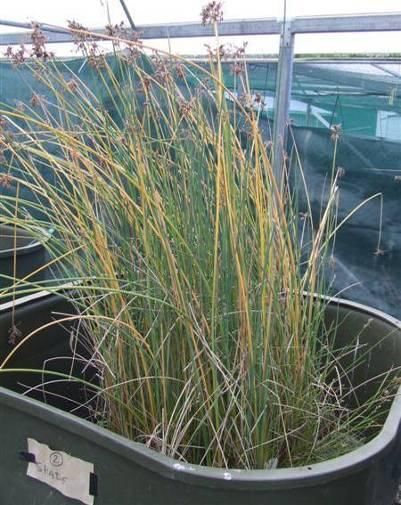
Results
Batch-fed mesocosms
Ammonium-N, oxidized –N and Total N concentrations all declined gradually during the
week-long batch trials, with highest removal rates in the planted FTW treatments (e.g. Fig.
6). Areal TN mass removal rates of 638-762 mg/m3/d were recorded for the FTW treatments
over the initial 3 days of the experiments (means of experiments 1-3).

DRP and TP concentrations also declined steadily during the batch trials, with greater
removal generally observed in the FTW treatments, particularly those planted with
Schoenoplectus tabernaemontani. Areal TP mass removal rates of 54-58 mg/m3/d (means of
experiments 1-3) were recorded for the FTW treatments over the initial 3 days.

Lower rates of N and P removal occurred in the control treatments without FTWs. Elevated
daytime pH and dissolved oxygen concentrations recorded in these mesocosms, suggest that
significantly higher levels of algal photosynthesis were occurring than in the mesocosms with
FTWs. Thus it is likely that nutrient removal in these control mesocosms would have been
occurring predominantly through algal uptake. Despite provision of an equivalent area of
shading of the water surface,it became evident during the experiment that the emergent plants
growing on the FTWs were casting greater shade, reducing light availability to algae growing
in the water column and on the walls of the mesocosm tanks. Plants and microbes associated
with the FTWs would also have competed for nutrient uptake with algae.

Flow-through mesocosms
Marked reductions in concentrations of nitrate-N and DRP were recorded over the 9 month
monitoring period in the outflows of the FTW mesocosms compared to the inflows (Figs 6
and 7). These highly biologically available forms, which dominated the N and P loads
entering the mesocosms from the Maero Stream (76% of TP and 95% of TN; Table 1), were
reduced by 70% and 82% for DRP and 57% and 92% for NO3-N in the high and low-loaded
mesocosms respectively.

Complete concentration and mass removal data for all measured forms of P and N are
summarised in Table 1. While the lower-loaded mesocosm showed greater concentration
reductions, the high loaded system removed approximately twice the mass of DRP and TP
and ~1.5 times greater mass of nitrate-N and TN than the low loaded tanks (Table 1). Overall
TP and TN removal was always lower than for the DRP and NO3-N, because of generation of
particulate organic matter and NH4-N within the FTW systems.

                                             5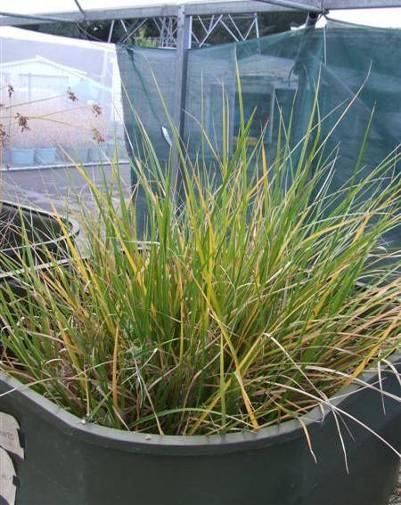
TN                                                            Ammonium                                   Oxidised Nitrogen
                2500
                                                                            Control
                                                                                                                             Control                                   Control
                                                                            JE
                2000                                                                                                         JE                                        JE
                                                                            ST
                                                                                                                             ST                                        ST
                                                                            CU
mg N m-3

                                                                                                                             CU                                        CU
                1500

                1000

                        500

                         0
                              0        1       2       3        4       5       6       7       0   1   2   3     4      5      6      7   0   1    2   3     4    5     6       7

                                                           Days                                                 Days                                        Days

                                  TP                                                            DRP
                         250
                                                                                    Control                                     Control
                         200                                                        JE                                          JE
                                                                                    ST                                          ST
           (mg P m-3)

                         150                                                        CU                                          CU
                                                                                                                                               Figure 6:Removal key forms of N
                                                                                                                                               and P in batch-loaded tanks with
                         100                                                                                                                   control and planted FTWs (JE =
                                                                                                                                               Juncus edgariae, ST=
                          50                                                                                                                   Schoenoplectus tabernaemontani,
                                                                                                                                               CU = Cyperus ustilatus.
                                                                                                                                               (Experiment 1, Park et al. 2008;
                              0
                                  0        1       2       3        4       5       6       7   0   1   2   3        4   5       6     7       Sukias et al, in prep.)

                                                               Days                                             Days

                                                                                                                 6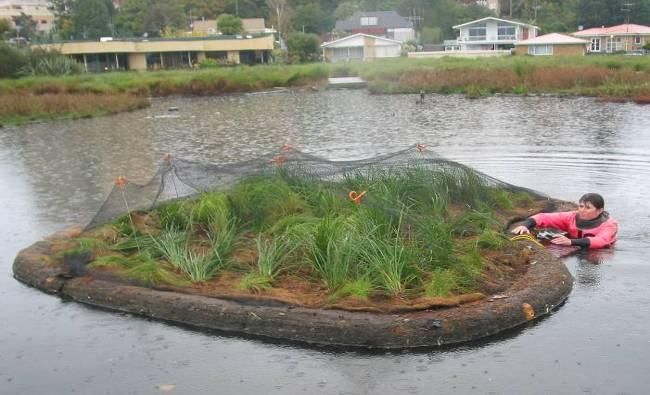
Table 1: Summary of mean nutrient concentrations (± standard deviation), mass loadings/removals and percentage removal for the flow-through
FTW mesocosms at Rotoehu.

                   Variable                                         High loading                             Low loading
                                                        inflow        outflow      removal      inflow         outflow          removal
                                               -3
DRP                    Concentration (mg m )           51 (±12)      15 (± 11)       70%       51 (±12)         9 (± 7)           82%
                  Areal mass loading/removal               13           3.9          8.9          4.9             0.9             4.1
                            rate (mg m-2 day-1)
                Mass loading/ removal* (g m-2)            3.3           1.0          2.3          1.2             0.2             1.0
TP                     Concentration (mg m-3)          67 (± 14)     46 (± 26)      32%        67 (± 14)       43 (± 37)         35%
                  Areal mass loading/removal               17           12           5.4          6.5             4.2             2.3
                            rate (mg m-2 day-1)
                Mass loading/removal* (g m-2)              4.3           2.9         1.4          1.6             1.1             0.6
NH4-N                  Concentration (mg m-3)           9 (± 7)       32 (± 9)     increase     9 (± 7)        36 (± 25)        increase
                  Areal mass loading/removal              2.3           8.2          -5.8         0.9             3.5             -2.6
                            rate (mg m-2 day-1)
                Mass loading/removal* (g m-2)            0.6            2.1         -1.5         0.2              0.9            -0.7
NO3-N                  Concentration (mg m-3)         1976 (± 60)   850 (± 293)     57%       1976 (± 60)     158 (± 134)        92%
                  Areal mass loading/removal              502           216          286         193              15              178
                            rate (mg m-2 day-1)
                Mass loading/ removal* (g m-2)          126.5          54.4         72.1         48.6             3.8            44.8
TN                     Concentration (mg m-3)         2078 (± 57)   1136 (± 434)    45%       2078 (± 57)     473 (± 179)        77%
                  Areal mass loading/removal              528           289          239         203              46              157
                            rate (mg m-2 day-1)
                 Mass loading/removal*(g m-2)            133.1          72.8        60.3         51.2            11.6             39.6
*Cumulative removal over the ~9 month (252 d) monitoring period.

                                                                               7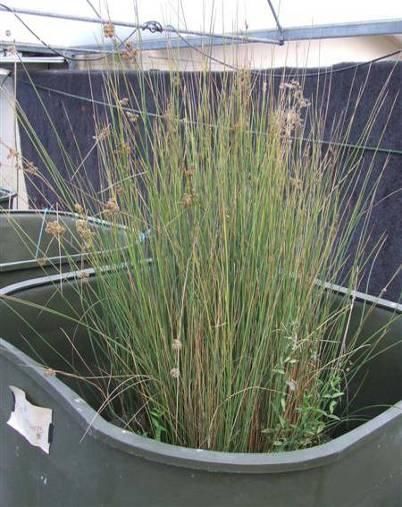
TP
40 40
30 30
20 20
10 10
0 0
g g
9 9 9 9 9 0 0 0 0 0 low din din
g/ 0 p/ 0 t/0 v/0 c /0 n/ 1 b/ 1 r/1 r/1 y/1 I nf oa loa
Au Se Oc No De Ja Fe Ma Ap Ma l
DRP H igh Lo
w
110 110
100 Inflow 100
High Loading
90 90
Low Loading
80 80
DRP (mg/m )
3
70 70
60 60
50 50
40 40
30 30
20 20
10
2400 10
2400
0
2200 0
2200
g g
2000
/ 09 9 9 9 / 09 0 0 0 0 0 low din din
2000
ug p/ 0 t/0 v/0 c n/ 1 b/ 1 r/1 r/ 1 y/1 I nf oa loa
A1800 Se Oc No De Ja Fe Ma Ap Ma hl w 1800
g Lo
1600 Hi 1600
TN(mg/m )
3
1400 1400
1200 1200
Figure 7. DRP concentrations in the inflows and outflows of the high- and low-loaded flow-
1000 1000
800 800
through FTW mesocosms at Rotoehu. The boxplots to the right provide a summary of the
600 600
data for the nine month sampling period; maximum and minimum values are delineated by
400 400
the whiskers, the boxes delineate the 25 and 75 percentiles, and the central horizontal line
200 200
0 0
shows the9
median.
9 9 9 0 0 0 0 w g g 9 0 lo din din
g/ 0 p/ 0 t/0 v/0 c/0 n/ 1 b/ 1 r/1 r/1 y/1 I nf oa
Au Se Oc No De Ja Fe Ma Ap Ma l loa
H igh L ow
NO3-N
2400 2200
2200 2000
2000 1800
1800 1600
NO3-N (mg/m )
3
1600 1400
Inflow
1400
High Loading 1200
1200 Low Loading 1000
1000
800
800
600 600
400 400
200 200
0 0
g g
/ 09 / 09 t/0
9 9 / 09 0 0 0 0 0 low din din
g p v/0 c n/ 1 b/ 1 r/ 1 r/1 y/1 I nf oa loa
Au Se Oc No De Ja Fe Ma Ap Ma hl w
g Lo
Hi
80 80
Figure 8. Nitrate-N concentrations in the inflows and outflows of the high- and low-loaded
70 70
flow-through FTW mesocosms at Rotoehu. Other details as for Fig.8.
60 60
NH4-N (mg/m )
3
50 50
Discussion
40 40
The results
30 of both the static and flow-through trials show FTWs are capable of removing30
substantial
20 quantities of nutrients from waters with nutrient levels similar to those found
20 in
diffuse10 agricultural run-off and eutrophic lakes. Hubbard (2010) and Van de Moortel 10at al.
(2010)0 have also reported enhanced nutrient removal from wastewaters in the presence 0
of
FTWs. 09 09 09 09 9 10 10 10 10 10 low in g in g
g/ p/ t/ v/ c /0 n/ b/ r/ r/ y/ I nf d d
Au Se Oc No De Ja Fe Ma Ap Ma loa loa
gh Lo
w
Hi
Finding directly comparable field data for conventional surface-flow wetlands is difficult, as
the form of nutrients, and their concentration and loading rate greatly affect removal rates. In
a review of 72 surface-flow wetlands receiving nitrate-rich inflows, Kadlec and Wallace
(2009) report a median nitrate load removal of 140 g m-2 d-1, which is slightly less than that
8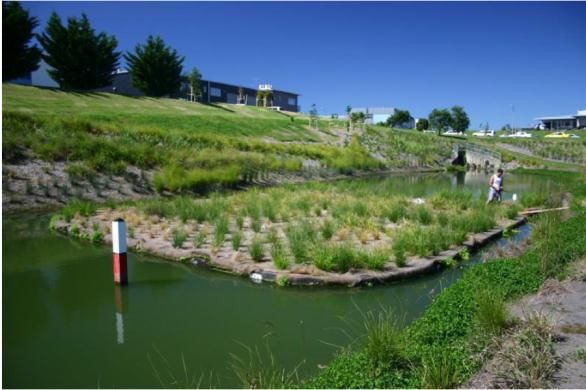
reported here (at lower nitrate loadings) for the flow-through study. Mitsch et al. (2005) have
summarised nitrate removal from river waters in the Mississippi River Basin for 12 wetland
systems (total of 48 wetland years), defining an empirical relationship between the mass
inflow and percentage nitrate-N mass removal. At equivalent loading rates, the percentage
nitrate mass loads removed by the FTWs in the present study were in the high range recorded
for these systems. These results suggest that the FTWs in the present study were exceeding
the nitrogen removal rates expected for conventional constructed wetland treatment systems
under comparable conditions. However, further studies at larger-scale and over longer time
periods would be required to properly test this.

The native emergent aquatic plants selected showed good growth on the FTWs, producing
dense root masses within and beneath the floating mats (Fig. 5). Previous studies (Tanner &
Headley, 2011) suggest the plants contribute significantly to treatment performance by
providing extensive attachment surfaces for microbial biofilms, assimilating nutrients from
the water column, releasing bioactive exudates, and modifying environmental conditions
beneath the mat. In particular, dissolved oxygen levels typically become depleted beneath the
FTWs, due to shading of algal photosynthesis, respiratory oxygen demand of the roots and
associated biofilms, and reduced exchange across the water-atmosphere interface. This and
the release of exudates is likely to create conditions conducive to microbial denitrifiation, so
enhancing nitrogen removal in FTWs. Indeed, the ratio of N:P removed from the water
column in the experiments we report here were generally in the range of 40–70, much higher
than shoot tissue N:P ratios of 11-16 found for the two test species at the end of the flow-
through study (Sukias et al, 2010), or ratios of 10-20 commonly found for wetland plant
shoot tissues (Gusewell et al. 2003). This suggests substantially higher N removal was
occurring in the presence of FTWs than could be accounted for by plant uptake alone.

Conclusions
FTWs are a novel new tool for nutrient management in nutrient enriched waterways and
water bodies. They are currently being trialled or applied for water quality enhancement in a
wide range of situations in New Zealand (Figs. 9 and 10) and around the world. In the studies
reported here, areal TP removal rates of 54–58 mg/m2/d were recorded in batch trials and 2-5
mg/m2/d in flow-through field trials. Areal TN removal rates of 500–800 mg/m2/d were
recorded in batch trials, whilst 160–240 mg/m2/d were recorded in flow-through field trials.

Although the key nutrient removal processes operating are likely to be similar to those
operating in surface-flow wetlands, FTWs have a number of unique attributes which provide
advantages in certain situations. In particular, tolerance of deep and fluctuating water levels,
enables FTWs to be retrofitted into ponds, lakes and slow-flowing waterways. FTWs thus
have the potential to attenuate nutrient loads and ameliorate water quality problems in dams,
reservoirs, ponds, lakes and estuaries. The positive results shown in these mesocosm trials
warrant larger-scale, longer-term investigations of FTWs across a range of applications to
improve our understanding of their sustainable performance, and better define their niche
within the available suite of wetland ecotechnologies.

                                               9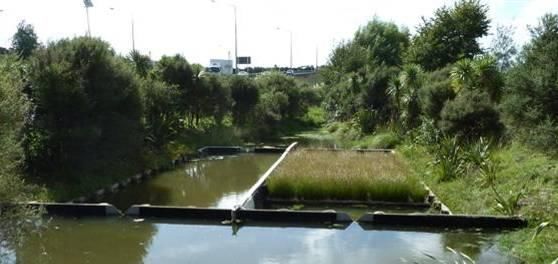
Figure 9. Trial application of FTW for treatment of agricultural drain-flows into the Tukipo
River, Hawkes Bay Regional Council.

Figure 10. Some New Zealand examples of FTW applications being tested for (clockwise
from top left) treatment of urban stormwater (North Shore, Auckland) and road run-off
(Northern Motorway, Auckland), lake water quality enhancement (Lake Rotoroa, Hamilton),
and treatment of wastewaters (Shannon WTP, Manawatu)

                                            10
Acknowledgements
The data reported in this paper are from studies carried out for and primarily funded by
Environment Bay of Plenty. We thank Andy Bruere and John McIntosh for their assistance
particularly for the Rotoehu trials, where they provided oversight of the project and
undertook significant liaison with affected land owners and lake-user groups. Presentation of
this work to a wider audience has been undertaken as part of the AgResearch-led Clean
Water, Productive Land Programme (C10X1006) funded by the Ministry of Science and
Innovation. Various other NIWA staff and visiting interns assisted with the project,
particularly Joe Butterworth (routine sampling), John Nagels (sonde sampling), Jeremy
Rutherford (site assistance), Mathieu Fabry (setting up of batch-testing facility), and Thomas
Mann, Tim Wallis, Lex Brugger and Asaeli Tulagi (field assistance). Previous work
commissioned by the Auckland Regional Council on application of FTWs for urban
stormwater treatment has informed this work. A study grant provided by NIWA for Chris
Tanner to visit Floating Islands International in Montana, USA in 2005 was instrumental in
developing our interest in its application for water quality enhancement, and bringing this
technology to New Zealand. We thank Floating Islands International (Montana, USA) and
Kauri Park Nurseries (Kaiwaka, NZ) for assisting with provision of the experimental floating
mats used in these studies. Kauri Park Nurseries also provided the wetland plants used in the
experiments.
References
Gusewell, S., Koerselman, W., Verhoeven, J.T.A. 2003. Biomass N:P ratios as indicators of
nutrient limitation for plant populations in wetlands. Ecological Applications 13, 372–384.
Headley, T.R., Tanner, C.C. (2006). Application of floating wetlands for enhanced
stormwater treatment: a review. Auckland Regional Council Technical publication TP324,
93p. http://www.arc.govt.nz/plans/technical-publications/technical-publications-301-
350.cfm.
Headley, T.R., Tanner, C.C., 2008. Floating wetlands for stormwater treatment: removal of
copper, zinc and fine particulates. Technical Report 2008-030, Auckland Regional Council
Auckland, NZ, p. 38p. (ARC07231, November 2008)
http://www.arc.govt.nz/albany/fms/main/Documents/Plans/Technical%20publications/Tec
hnical%20reports/1-50/TR2008_030%20-
%20Floating%20Vegetative%20Islands%20for%20Stormwater%20Treatment%20Remov
al%20of%20Copper,%20Zinc%20and%20Fine%20Particulates.pdf
Headley, T.R., Tanner, C.C. (2011). Innovations in constructed wetland treatment of
stormwaters utilising floating emergent macrophytes. Critical Reviews in Environmental
Science and Technology (in press).
Hubbard, R.K., (2010). Floating vetetated mats for improving surface water quality. In Shah,
V. (ed.), Emerging Environmental Technologies. Springer, New York. p. 211–244.
Kadlec, R.H., Wallace, S.D. (2009). Treatment wetlands. Second Edition. CRC Press, Boca
Raton, FL.
Mitsch, W.J., Day, J.W., Zhang, L., Lane, R.R. (2005). Nitrate-nitrogen retention in wetlands
in the Mississippi River Basin. Ecological Engineering 24: 267–278.
Park, J., Headley, T.R., Sukias, J.P.S., Tanner, C.C. (2008). Nutrient removal from eutrophic
lake water using floating treatment wetlands–mesocosm trials. NIWA Client Report
HAM2008-111 for Environment Bay of Plenty. (BOP07228, June 2008)
11Sukias, J.P.S., Tanner, C.C., Park, J., Headley T.R. (2010a). Use of floating wetlands to treat
nutrient-enriched lake water. Proceedings of the New Zealand Water Conference 2010
―Water our Key Strategic Resource, Water New Zealand, Christchurch. 22-24 Sept 2010.
Sukias, J.P.S., Yates, C.R., Tanner, C.C. (2010b). Assessment of floating treatment wetlands
for remediation of eutrophic lake waters – Maero Stream (Lake Rotoehu). NIWA Client
Report for Environment Bay of Plenty, HAM2010-104, NIWA, Hamilton Dec 2010.
Sukias, J.P.S., Park; J.,; Headley T.R., Tanner C.C. (in prep.) Nutrient attenuation potential of
floating emergent macrophyte treatment wetlands for eutrophic lake water. Draft
manuscript.
Tanner, C.C., Headley, T.R. (2011). Components of floating emergent macrophyte treatment
wetlands influencing removal of stormwater pollutants. Ecological Engineering 37:474-
486.
Van de Moortel A.M.K., Meers E., De Pauw N., Tack F.M.G. (2010). Effects of vegetation,
season and temperature on the removal of pollutants in experimental floating treatment
wetlands. Water, Air and Soil Pollution 212:281-297.
12You can also read