UMhlathuze Catchment Monitoring and Management - Bloemfontein September 2019
←
→
Page content transcription
If your browser does not render page correctly, please read the page content below
uMhlathuze Catchment
Monitoring and Management
Bloemfontein September 2019
Stewardship Principles

Water Stewardship is : the use of water that is
socially and culturally equitable, environmentally sustainable and economically beneficial, achieved through a stakeholder-
inclusive process that involves site-and catchment-based actions.
NatuReS South Africa
                                                                                                 Water security is one
                                                                                                    of the biggest
                                                                                                  economic risks in
                                                                                                  South Africa today

                                                                    Sustainable economic
                                                                     growth depends on
                                                                      natural resource
                                                                        stewardship

                           21.7% of South            •   The Natural Stewardship Resource Programme (NatuRes) is an
                            Africa’s population is       international initiative which combines global best practices with
                          unemployed                     local know-how
                                                     •   The programme facilitates partnerships between the public sector,
                          . Youth unemployment is        the private sector and civil society, promoting collective action to
                              currently at 54%
                                                         protect and manage natural resources and the services they provide
                    35th
    South Africa is the
                                                         to economic centres; securing livelihoods and fostering sustainable
  largest economy and                                    development
                                                     •   NatuReS operates in five African countries, including South Africa
    has one of 20 biggest
                                                         and is funded by the BMZ (the German Federal Ministry for
   stock exchanges in                                    Economic Cooperation and Development) and implemented by
             the world                                   Deutsche Gesellschaft für Internationale Zusammenarbeit GmbH
                                                         (“GIZ”)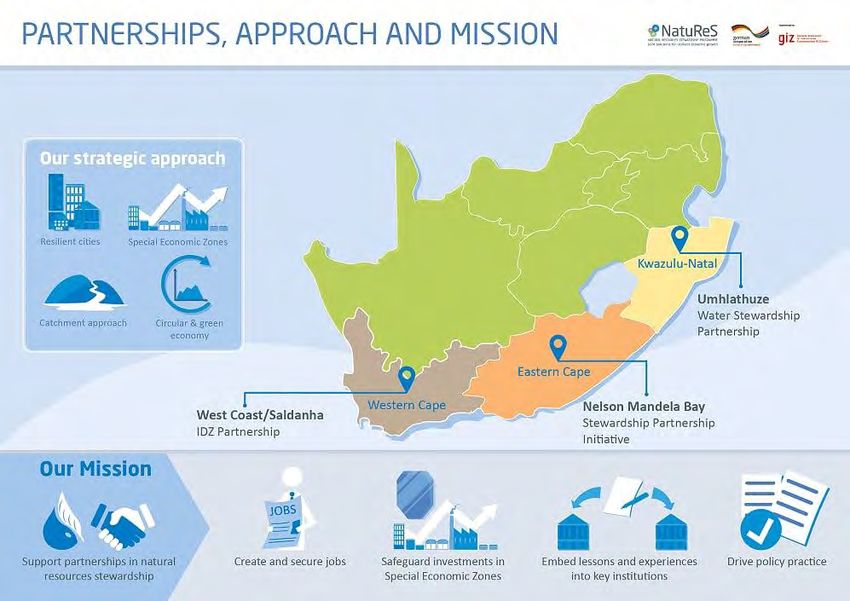
NatuReS Strategy

                        Special Economic
   Cities are the         Zones provide
     economic                                       Circular
                           favourable                             Partnerships are
powerhouses of the                                 Economy
                           investment                              what drive the
  country but are                                returns waste
                        environments and                         NatuReS approach
   most heavily                                   to the value
                         create jobs but
impacted by natural                                   chain
                         require natural
resource limitations   resource security to
                             operate
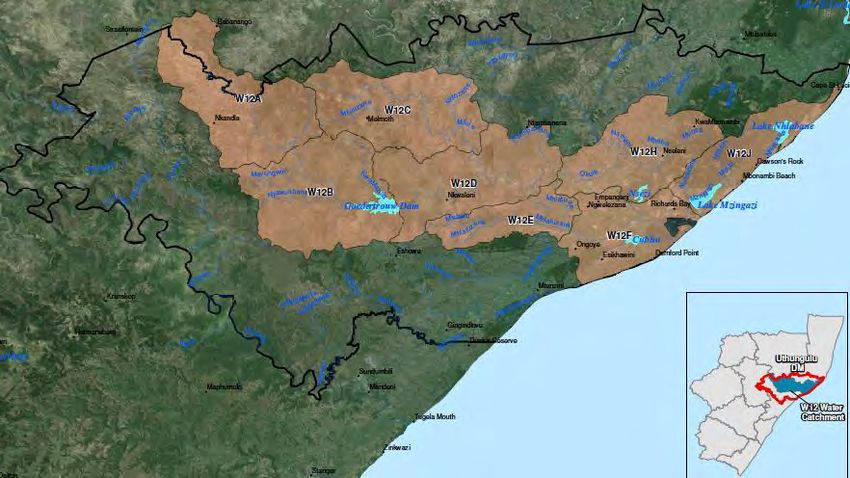
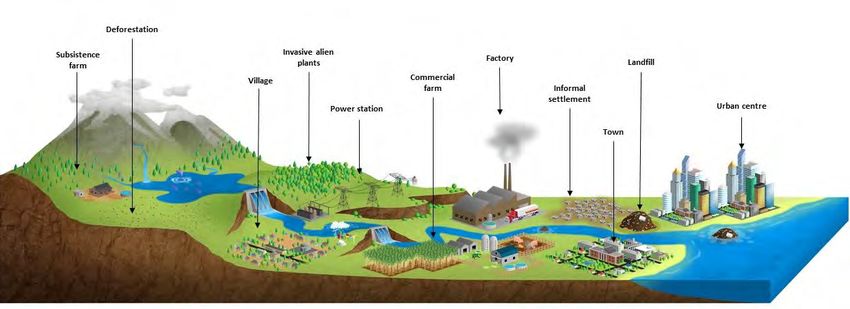
The uMhlathuze catchment area
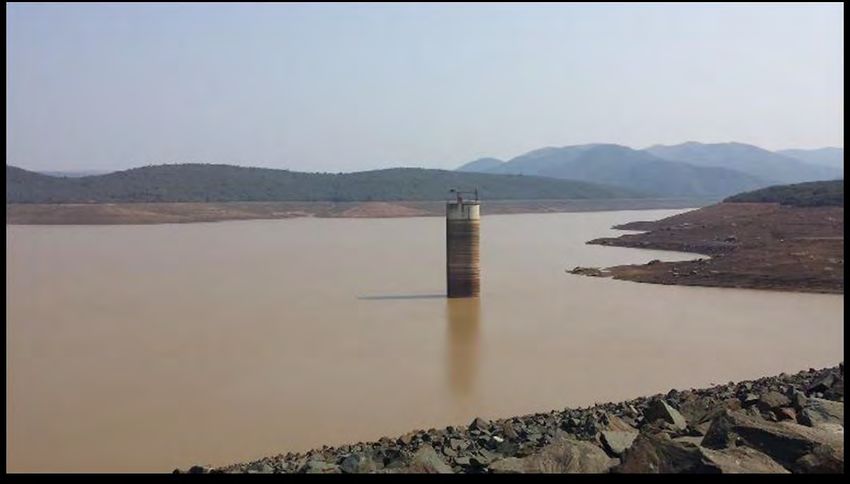
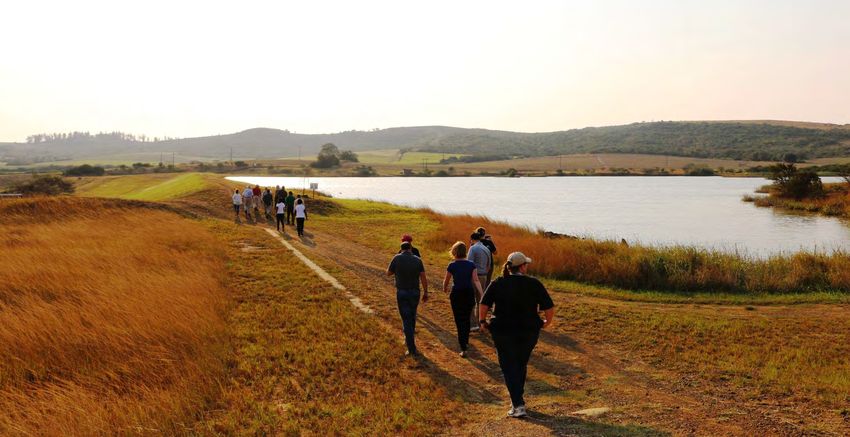
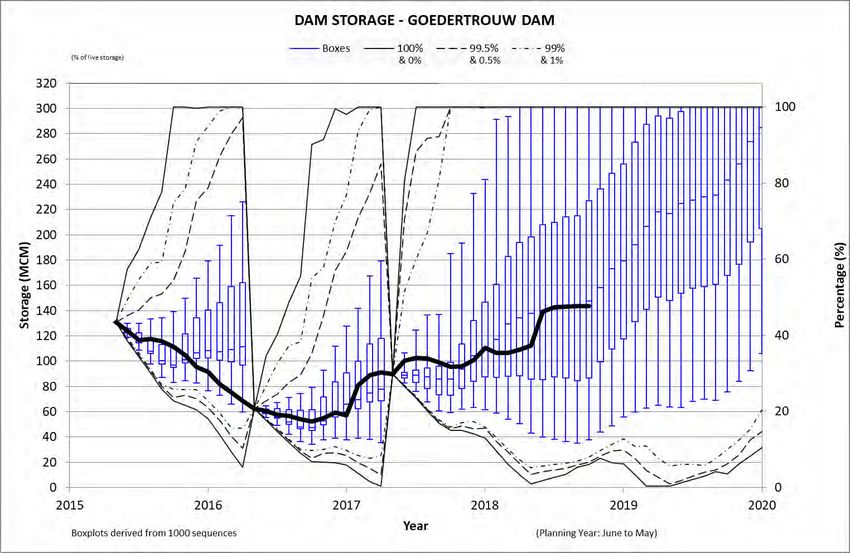
A partnership was catalysed by a major drought in
2016, and the need for a collective response

  The major dam serving the uMhlathuze region, at 18% capacity in August 2016:

  Photo Credit: Alex McNamara, NBI
  Goudertrouw Dam, August 2016

Field trip – August 2016
The risk of drought is increasing.
Collective action is needed. Water stewardship is a
          meaningful part of this journey.

                                                      Source: DWS 2018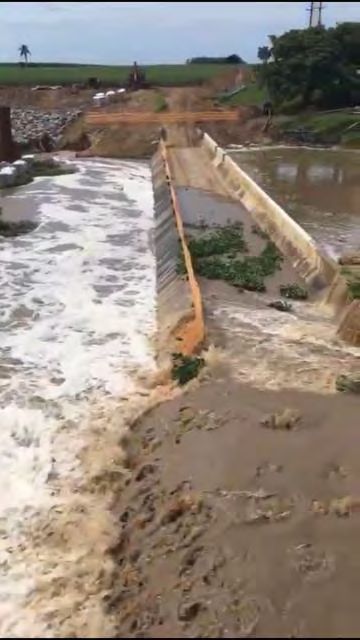
A partnership
                              between:

Pongola-Umzimkulu Proto-CMA

                                          2018/9:
                                          City of uMhlathuze
                                          South32
                                          Mhlathuze Water
UWASP has an established governance
structure that supports your participation
UWASP Partners Platform
Open, consultative advisory platform
Biannual meetings
Mutual information exchange
Management Committee
Implementation of identified activities;
Partnership coordination & management
Monthly meetings
NBI Partnership WWF Project
GIZ Technical
Coordinator Manager
Advisor
Project Specific Steering CommitteesUWASP has five work areas, as
agreed by the partners:
1 2 3 4
Enhanced Downstream Ecological
Agricultural
coastal lakes water-use infrastructure:
water
management & efficiency & invasive clearing
stewardship &
dam mentorship water losses and wetlands
efficiency
programme
Lead: IWaSP Lead: WWF-Mondi Lead: WWF-Mondi
Lead: NBI Support: SWPN Support: SASA & Support: uMhlathuze
Support: IWaSP Tongaat Hulett Irrigators Forum
5
Cross-cutting: develop local community environmental championsPartnership objectives 1. Serve as a coordination hub for collective action on water security across the uMhlathuze region 2. Collaborate with all key stakeholders and water users in the region 3. Implement short and medium-term measures to improve water security for industry, agriculture and communities 4. Use water as a focal point for transformation and economic development to strengthen resilience and adaptive capacity 5. Work with public sector institutions to support improved service delivery and natural resource management
Why are we here?

 Current Management of
 water releases
Current Management of
        releases
Contents 1. Problems with water releases 2. What are the solutions 3. What did we use in Mhlathuze? 4. The Water Stewardship Partnership. 5. DWS role in the relationship.
Genral problems with water releases
1. Operators at the dams have a variety of tasks to concentrate on, including the
   safety and maintenance of the structure
2. They also have staff to supervise, which keeps them away from the office. They see
   office work as a tedious exercise.
3. Downstream users quickly complain if releases are too small, even if there is water
   but pumps are too high to draw it.
General problems with water releases (2)

4. Most years dam operators are in a system with sufficient water, so it is easier to
   supply more than the minimum.
5. They also have limited understanding of weather and rain forecasting, and don’t
   see the relevance to their work.
6. If there is heavy rain, they can shut down when the river is in flood and still save
   some water.
7. They don’t always know what is happening on the river because of limited
   relationship with the users.
What are the solutions
1. Operators ands users need to be reminded that it is better to have a temporary
   shortage one day in 60 than to be without water for 60 days
2. Users worldwide are slowly becoming aware that their greatest business risk is
   water supply. They need to get involved in management of this resource.
3. Operators and users need to build relationships and trust.
4. There is no excuse for not communicating. We have the tools
Issues in the Umhlathuze Catchment

• Knowledge gap due to Norman retirement
• This issue is most likely
What did we use in Mhlathuze?

1. Engineer at Regional Office established a Watsapp group with
   users
2. Users communicate weir levels, weather conditions such as
   heat waves or rainfall and expected changes in use on this
   group.
3. The operator did not have a smartphone, so was out of the
   loop except the engineer communicated by phone and releases
   were confirmed by SMS or by email.
4. There were also problems with overtime payment for weekend
   adjustments which were solved by email to the supervisor.
The Water Stewardship Partnership

1. The engineer making the call for releases retired. An engineer
   in training took over this role.
2. The Water Stewardship Partnership, noting the level of the dam
   which had still not recovered, decided to prioritise a number of
   initiatives in the catchment to ensure sustainability.
3. One of these initiatives was to employ the retired engineer to
   pass on his experience to a group of stakeholders in the
   catchment.
The current situation

1. The engineer in training has been seconded to a company for
   experience, but is still involved with making the adjustments to
   the release in conjunction with the operator.
2. The retired engineer has been mentoring him as well as trying
   to encourage stakeholders in the catchment to develop some
   institutional knowledge on their system.
3. The water stewardship has organised a number of workshops
   for the stakeholders and the retired engineer so that they can
   be trained
The current situation (2)

4. A separate watsapp group was established for training
   purposes and daily discussion on the releases.
5. The idea was to form a decision-making group as had
   happened 20 years ago in a previous drought.
6. Only a few actively participated in discussion.
7. Possibly this was aggravated by the application during winter,
   when rainfall events were scarce and little adjustment of levels
   was needed.
The current situation (2)

8. A spreadsheet was used to help with the timing of the releases.
   Users found this difficult to understand.
9. Awareness of the weather, the river level and future demands
   requires concentration. External stakeholders as well as the
   dam operator have many other things occupying their minds.
DWS Role in the relationship

1. DWS needs to recognise that there is common ground between
   themselves and stakeholders in protecting the resource from
   failure.
2. They also need to recognise the benefits of having external
   users involved. These users have expertise as well as passion to
   see the system operated effectively.
3. Perhaps there needs to be a statement or MOU drawn up in
   catchments where this is feasible.
4. In the long term DWS needs to build up expertise on water
   releases for all systems within a region, and have a dedicated
   person to manage them.
Contents

1. Purpose of workshop
2. Why train a varied group of people
3. Why the flows and releases need constant monitoring and
   adjustment
4. The weather and sources of information
5. The effect of rainfall and duration of river flow
6. Timing the shutoff and new releases
7. How long does it take for the change to be felt.
8. Recap of workshop and feedback for future training
Purpose of workshop
                       why train a group?

1. To train a group of affected stakeholders to assist in managing a resource
   which supplies their water needs.
2. Training a group is important for continuity
3. It is also important that stakeholders have an understanding of the
   dynamics of their catchment so that they can give meaningful input
   especially during drought periods but also so that they can assist in advising
   on future improvements and developments.
Why flows and releases
need constant monitoring
1. Demands from the system are varying, especially Irrigation needs.
2. Heat waves and wind not only affect demand, but also evaporation from
the river surface.
3. Natural river flow drops steadily after a flood peak
4. Unexpected rainfall from some point within the catchment can cause levels
to rise.How to monitor the flows and rainfall
effectively
1. A group of people at different points in the catchment can monitor flows
more effectively and economically.
2. The key is to establish relationships and keep everyone involved and
informed.
3. The Mhlathuze Whatsapp group has been an effective tool, but there may be
room for improvement.
4. There is a daily report of the level and pumped volume at Mhlathuze weir as
well as the level at P230 weir and pumping rate.
5. We need a tool to monitor the lake levels on a weekly basis and standard
measure such as live volume & percentThe weather and sources of
information
1. Weather can be sourced from many websites, from the TV and from people
on the ground
2. People on the ground can also give rainfall figures afterward to confirm if
the forecast came to pass
3. It is good to look up to 10 days ahead, so that release changes can be
anticipated and modelled, but rain, especially if it is forecast to be localised
can disapper before the time or arrive a day or two late
4. https://www.yr.no/place/South_Africa/KwaZulu-Natal/Heatonville/ or
https://www.wunderground.com/weather/za/empangeni/-
28.75%2C31.88999939 are two I use. Windguru is favoured by some
5. Yr underestimates rain and wunderground overestimates, but when they
confirm each other with high rainfall, it is fairly reliable.The effect of rainfall and duration of
flow
1. Light rain, especially after a dry spell is not important. Irrigation
normally continues and river levels do not rise, as it soaks into the
ground
2. Follow-up rain when the catchment is wet, on the other hand, can
have a significant effect on river levels and Irrigation demand. Judging
this requires experience. Hopefully a group decision will provide a
more accurate assessment, but we all get it wrong sometimes, just
like the weatherman.
3. It is also important that stakeholders have an understanding of the
dynamics of their catchment and contacts within the catchment.Timing the shutoff and new releases 1. To save water, flows should be reduced before rainfall so as to drop the river level on the day that the rain arrives at the Mhlathuze weir, but not too soon. 2. Flows should not be cut too much unless a large storm is expected. Judging this requires experience. 3. Afterward flow should be gradually increased before the river flow drops completely, as a dry river bed will delay the flow and cause shortage of supply. 4. Gradual stepped increases are also easier to model and thus more accurate.
Travel times in a river system and
             how they vary

1. Water takes very long to fill a dry river bed.
2. Small flows flow slowly and bigger flows are faster.
3. An increase in top of a small flow travels even faster than a big flow in a dry
   river.
4. You can catch up for a late release with a bigger release over 24 hours, but it
   will not save more than a quarter of the time.
Travel times in a river system and
how they vary
flow levels
4,5
4
3,5
3
2,5
2
1,5
1
0,5
0
1 2 3 4 5 6 7 8 9 10 11 12 13 14 15 16 17 18 19
bottom 1 cumec 2 cumec 3 cumecTravel times example from Tugela
flows catching up
10,00
8,00
6,00
4,00
2,00
0,00
1 3 5 7 9 11 13 15 17 19 21 23 25 27 29 31 33 35
Series1 Series3
flows catching up
10,00
8,00
6,00
4,00
2,00
0,00
1 3 5 7 9 11 13 15 17 19 21 23 25 27 29 31 33 35
Series1 Series3Travel times example from Tugela
Catch up Boost?
6,00
5,00
4,00
3,00
1 3 5 7 9 11 13 15 17 19 21 23 25 27 29 31 33 35
Catch up Boost?
7,00
6,00
5,00
4,00
3,00
1 3 5 7 9 11 13 15 17 19 21 23 25 27 29 31 33 35
Catch up Boost?
7,00
6,00
5,00
4,00
3,00
1 3 5 7 9 11 13 15 17 19 21 23 25 27 29 31 33 35Recap and final questions
Feedback
Future follow-upThank you! UWASP partnership manager GIZ-IWaSP Country Coordinator Michelle Hiestermann Dr Faith Lawrence MichelleH@nbi.org.za faith.lawrence@giz.de Cell: 073 645 3300 Cell: 082 882 0887 WWF Water Stewardship project manager Candice Webb Cwebb@wwf.org.za Cell: 082 405 1688
The uMhlathuze Spreadsheet (1)

•   The purpose of learning this spreadsheet is that each person should fill it in
    as if they are the sole person deciding on the dam releases.
•   Having a single copy on the net was considered, but filling all the info in by
    hand will give one a better feel for the quantities and avoid mistakes. If a
    figure looks wrong, the query it on the watsapp so we can all take note.
•   The most important thing is to try different releases and see what the effect
    is at the bottom weir.
•   We will then agree on a release and everybody will assume that release
    from then on, but can continue to fill in different figures for later that week
The uMhlathuze Spreadsheet (2) 1. Column A contains the date. If there is significant rain recorded that morning you can right click and add a note on the rainfall. This will help you get an idea how this affects the flow later that week, so it is a useful place to store info without creating another column. 2. Column B is the dam level from the Midmar sheet sent out daily. You need to give Cobus your email address to get on this list. It is useful if you want to plot a graph to see the trend in level. 3. Column C gives the past releases and the formula sets each day forward at the same flow as yesterday. If you set a new flow today it will change the flow at the Mhlathuse weir in column I at some future date. This is the most important column, as you need to see what a change in release today or tomorrow or the next day will make.
The uMhlathuze Spreadsheet (3)

4. Column D is the flow at the P230 derived from a formula, and column E is
   the level at P230. Only change column E when the p230 reading comes
   through. Do not type in column D. You should right click in E to record the
   pumping rate from the watsapp group.
5. If you add back the pump rate you can see how much water is arriving at
   Heatonville. Changes at the dam normally take half as long to Heatonville as
   to the bottom of the catchment.
6. P230 is past the Heatonville pump station, so when the pumps are on, the
   flow reduces a little later. This reduced flow is what is heading for the
   Mhlathuze weir, so when the pumping increases you should consider
   releasing more.
7. The irrigators should warn the group when it is getting drier or wetter so
   we can anticipate the change in pumping.
The uMhlathuze Spreadsheet (4)

8. Column F is the level at the Mhlathuze Weir up until today. There are two
    ways to estimate the future level of the Mhlathuze Weir. One is to assume
    values manually and see if the use column (J) matches the expected use (K)
    on future dates. This is very time consuming, unfortunately. We will cover
    another method in future training.
9. Column G is the spillage from the weir calculated from the shape before
    construction. Unfortunately this will have to be recalculated when DWS
    produces a DT table for the new weir.
10. It would appear that floods are being released from the scour each time it
    rains, so it makes it very hard to know how much water is coming down
    after a rain event and when it is likely to stop flowing. For now one will
    have to use the P230 flow as an indicator.
The uMhlathuze Spreadsheet (5)
11. Column H is the deficit in flow over 24 hours when the weir level has
dropped. It means the actual use has been more than the release reaching
the weir. If the deficit continues the weir will fall too low for abstraction.
12. When there is a surplus this column will have a minus sign. Don’t worry
about this.
13. Column I is the release that should be arriving at the weir over the last 24
hours based on the release some time ago. There is a complicated formula
used to calculate the travel time to determine this. This has been derived
from 3 years experience, but is still only an approximation. The flows can
take more or less time depending if the catchment is wet or dry.
14. Column J is derived from column I and is the total use in the catchment less
spills but allowing for the deficit or surplus in the weir.
15. Do not change the formulas in columns G to J, just copy them down up to
two weeks in advance.The uMhlathuze Spreadsheet (6)
16. Column K is the estimated use in the catchment based on the weather
patterns and the past few days use. This one you should try to fill in for the
next few days. You can plot a short term graph of actual use to see if it is
going up or down, but the weather is still the biggest factor. Reduce the
estimated use on the days when rain is expected and shortly after.
17. Column L is the difference between the estimated use (K) and the water
arriving at the weir (J). You should alter the flow for today and the days that
follow so that (J) and (K) are similar and that (L) will be close to zero.
18. So this is where skill and experience is needed firstly to estimate future use
and secondly to try and match this use with the correct releases.
19. Column M should be filled in with the abstraction figure from the weir for
both the MW and Tronox. Tronox can be filled in in column N and added
with a formula. Then you can see the trend in use from the water board.
20. However remember that (J) is the more important one, as it reflects ALL
use.The uMhlathuze Spreadsheet (7)
21. You can also draw graphs to help you estimate use and flow. Here is a graph
from late February showing the reduction in release in anticipation of rain
and the P230 flow spiking after the rain.
Chart Title
30
25
20
15
10
5
0
1 2 3 4 5 6 7 8 9 10
Series1 Series2The uMhlathuze Spreadsheet (8)
22. This graph shows the decline in the p230 after the rain, and the release
timed to reach the lower river before the flow stops. This requires
experience and practice with the spreadsheet.
Chart Title
7
6
5
4
3
2
1
0
1 2 3 4 5 6 7
Series1 Series20
1
0,2
0,4
0,6
0,8
1,4
1,2
2019/02/21
Mhlathuze weir.
2019/02/22
2019/02/23
2019/02/24
2019/02/25
2019/02/26
2019/02/27
2019/02/28
2019/03/01
2019/03/02
Series2
2019/03/03
2019/03/04
Chart Title
2019/03/05
2019/03/06
Series4
2019/03/07
2019/03/08
2019/03/09
2019/03/10
2019/03/11
2019/03/12
2019/03/13
2019/03/14
The uMhlathuze Spreadsheet (9)
23. This graph shows the delay between the release and the flow at theThe uMhlathuze Spreadsheet (10)
24. The flow at the weir was normally very sensitive to rain or release changes.
It now appears very stable, which gives little idea how the water balance is
actually working.
25. One of the problems I see with the current operation is that there is
apparently no flow going to the estuary. It may be that the scour is being
operated regularly to release surpluses, but this is not being
communicated. This means that the releases could be too high, but we are
not aware of it.
26. Alternately the flows may be so low that MW is only drawing what they can
get and thus this is not a fair reflection of the demand. If there is sufficient
water in the lakes to make up the sortfall, this is OK, but if the lakes get too
low again the situation could change without warning.The uMhlathuze Spreadsheet (11)
27. This graph shows the flows from 15 April till early May. It shows how the
flow was reduced in anticipation of rain and how the release was different
to the flow arriving at the weir.
Chart Title
2,50
2,00
1,50
1,00
0,50
0,00
1 2 3 4 5 6 7 8 9 10 11 12 13 14 15 16 17 18 19 20 21 22
Series1 Series2 Series3You can also read