EUROMECH Young Scientist Prize paper: "Lagrangian statistics of inertial particles in turbulent flow"
←
→
Page content transcription
If your browser does not render page correctly, please read the page content below
EUROMECH Young Scientist Prize paper:
     “Lagrangian statistics of inertial particles in
                  turbulent flow”
                                      Mickaël Bourgoin∗
                                           July 1, 2010

  Mickaël Bourgoin won the EUROMECH Young Scientist Prize, awarded at the 12th EU-
ROMECH European Tubulence Conference held in Marburg, September 7 - 10 2009.

                                              Abstract
         Turbulent transport of material inclusions plays an important role in many nat-
     ural and industrial situations. In the present study, we report an exhaustive exper-
     imental investigation of material particles Lagrangian dynamics in a turbulent air
     flow, over a wide range of sizes and densities. For fixed carrier flow conditions, we
     find that (i) velocity statistics are not affected by particles inertia ; (ii) acceleration
     statistics have a very robust signature, where only acceleration variance is affected
     by inertia ; (iii) inertial particles always have an intermittent dynamics ; (iv) inter-
     mittency signature depends on particles inertia ; (v) particles actual response time
     to turbulent forcing remains essentially of the order of the carrier flow dissipation
     time rather than any particles dependent time (as the Stokes time for instance).

1 Introduction
Predicting the dynamics of material particles dispersed and transported in a turbu-
lent flow remains a challenge with important applications in industrial and natural
systems: dust and pollutants dispersion, industrial mixers, sediments in rivers, dis-
persion of gametes of marine animals, water droplets in clouds, atmospheric balloons,
etc. One of the main difficulties lies in the intrinsic multi-scale nature of turbulence:
depending on their size and density, particles will interact with structures of the carrier
flow at different time and spatial scales. For instance neutrally buoyant particles much
smaller than the dissipation scale η of the turbulent field are expected to behave as
tracers, with the same dynamics as fluid particles. On the contrary particles with mis-
match density and/or with size comparable to turbulent eddies, will not follow the
flow exactly. We refer to these particles as inertial. How the coupling between particle
dynamics and fluid dynamics is influenced by size and density effects remains an open
question and a very active field of research. Several inertial effects have been known
for a long time and can be interpreted qualitatively in terms of particle interaction with
turbulent eddies. For instance the well known preferential concentration effect leading
to the formation of clusters of inertial particles separated by depleted regions can be
understood as the centrifugal expulsion of denser particles from the turbulent eddies.
However an accurate quantitative description of such effects is still lacking. One of
the reasons is our inability to write a proper equation of motion for inertial particles
  ∗ Laboratoire des   Écoulements Géophysiques et Industriels (CNRS/UJF/INPG), Grenoble, France

                                                 1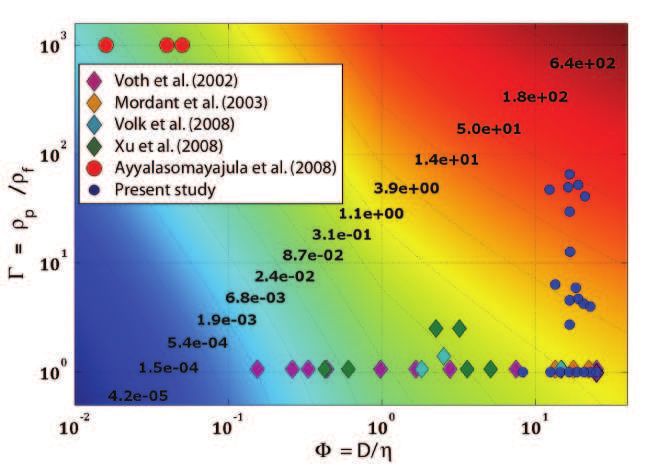
in a turbulent environment. A relatively rigorous analytical approach only exists for
the limit case of point particles, for which the BBOT (Basset-Boussinesq-Oseen-Tchen)
equation - revisited in 1983 by Maxey & Riley [10] and Gatignol [7] - offers a suitable
model. In a more general case (finite size particles with arbitrary density), apart from
some first order corrections to the BBOT equation (as Faxèn corrections for instance
[4]), a valid equation of motion remains to be found. For these reason recent exper-
imental and numerical investigations have shown much interest in studying particle
acceleration, which is a direct image of the turbulent forcing experienced by the parti-
cles, a key ingredient in any dynamical model for particles motion.
    The goal of the present work is to investigate experimentally how size and density
affect the turbulent dynamics of particles. Comparison with predictions in the point
particle limit is particularly enlightening in order to catch the range of validity of this
limit case, which is by far the most documented from theoretical studies and numerical
simulations. In the first section we briefly summarize main previous results concern-
ing particle acceleration. In the second section we describe our experimental setup
(acoustical Lagrangian tracking of particles transported in a grid generated wind tun-
nel turbulent flow). In the third section we present the results on particle dynamics. To
finish, a brief discussion and comparison of experimental results with existing models
is proposed.

2 Inertial particle acceleration : a brief review
As already mentioned, much effort has been put recently in characterizing the acceler-
ation of inertial particles. In experiments, particles are characterized by their diameter
D and density ρ p . In the following we will consider the dimensionless size and density
parameters: Φ = D/η and Γ = ρ p /ρ f , where η is the carrier flow dissipation scale and
ρ f is the carrier fluid density. In the point particle limit, particle inertia is generally
parametrized by the so-called particle response time τp , which for a real particle in a
smooth flow is given by the Stokes time τp = D2 (ρ f + 2ρ p )/(36νρ f ) (the dimension-
less Stokes number St = τp /τη is commonly used). In this limit, particle response time
therefore combines in a single parameter the role of size and density. It is sometimes
associated with the added mass parameter β = 3ρ f /(ρ f + 2ρ p ) [4]. During the past
decade, high resolution Lagrangian particle tracking techniques have emerged [16, 12]
which have allowed a detailed characterization of particle acceleration statistics. Fig-
ure 1a presents particle classes, in the (Φ, Γ) parameter space, which have been recently
investigated experimentally. Most existing studies have considered either tracer parti-
cles (Φ > 1) but small
(Φ  1) but weakly inertial
(Φ > 1, Γ < 4).
    In the case of tracers, highly intermittent Lagrangian dynamics and highly non-
Gaussian acceleration statistics (with high acceleration events occuring with a prob-
ability orders of magnitude higher than a Gaussian distribution with the same vari-
ance) have been reported [9, 11]. For inertial particles, numerical simulations in the
point particle limit predicted a reduction of these non-Gaussian statistical tails and a
trend of acceleration probability density function (PDF) to a Gaussian shape as par-
ticles Stokes number is increased [3, 15]. This trend seems to be confirmed by recent
experiments [1, 2]. Beyond the point particle limit, experiments had mainly consid-
ered so far only the case of weakly inertial particles (Φ > 1, Γ < 4). In this situation, no
clear evidence of gaussianization of acceleration PDF with increasing Stokes number
has been observed. In all cases however, a trend of acceleration variance to decrease
with increasing Stokes number has been reported.

                                             2
2.75 m L=
75
cm
U
ultrasonic
transducers mean flow
ν0 + δν bubble
direction
measurement
nozzle y x
Data volume z
Acq.
ν0 Emitter
excitation
(a) (b)
Figure 1: (a) Particle size and density parameter space explored in previous investigations of acceler-
ation statistics. Present studies (blue circles) concern particles which are both large and dense. Back-
ground countours indicate corresponding particle Stokes number (b) Sketch of our acoustical Lagrangian
tracking facility in grid generated turbulence.
In this work we present the first measurements of particles which are both much
larger than the dissipation scale of the carrier flow and significantly denser than the
carrier flow (we cover the range 10 < Φ < 30 and 1 < Γ < 70).
3 Experimental setup
Our experiment runs in a large wind tunnel with a measurement section of 75x75
cm downstream of a grid (with a 7.5 cm mesh size) which reproduces almost ideal
isotropic turbulence (figure 1b). The mean velocity of the fluid is U = 15 ms−1 and
the turbulence level is urms /U ∼ 3%. The corresponding Reynolds number, based on
Taylor microscale, is of the order of Rλ = 175. The Kolmogorov dissipation scale (giv-
ing the typical size of the smallest turbulent eddies) is η = (ν3 /ǫ)1/4 ∼ 240 µm (where
ν = 1.5 m2 s−1 is the air viscosity at working temperature and ǫ ∼ 1.0 m2 s−3 is the
turbulent energy dissipation rate per unit mass) and the energy injection scale (giving
the typical size of the largest eddies) is L ∼ 6 cm. Particles are individually tracked
by 1D Lagrangian acoustic Doppler velocimetry [12, 14, 13]. We measure the stream-
wise velocity component vz of the particles as they are tracked along their trajectory.
Acceleration component az is obtained by differentiation of the velocity. As particles
we use soap bubbles which we can inflate with different gases (we use helium to pro-
duce neutrally buoyant bubbles and air for denser ones) and for which we can tune the
thickness of soap film to adjust the density from neutrally buoyant to about 70 times
heavier than air. Bubble diameter can be adjusted independently.
4 Particle dynamics
In this section we present results on the Lagrangian dynamics of particles. The first
subsection deals with single time velocity and acceleration statistics while the second
one presents some results on two time statistics, with a main focus on Lagrangian
intermittency and acceleration Lagrangian correlation.
30 Φ
10 0.1 25.100
Φ ∼ 16.5 − Γ ∼ 1
23.233
−1 0.08 21.367
10
19.500
0.06
/
PDF
−2 17.633
10
rms
15.767
V
0.04
−3
13.900
10
0.02 12.033
10.167
−4
10
12 13 14 15 16 17 0 8.300
−1 0 1 2
v [m⋅s ] 10 10 10
z Γ
(a) (b)
Figure 2: (a). Typical particle velocity probability distribution function. (b) Velocity flucutation rate
as a function of particle density (color code indicates particle size).
4.1 Single time statistics
Velocity statistics are found to have Gaussian fluctuations, as shown in figure 2a. We
define the particle fluctuation rate as the ratio of the root mean square velocity vrms
and the average velocity < V > (which is identical to the mean streamwise velocity U
of the carrier flow). This fluctuation level is found to be independent of particle prop-
erties and does not present any trend either with particle size or with particle density
(figure 2b). Moreover the corresponding fluctuation level, of the order of 3%, is iden-
tical to the turbulence level of the carrier flow itself measured from classical hotwire
Eulerian anemometry. While Eulerian and Lagrangian velocity fluctuations are indeed
expected to coincide for tracer particles, this result is in contrast with predictions from
inertial point particle models, as the Tchen-Hinze approach [6], where a monotonic de-
crease of velocity fluctuation as particle inertia increases is predicted (as the result of
a low-pass filtering effect from the particle response time scale). Such a filtering effect
is not observed experimentally. A possible interpretation of the observed invariance
could be that vrms mainly reflects large scale fluctuations and should not therefore be
significantly affected by a small scale filtering related to a simple Stokes number effect.
This suggest that if there is any significant change in particles dynamics, it should
better be looked for in the small scales than in the large scales. A typical small scale
quantity is particle acceleration. Figure 3a shows acceleration probability density func-
tions for all the particle classes we have investigated. Note that in this plot PDFs have
been normalized to unity variance. It is striking to observe that all such normalized
PDFs collapse onto almost a single curve, indicating a very robust statistical signature
of acceleration fluctuations that is independent of particle size and density. This obser-
vation is again in contrast with predictions based on point particle models where the
filtering Stokes number effect has been shown to induce a Gaussianization of accelera-
tion PDF with increasing particle inertia. A clear influence of particle size and density
can however be observed when PDFs are not normalized to unity variance. PDFs tend
then to narrow and to peak as particle density increases. The evolution of acceleration
PDFs is therefore entirely coded by acceleration variance only, while the global PDF
shape remains unchanged when normalized to unity variance. Size and density effects
on particles acceleration statistics can therefore be entirely characterized by the single
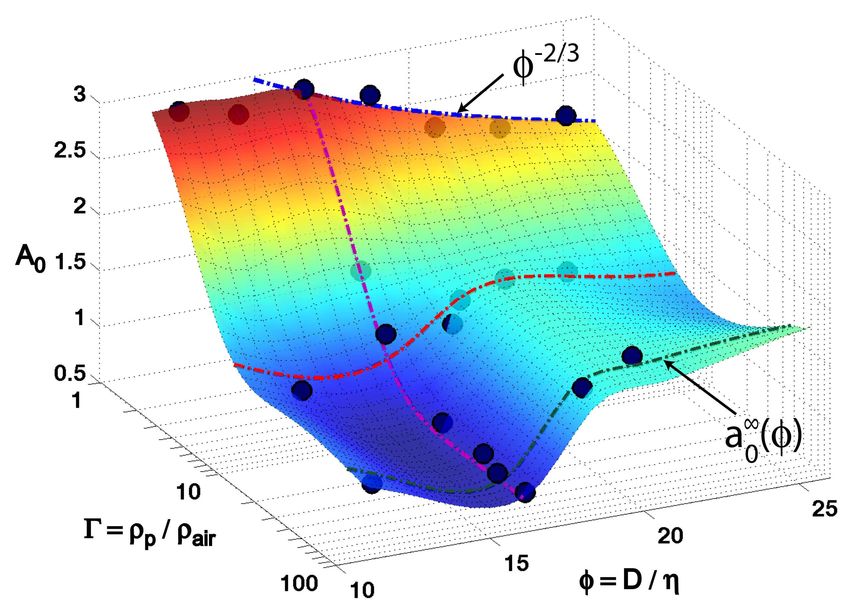
investigation of acceleration variance < a2 >. Figure 3b represents the evolution of
< a2 > as a function of particle size and density. Several important features need to be
stressed. For neutrally buoyant particles, a monotonic decrease of < a2 >∼ Φ−2/3 is
observed for particles larger than Φ ∼ 10 (smaller particles reach the fluid tracer limit).
This trend has already been reported by Voth et al. [16] and we have recently shown
40
10
φ Γ φ Γ
12.5 1 16.8 12.6
-1 14.6 1 16.8 30
10 16.7 1 12.4 47
18.8 1 16.4 50
20.8 1 19 52
-2 22.3 1 21 41
10 25 1 16.8 65
16.7 2.7
13.5 6.34 0.05 1000
-3 15.3 4.67 (from [18])
10 16.7 4.58
18.5 5.9
PDF
20.8 4.23
-4
22.8 4.0
10
-5
10
-6
10
-7
10
-15 -10 -5 0 5 10 15
a / < a2 >(1/2)
z z
(a) (b)
Figure 3: (a) Particle acceleration probability density function. (b) Acceleration variance as a func-
tion of particle size and density (< a2 > is presented in the dimensionless form A0 =< a2 >
ǫ−3/2 ν1/2 - Heisenberg-Yaglom scaling).
that it can be interpreted as the leading role of pressure forces at the particle scale [14].
For a fixed particle size Φ, < a2 > is found to decrease monotically when particle den-
sity is increased and to reach a finite limit a0∞ for large density values. An interesting
finding is the non trivial size dependence of a0∞ which is found to increase abruptly for
increasing particle size around Φ ∼ 18. This counter-intuitive observation (it shows
an increase of fluctuations with increasing particle size and therefore with increasing
paricle Stokes number) needs to be understood and will be discussed later.
4.2 Two time statistics
Previous single time statistics analysis has shown that large scales (as represented by
velocity fluctuations) and small scales (as represented by acceleration fluctuations) are
affected differently by particle inertia. A classical way to investigate scale by scale
turbulent dynamics is to consider velocity increments. Figure 4a presents PDFs of
Lagrangian velocity increments (δτ v(t) = v(t + τ ) − v(t)) for one class of particle
(Φ = 16.6, Γ = 1). We observe a continuous deformation from highly non-Gaussian
fluctuations at small scale increments (which reflect acceleration) to Gaussian fluctu-
ations at large scale increments (which reflect velocity itself). This evolution of incre-
ments statistics with the inertial scales is representative of the intermittent nature of
particle Lagrangian dynamics. An interesting finding of the present work is that in-
termittency is observed for all the particles which have been investigated. However,
the fine signature of this intermittent dynamics is found to depend on particle inertia.
To illustrate this point, figure 4b presents the evolution of increment flatness F (which
measures the extent of PDF tails) as a function of time scale τ for two different classes
of particles with fixed size and increasing density. Within error bars, flatness is com-
parable for both at small sub-Kolmogorov scales (this only reflects the robustness of
acceleration PDF shape, already discussed above) and at large scales (flatness tend to
a value of 3, which corresponds to large scale Gaussian fluctuations). However the
evolution between small and large scales is strongly particle class dependent, in par-
ticular for time scales near the dissipation time scale τη of the carrier flow. At such
scales, a clear drop ∆F of the flatness (corresponding to a sudden reduction of incre-
ments PDF tails) can be observed, with an increasing amplitude as particle density is
increased. Subsequently to this drop flatness smoothly tend to its large scale Gaussian
limit as larger time scales are considered. This indicates that the main effects associ-
ated to particle inertia occur for time scales near τη . Such effects are usually expected
50
10
9
(φ = 16.6 ; Γ = 1)
-1 8 (φ = 16.6 ; Γ = 4.6 ; Stp ~ 4)
10
∆F 7
-2
10
PDF 6
-3 5
10
F
4
-4
10
3
-5 2
10
1
-6
10
-10 -8 -6 -4 -2 0 2 4 6 8 10 0
p 0 2 4 6 8
δτ v/ hδτ v 2 i τ/τη
(a) (b)
Figure 4: (a) Typical evolution of velocity Lagrangian increments. (b) Increment flatness coefficient as
a function of time lag.
to occur at a time scale related to the particle response time τp . Therefore, a natural
question at this point is : what is the actual response time of the particle? As already
mentioned, usual estimations of τp are based on particle Stokes time. In the limit of
vanishing particles Reynolds number it is given by τp = D2 (ρ f + 2ρ p )/(36νρ f ). For
finite particle Reynolds number, empirical corrections to this relation can be found in
the litterature [5] (these corrections have been used to estimate the Stokes time in figure
1a for instance). Inaddition to this a priori estimation of τp , an experimental measure-
exp
ment of actual particle response time to the turbulent solicitations τp can be obtained
from the analysis of the particle acceleration Lagrangian correlation function Ra . Such
a typical correlation function is shown in figure 5a. We define the experimental parti-
exp Rt
cle response time as τp = 0 0 Ra (t)dt, where t0 is the first zero crossing of Ra . Figure
5b shows the evolution of a priori estimated Stokes time τp (stars) and experimentally
exp
measured response time τp (circles) as a function of particle size and density. It is
striking to observe that, while the estimated τp is expected to vary over more than
one order of magnitude among the different particles we have investigated, the actual
measured response time does not exhibit any significant change with particle size and
density and remains of the order of τη . Not only is the actual response time different to
the estimated one, but also it appears to be determined mainly by the carrier flow itself
and not to change significantly with particle properties. This observation gives a crude
argument for the failure of point particle models (where particles are characterized by
their estimated response time as main parameter) to correctly describe the dynamics
of real finite sized particles. As most filtering effects predicted in existing models are
related to an increasing particle response time with increasing inertia, they cannot be
present if the actual response time of the particles does not change as expected.
5 Dicussion and Conclusions
Our results for the investigation of finite sized inertial particles indicate that : (i) veloc-
ity statistics are not affected by particle inertia ; (ii) acceleration statistics have a very
robust signature, where only acceleration variance is affected by inertia ; (iii) inertial
particles always have intermittent dynamics ; (iv) intermittency signature depends on
particle inertia ; (v) particle actual response time to turbulent forcing remains of the
order of the carrier flow dissipation time rather than any particle dependent time (the
Stokes time for instance). Most of these observations cannot be interpreted by a simple
filtering effect (or Stokes number effect) as suggested by existing models in the limit
61.2 3 Γ
10 65.481
τp / τη
Φ = 16.6 − Γ ∼ 1
1 58.317
2 51.152
10
0.8
43.988
0.6 36.823
Ra
;
1
10
0.4 29.658
τpexp
22.494
0.2
τint / τη
0
10
15.329
0
8.165
−1
−0.2 10 1.000
0 2 4 6 8 10 12 14 16 18 20 22 24 26
τ/τ
η
Φ
(a) (b)
Figure 5: (a) Typical acceleration correlation function R a and definition of the experimental particle
ex p
response time τp . (b) A priori estimated Stokes time τp (stars) and experimentally measured particle
ex p
time τp (circles) as a function of particle size (color codes particles density).
of point particles. A first correction to this limit can be made by including so called
Faxèn corrections in the point particle equation of motion. A recent numerical inves-
tigation including these corrections [4] has been shown to improve qualitative trends
of the model when compared to experiments, in particular regarding the shape of ac-
celeration statistics, but quantitative discrepancies still remain. We believe that our
observations can be better understood in terms of a sampling effect, related to the pref-
erential sampling by particles of certain turbulent structures in the carrier flow, rather
than a filtering response time effect. Such preferential sampling is expected due to in-
ertial particles clustering in the quietest regions of the flow. It would exhibit several
features shared with our observations: (i) numerical simulations of stick-sweep mech-
anisms [8] show that inertial particles tend to cluster near low acceleration points of
the carrier flow and that velocity statistics of such points are identical to overall ve-
locity statistics of the carrier flow as observed in our experiments ; (ii) as a result of
clustering, acceleration fluctuations are expected to be reduced when particle density
increases; (iii) when particles become larger than the typical size of these quiet regions,
an increase of fluctuations is expected as particles experience again the influence of
more active surrounding structures (which could explain the increase of < a0∞ > we
have observed for Φ ∼ 18). Several points still need to be investigated further. Im-
portant questions remain. What fixes the shape of acceleration PDFs ? (is it somehow
related to large scale properties of the carrier flow as (an)isotropy and flow confine-
ment ?) What fixes the limit < a0∞ > for acceleration variance at high density ratios ?
Why is the particle response time so weakly affected by particle properties ? Finally,
what adequate equation of motion is needed to model the dynamics of finite sized
particles ?
References
[1] S. Ayyalasomayajula, A. Gylfason, L.R. Collins, E. Bodenschatz, and Z. Warhaft.
Lagrangian measurements of inertial particle accelerations in grid generated wind
tunnel turbulence. Physical Review Letters, 97:144507, 2006.
[2] Sathyanarayana Ayyalasomayajula, Armann Gylfason, and Zellman Warhaft. La-
grangian measurements of fluid and inertial particles in decaying grid gener-
ated turbulence. In Yukio Kaneda, editor, IUTAM Symposium on Computational
7Physics and New Perspectives in Turbulence, volume 4, pages 171–175, Nagoya,
Japan, September, 11-14 2006. Nagoya University, Springer.
[3] Jeremy Bec, Luca Biferale, Guido Boffetta, Antonio Celani, Massimo Cencini,
Alessandra Lanotte, S. Musacchio, and Federico Toschi. Acceleration statistics
of heavy particles in turbulence. Journal of Fluid Mechanics, 550:349–358, 2006.
[4] Enrico Calzavarini, Romain Volk, Mickaël Bourgoin, Emmanuel Lévêque, Jean-
François Pinton, and Federico Toschi. Acceleration statistics of finite-sized parti-
cles in turbulent flow: the role of faxen forces. Journal of Fluid Mechanics, in press,
2009.
[5] R. Clift, J. R. Grace, and M. E. Weber. Bubbles, drops and particles. Academic Press,
New York, 1978.
[6] E. Deutsch and O. Simonin. Large eddy simulation applied to the motion of par-
ticles in stationary homogeneous fluid turbulence. in Turbulence Modification in
Multiphase Flow, ASME-FED, 110:35–42, 1991.
[7] Renée Gatignol. The faxen formulas for a rigid particle in an unsteady non-
uniform stoke flow. Journal de Mécanique théorique et appliquée, 2(2):143–160, 1983.
[8] Susumu Goto and J. C. Vassilicos. Sweep-stick mechanism of heavy particle clus-
tering in fluid turbulence. Physical Review Letters, 100(5):054503, 2008.
[9] Arthur LaPorta, Greg A. Voth, Alice M. Crawford, Jim Alexander, and Eberhard
Bodenschatz. Fluid particle accelerations in fuly developped turbulence. Nature,
409:1017, February 2001.
[10] Martin R. Maxey and James J. Riley. Equation of motion for a small rigid sphere
in a nonuniform flow. Physics of Fluids, 26(4):883–889, 1983.
[11] N. Mordant, J. Delour, E. Léveque, O. Michel, A. Arnéodo, and J.-F. Pinton. La-
grangian velocity fluctuations in fully developed turbulence: scaling, intermit-
tency and dynamics. Journal of Statistical Physics, 113:701–717, 2003.
[12] Nicolas Mordant, Pascal Metz, Olivier Michel, and Jean-François Pinton. Mea-
surement of lagrangian velocity in fully developed turbulence. Physical Review
Letters, 87(21):214501, 2001.
[13] Nauman M. Qureshi, Unai Arrieta, Christophe Baudet, Yves Gagne, and Mickaël
Bourgoin. Acceleration statistics of inertial particles in turbulent flow. European
Physical Journal B, 66:531–536, 2008.
[14] Nauman M. Qureshi, Mickaël Bourgoin, Christophe Baudet, Alain Cartellier, and
Yves Gagne. Turbulent transport of material particles: an experimental study of
finite size effects. Physical Review Letters, 99:184502, 2007.
[15] R. Volk, E. Calzavarini, G. Verhille, D. Lohse, N. Mordant, J. F. Pinton, and
F. Toschi. Acceleration of heavy and light particles in turbulence: Comparison be-
tween experiments and direct numerical simulations. Physica D, 237(14-17):2084–
2089, 2008.
[16] Greg A. Voth, Arthur LaPorta, Alice M. Crawford, Jim Alexander, and Eberhard
Bodenschatz. Measurement of particle accelerations in fully developed turbu-
lence. Journal of Fluid Mechanics, 469:121–160, 2002.
8You can also read