DISCOVER AUTOLOGS MADE EASIER - This is HVAD, enhanced with Autologs 1.3.
←
→
Page content transcription
If your browser does not render page correctly, please read the page content below
DISCOVER
AUTOLOGS
MADE EASIER
This is HVAD, enhanced with
Autologs™ 1.3.

Medtronic HVAD Autologs 1.3 Atlas

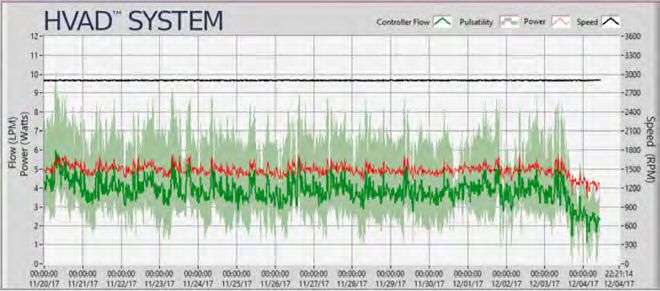
TABLE OF CONTENTS
Background on logfiles................................................................................................... 4

How to request and customize an Autologs 1.3 report............................................... 5–6

Autologs 1.3 report features......................................................................................... 7–15

What to keep in mind when reviewing an Autologs 1.3 report....................................                           16
HVAD™ Pump power speed table.................................................................................. 17
Anatomy of a VAD parameter trends chart.................................................................. 18

Logfile scenarios............................................................................................................ 19–29

Possible contributing factors for observed changes in logfile trends......................... 30

Frequently asked questions........................................................................................... 31
BACKGROUND ON LOGFILES
                   How logfiles are created

                                            Heart Rate
                                                                                                     HVAD Waveform
                   6                        {                         Max flow         Peak
                                                                                                     The HVAD Waveform is a visualization of
                                                                                                     blood flow through the HVAD, which is
    Flow (L/min)

                   5
                       Pulsaility                                     Mean flow       Displayed flow   generated by 3 factors:
                                                                                                       1. Pressure at the inflow of the pump
                   4                                                  Min flow        Trough            2. Pressure at the outflow of the pump
                                                                                                       3. Set speed

                                    1   2         3      4       5      6        7            8

                                                         Time (sec)

                                                                                                     Controller Logfiles
                                                                                                     Every 15 minutes, the controller records the
                                                                                                     flow from the waveform and the pump’s
                                                                                                     speed and power into its logfiles. It also
                                                                                                     records all medium- and high-priority alarms
                                                                                                     at the time they occur. The controller can
                                                                                                     store up to 30 days of pump parameter data
                                                                                                     before overwriting the data in a first in/first
                                                                                                     out fashion.

                                                                                                     Autologs Reports
                                                                                                     When submitted at Autologs.Medtronic.com,
                                                                                                     the data contained in the logfiles is charted
                                                                                                     and organized to simplify pump function
                                                                                                     interpretation. The data shown in the reports
                                                                                                     is summarized to help the user interpret the
                                                                                                     chronological order of events and to identify
                                                                                                     major and long-term trends.

4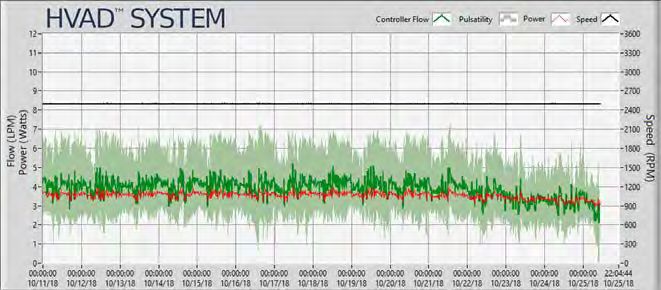
HOW TO REQUEST AN AUTOLOGS 1.3 REPORT
Autologs.Medtronic.com

To promptly receive a report in your inbox:

1. Download logfiles onto the monitor
  n  Connect the Medtronic HeartWare monitor to the patient’s controller.
  n  On the monitor, enter the [Patient] tab and note the patient’s ID.
  n Once the data download icon turns black, the download has completed and you may

     disconnect the monitor cable from the controller.

2. Transfer logfiles to a computer
  n  On the monitor, press the [Log Files] button and a list of patient logs will be displayed.
  n Connect a compatible USB memory stick to the monitor and select the appropriate

     patient ID to be saved.
  n Press the [Save to USB] button. Press [Yes] then [OK] and remove the USB memory

     stick and connect it to your computer.

3. Request Autologs report
  n Navigate to the Autologs secure upload webpage (Autologs.Medtronic.com).
  n Select summarized or detailed alarm view for the Additional Notes Preference.

  n Select the preferred delivery option: Direct download will provide a link to the

    downloaded report.
  n Email delivery will send the report and a direct link to the designated email addresses.

  n Report recipients will auto-populate based on previous activity.

  n Select the desired custom zoom time frame.

  n Select the files to upload. (Note: A full report requires Data, Alarm, and Event files.)

    [Patient ID]_[Controller SN]_alarm_[End Date]_[End Time]
    [Patient ID]_[Controller SN]_data_[End Date]_[End Time]
    [Patient ID]_[Controller SN]_event_[End Date]_[End Time]
    Press [Submit Request].

                                                                                                  5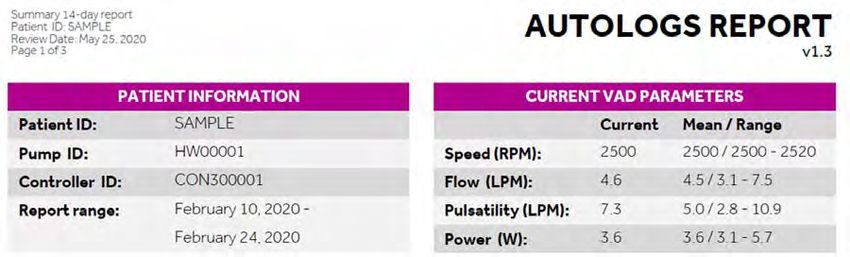
HOW TO CUSTOMIZE YOUR AUTOLOGS 1.3 REPORT
    Autologs.Medtronic.com provides options to adapt reports to your needs

    1. W
        hat time frame do you want to view?
      Select as many report time frames as desired that range from 3 to 90 days. All reports end with the last recorded
      logfile data point and the availability of any length of report is dependent on the content of the logfiles.
    2. W
        ant more information on alarms?
      Select either the Summarized or Detailed view based on the level of information desired.
    3. H
        ow do you want to receive the report?
      The report can either be directly downloaded or an email can be sent with the report and direct link.
    4. W
        ant to enhance a detail?
      If you want to review a particular period in greater
      detail, select the appropriate dates for Custom
      Zoom. Event indicators are only viewable in the
      Custom Zoom window. By default, the last 3 days of
      recorded data will be selected.
    5. R
        eport recipients are auto-populated.                  1
      Your own email address will auto-populate in the
                                                               2
      “Requester Email” field. Additional email addresses
      will auto-populate in the “Additional Report             3
      Recipients” field based on previous activity.
                                                               4
    6. S
        elect the files to upload.
      You may either drag-and-drop the files to the
      upload list or click the [Add Files] button to browse    5
      for the files. Ensure that you include the Data,
      Alarm numbers, and Event files for each patient.
      Additionally, you may submit multiple patient files
      in a single request (upload requests are limited to      6
      10 MB).
    7. S
        ubmit!                                                7
      Click [Submit Request] and the direct link to
      download the report will appear below. If email
      delivery is selected, the report(s) should reach your
      inbox in minutes.

6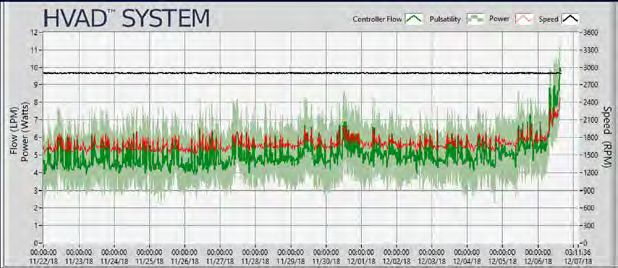
AUTOLOGS 1.3 REPORT FEATURES
Overview
Multiple report                                  Battery                         Custom Zoom
time frames       Parameter mean/range           “end of life” notification      window
Page 8            Page 9                         Page 13                         Page 14

                  Previous settings
                                         Detailed event
                  Page 10                notifications IMPROVED!              Event indicators NEW!
                                         Page 11-12                           Page 14

                                                                                                      7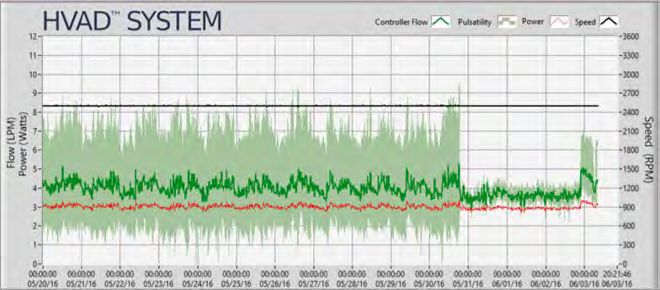
AUTOLOGS 1.3 REPORT FEATURES
     Multiple report time frames
     Autologs users may now select from 3, 7, 14, 30, 60, and 90-day report time frame on the
     Autologs Secure Upload page. The content of the Autologs report will scale according to the
     selected report time frame.

                                                                            Select the desired report time frame
                                                                            On Autologs.Medtronic.com you can
                                                                            select any combination of report time
                                                                            frames to be delivered to your inbox.
                                                                            The default setting is 14 days.

     Report elements scale with the selected time frame
     The Current VAD Parameters, VAD Parameter Trends, and Additional Notes sections will scale their content
     according to the selected report time frame. Please note that the report content is subject to the data
     included in the submitted logfiles. Missing data may lead to gaps in the VAD Parameter Trends chart or in the
     Additional Notes section. If the selected time frame is longer than the available HVAD data, Autologs will crop
     the VAD Parameter Trends chart to the available data. In these cases, it’s possible that the Autologs report
     will show a longer time frame of events and alarms in the Additional Notes section than what is reported in
     the Parameter Trends chart. The mean and range will only be calculated with the available data.

     PRO TIP:
     Consider using the different report lengths for different analyses. For example, use 30, 60, and 90-day reports to monitor
     long-term VAD trends or identify pump issues in patients who visit the clinic infrequently. Use 3, 7, and 14-day reports to
     identify pump status changes since the last clinic visit or perform troubleshooting on recently reported issues.
88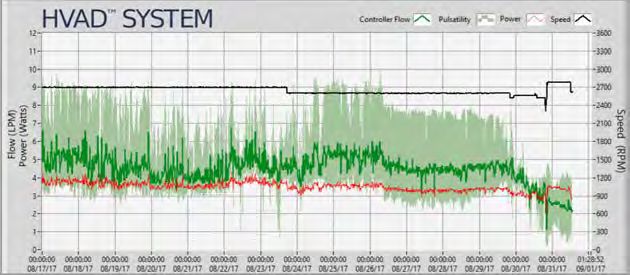
AUTOLOGS 1.3 REPORT FEATURES
Pulsatility data, plus parameter mean and range
The Current VAD Parameters section includes pulsatility data as well as mean and range data for faster
interpretation of the current VAD status.

                                                                        Mean & range scale
                                                                        with report time frame
                                                                        The mean and range
                                                                        displayed in this section are
                                                                        representative of the
                                                                        time frame covered by the
                                                                        report and charted in the VAD
                                                                        Parameter Trends section.

PRO TIP:
Enhance your Autologs interpretation routine by comparing the current VAD parameters against the mean and range
of the chosen period. For example, if the current power is at the maximum end of the range, consider possible causes
and whether this is normal.
                                                                                                                       99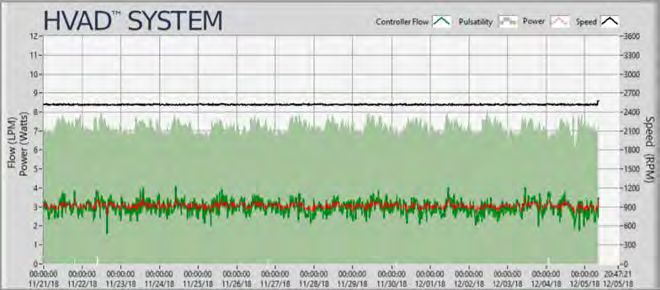
AUTOLOGS 1.3 REPORT FEATURES
      Previous settings
      In addition to providing the controller’s current settings and a timestamp of their last change,
      the Settings section now includes the system’s previous setting.

               N/A                                                   Default
               In the unlikely scenario that the Event               If there has been no change to the setting
               file has been filled to the point that it             since the first time the controller was
               has begun to overwrite old entries and                turned on, the Previous Setting and Last
               a rarely changed setting was among the                Change will display as “Default.”
               overwritten entries, the Autologs
               1.3 report will show N/A for the Previous
               Setting and Last Change until the
               setting is once again changed.

      PRO TIP:
      Consider requesting an Autologs report every time the controller settings are changed. This report can serve as
      documentation for each change to the system and be stored in the patient’s file. For example, to record speed or
      hematocrit changes in the outpatient clinic.

10
 10
IMPROVED AUTOLOGS 1.3 REPORT FEATURES
Detailed additional notes
The content of the Autologs 1.3 Additional Notes section automatically scales with the selected
report time frame, and it provides all of the data that was previously delivered manually by our
engineers, including event details. Additionally, Autologs 1.3 now includes additional information
on events when the detailed report option is selected on the website.
Detailed Event notifications
IMPROVED!
The “Summarized” view will tally the
total number of alarm types if more
than three were triggered in the time
frame. The “Detailed” view will list
the date and time of the alarms that
occurred within the report time frame.
Suction, low flow, and high-power
alarms will always be summarized in
order to maintain a report that is easily
readable/interpretable.
Critical Battery alarm event details
Autologs 1.3 automatically notifies you
of all Critical Battery alarms, including
the associated battery and the battery
capacity at the time of the alarm.
PRO TIP:
Consider using Controller Power-up details to investigate causes. For example, if the power sources before and after
the event are different, this may indicate that the patient had difficulties with a power source exchange and may
benefit from training. If the power sources before and after the event are the same, this may indicate a malfunction
of the equipment.
If the battery capacity at the time of a Critical Battery alarm is > 10%, this may indicate malfunctioning equipment. 1111IMPROVED AUTOLOGS 1.3 REPORT FEATURES
Summarized additional notes
The content of the Autologs 1.3 Additional Notes section automatically scales with the selected
report time frame, and it provides all of the data that was previously delivered manually by our
engineers, including event details. Additionally, Autologs 1.3 now includes additional information
on events when the detailed report option is selected on the website.
Power Disconnect alarms
Autologs 1.3 includes records of unexpected Power n I f a patient reports a power loss event, attempt
Disconnect alarms. Power Disconnect alarms are a to correlate their observation to the power loss
low-priority alarm and therefore do not appear as an duration provided in the report.
n If power sources before and after the event differ,
event indicator in the Custom Zoom window. The
information provided may help distinguish patient this may indicate that the power loss event was due
error from device malfunction. If you suspect patient to patient error while changing power sources.
n If power sources before and after the event are the
error, consider additional education.
What defines a Power Disconnect alarm on a logfile same, this may indicate a device malfunction if the
is different than an alarm on the controller. The patient did not disconnect any power sources.
n If the power loss was preceded by a Critical Battery
Power Disconnect alarm occurs when the controller
has lost communication with a battery for more than alarm, this may indicate that the patient allowed the
60 seconds. battery to drain completely.
Additional Notes informs you about:
n All medium- and high-priority alarms
n Controller power-up events, duration of loss
of power, and associated power sources
n VAD ID not set
n Controller time and date not set
Power Loss event details
n Missing or corrupt logfiles
Autologs 1.3 automatically notifies you of all power loss
events, including the duration of the power loss event, and
the associated power sources before and after the event.
PRO TIP:
Consider using Controller Power-up details to investigate causes. For example, if the power sources before and after the
event are different, this may indicate that the patient had difficulties with a power source exchange and may benefit from
training. If the power sources before and after the event are the same, this may indicate a malfunction of the equipment.
If the battery capacity at the time of a Critical Battery alarm is > 10%, this may indicate malfunctioning equipment.
12
12AUTOLOGS 1.3 REPORT FEATURES
Battery end-of-life notification
The Battery Summary now identifies batteries that lasted less than two hours the last time they were
drained from 100% to < 25%. According to the Instructions for Use, batteries with a duration of less
than two hours or cycle count of > 500 have reached the end of their lives and should be replaced.
PRO TIP:
If during a clinic visit you observe that a patient is close to reaching 500 battery cycles, consider immediately
replacing the battery instead of waiting for the next patient visit where they might have exceeded 500 cycles.
1313UPDATED AUTOLOGS 1.3 REPORT FEATURES
Custom Zoom window
Autologs 1.3 provides the option to request an additional customized chart for a user-specified
time period. This secondary window allows the clinician to focus on important moments to
accelerate investigation. By default, the Zoom window will display the last 3 days of operation.
Full zoom controls on
Autologs.Medtronic.com
The secure upload website allows clinicians to
toggle the Custom Zoom feature and select the
beginning and end of the custom time period.
Any dates may be selected, not just dates within
the report’s time frame.
Event indicators NEW!
n Controller Power-up — Blue
Custom Zoom window on report page 3 n High-priority alarms — Red
You will find the Custom Zoom window at the end of n Medium-priority alarms — Yellow
the Autologs 1.3 report. The content in the rest of Event indicators are only viewable in the Custom
the Autologs 1.3 report is dependent on the selected Zoom window. Low-priority alarms are not flagged.
report time frame and not the Custom Zoom window.
The data displayed in the Custom Zoom window is
dependent on the content of the logfiles.
PRO TIP:
Consider using the Custom Zoom window to investigate the factors leading to important events, for example, the VAD
parameter trends prior to suction or thrombus events.
14
14AUTOLOGS 1.3 REPORT FEATURES
Link to join the HVAD educational email group
Autologs 1.3 includes a direct link to join the Medtronic HVAD educational email group.
This email group highlights Autologs best practices and case studies.
Autologs.Medtronic.com
Link to the HVAD educational email group
PRO TIP:
Important updates and information about the Autologs service are communicated via this email group.
1515WHAT TO KEEP IN MIND WHEN
REVIEWING AN AUTOLOGS 1.3 REPORT
During every patient visit, consider requesting a 3, 7, or 14-day report to identify alarms and
short-term trends since the patient’s last clinic visit, plus a 30, 60, or 90-day report to
visualize long-term trends.
1. Patient information 4. System settings
n Do you have the correct patient? n re primary and backup controller settings
A
n Is the data through the current date? appropriate for the patient?
n Did you select the appropriate report n Are the system settings still appropriate
time frame to capture all VAD data since for the patient?
the patient’s last clinic visit?
2. Current VAD parameters 5. Alarms and events
n Are speed, flow, and power at expected levels? n Are there any unexpected alarms listed?
n Are any parameters above average or even n Do any alarms indicate patient error and is there
close to the range maximum? an opportunity to update the patient’s training?
n Does the Power Consumption Summary n Do any alarms indicate device malfunction?
report “Normal” power for the patient’s n Do you see any trends in the alarm detail view?
current VAD speed?
n If not, is this a new trend?
6. Battery usage
3. Pump performance trends n re any batteries at or close to end of life
A
n Are flow, pulsatility, and power trends consistent? (> 500 cycles or < 2-hour duration)?
n Are there any sudden or gradual deflections n Are there any large time gaps between use
in trends? of certain batteries? Are batteries being
n C
an you correlate the beginning of the trend rotated properly?
with clinical symptoms? n Has the patient kept any obsolete batteries?
n Do you see evidence of suction? Is it persistent?
nDo any additional tests need to be considered
to investigate a change in performance?
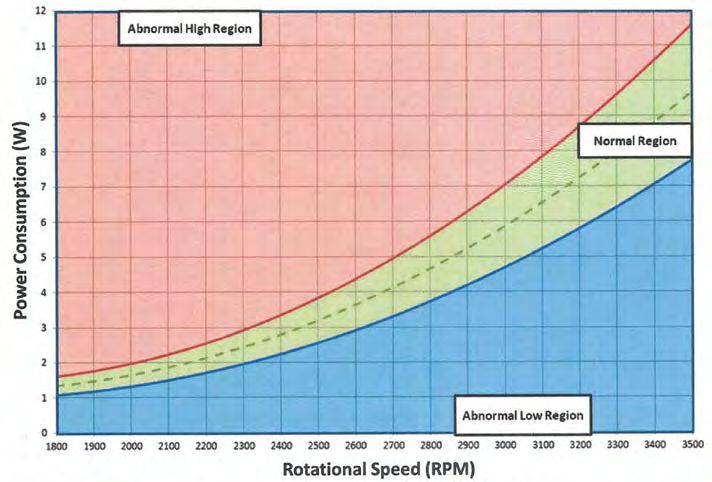
16HVAD PUMP POWER SPEED TABLE
Based on an article published in ASAIO, a 224-patient study compared
HVAD speed and power consumption to identify HVAD operating regions.1
The article identified that for a given speed setting, the HVAD power consumption should
lie in the green “Normal Region.”
If power consumption lies in either the red “Abnormal High Region” or blue “Abnormal Low
Region,” the article found that the HVAD System or patient may require further evaluation.
PRO TIP:
Some patients may normally find themselves in the “Abnormal High Region” or “Abnormal Low Region.”
VAD parameters in a certain region don’t alone necessarily inform patient status, but changes from one
region to the next should be investigated.
1717ANATOMY OF A VAD PARAMETER TRENDS CHART
In this example, the patient’s system has recorded regular and
consistent power, flow, and pulsatility.
Rotational Speed Power Average Flow
Recommended Recommended power Calculated by controller.
operating range is limits by rotational speed Low Flow alarm should be set
2,400-3,200 RPM. listed in table at right.1 2 L/min below average flow.
Recommended power limits
by rotational speed1
Rotational Power (W)
Speed
(RPM) Min Max
2,400 2.2 3.4
2,500 2.6 3.4
2,600 2.9 4.4
2,700 3.3 5.0
2,800 3.7 5.6
2,900 4.2 6.3
Pulsatility Circadian Rhythm
Waveform peak (systole) Many patients experience 3,000 4.7 7.0
minus trough (diastole). a daily rise and fall in flow, 3,100 5.2 7.8
Pulsatility & trough should power, and pulsatility. Look
be > 2 L/min. for breaks in consistency. 3,200 5.8 8.7
PRO TIP:
To keep report review simple, just remember the following mnemonic: Recent, Regular, Reasonable, Record.
Recent: Ensure that the data is up to date and relevant.
Regular: Ensure parameters and settings show consistent trends and expected values.
Reasonable: If any trends deviate, ensure there is an understood reason for the deviation.
18 Record: Record every system interrogation and settings change with an Autologs report.
18LOGFILE SCENARIOS
Out-of-date reports
The Autologs report provides both a “Review Date” and a “Report Range” to help ensure that the data being
reviewed is recent and relevant. The “Review Date” is when the Autologs report was generated, whereas the “Report
Range” is the range of data displayed on the Autologs report. The ending “Report Range” should be the same as
the “Review Date” when looking at logfile data during a clinic visit. If it is not, check to ensure that the correct logfiles
were sent to Autologs, or check the active and backup controller settings to ensure the date has been set correctly.
In the example below, the “Review Date” is not the same as the ending “Report Range.”
HVAD waveforms and logfiles do NOT conform to a single, classic appearance, and are not intended for diagnostic purposes. In addition to
waveforms and logfiles, other measurements, as determined by the physician, are used to assess a patient’s condition. Waveforms and logfiles
represent pump performance, and should be considered in their clinical context.
19LOGFILE SCENARIOS
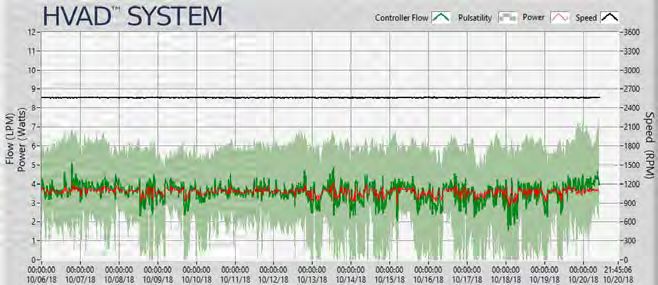
Thrombus
Pump thrombus can build gradually, occur suddenly, or be the result of thrombus ingestion.
The presence of thrombus may increase power consumption as the system tries to maintain the
VAD speed setting despite the increased burden caused by the thrombus. Due to the way that the
controller calculates flow, if power consumption increases, the controller will also report elevated
flow rates. The Autologs report in the setting of thrombus may be characterized by a gradual or sudden
increase in flow and power readings. This increase differentiates thrombus from inflow or outflow
obstructions, because in obstruction cases power consumption would decrease.2
In the examples below, field data later confirmed a pump thrombus.
HVAD waveforms and logfiles do NOT conform to a single, classic appearance, and are not intended for diagnostic purposes. In addition to
waveforms and logfiles, other measurements, as determined by the physician, are used to assess a patient’s condition. Waveforms and logfiles
represent pump performance, and should be considered in their clinical context.
20LOGFILE SCENARIOS
Suction, inflow, and outflow obstruction
Suction
Suction results from either a suboptimal inflow position
and/or a mismatch between left ventricular filling and the
pump speed. Conditions that can lead to suction include
hypovolemia, RV failure, arrhythmias, suboptimal inflow
positioning, tamponade, and the HVAD RPM set too high.
One of the most useful and easily recognizable features
of the HVAD logfile is identification of suction events.
The HVAD logfile in the setting of suction is characterized
by relatively sharp downward deflections toward 0 L/min,
which may also lead to a sustained inflow occlusion.2
Inflow and outflow
Inflow and outflow obstructions result from a physical
occlusion of blood flow through the VAD. Conditions that
can lead to occlusion include thrombus or tissue partially
occluding the inside of the inflow cannula, occluding the
outflow graft, or a kink or stenosis of the outflow graft. The
HVAD logfile allows analysis of power consumption trends to
distinguish between different kinds of blood flow obstruction.
Differentiation between pre-pump and post-pump flow
obstruction is related to the pattern of power decrease.
Pre-pump flow obstruction is characterized by sudden onset
of low power, flow, and pulsatility. In contrast, post-pump
obstruction is characterized by gradual decrease over time.3
In the second example to the right, field data later confirmed
that pump suction caused an occlusion.
HVAD waveforms and logfiles do NOT conform to a single, classic appearance, and are not intended for diagnostic purposes. In addition to
waveforms and logfiles, other measurements, as determined by the physician, are used to assess a patient’s condition. Waveforms and logfiles
represent pump performance, and should be considered in their clinical context.
21LOGFILE SCENARIOS
Right heart failure
Right ventricular failure leads to decreased preload to the left ventricle, resulting in a larger pressure
gradient across the pump in both systole and diastole. In the setting of right heart failure, the Autologs
report may be characterized by a gradual decrease in power, average flow, and pulsatility.
The Autologs report associated with right heart failure may appear similar to that of a severe hypovolemic
state. Differentiation of the two states relies on additional clinical evaluation (e.g., jugular venous distention,
peripheral edema, echocardiographic evaluation, invasive measurement of central venous pressure, PCWP,
and cardiac output).2
In the examples below, field data later confirmed a right heart failure.
HVAD waveforms and logfiles do NOT conform to a single, classic appearance, and are not intended for diagnostic purposes. In addition to
waveforms and logfiles, other measurements, as determined by the physician, are used to assess a patient’s condition. Waveforms and logfiles
represent pump performance, and should be considered in their clinical context.
22LOGFILE SCENARIOS
Arrhythmia
Arrhythmia results in decreased LV diastolic filling time due to increased heart rate and will often translate to
decreased average flow and pulsatility through the pump.2 Due to this potential for major impact on pump dynamics,
it may be of great value to identify undiagnosed arrhythmias and ensure appropriate therapy even for VAD patients.4
In the example below, field data later confirmed arrhythmia.
HVAD waveforms and logfiles do NOT conform to a single, classic appearance, and are not intended for diagnostic purposes. In addition to
waveforms and logfiles, other measurements, as determined by the physician, are used to assess a patient’s condition. Waveforms and logfiles
represent pump performance, and should be considered in their clinical context.
23LOGFILE SCENARIOS
Gastrointestinal bleed
During a gastrointestinal bleed, the Autologs report may register a gradual or sudden decrease in
average flow and pulsatility due to volume loss and a mismatch between a changing blood hematocrit
and static controller hematocrit setting. Additionally, the daily cycle of average flows known as the
circadian rhythm may also be temporarily interrupted.
In the examples below, field data later confirmed gastrointestinal bleed.
HVAD waveforms and logfiles do NOT conform to a single, classic appearance, and are not intended for diagnostic purposes. In addition to
waveforms and logfiles, other measurements, as determined by the physician, are used to assess a patient’s condition. Waveforms and logfiles
represent pump performance, and should be considered in their clinical context.
24LOGFILE SCENARIOS
Hypovolemia
In a hypovolemic state, ventricular systolic and diastolic pressures are reduced, pressure gradient across the pump
is increased, and peak flow, mean flow, and pulsatility decrease.2 In the setting of hypovolemia, the Autologs report
may show a sustained decrease in average flow, pulsatility, and power.
In the examples below, field data later confirmed hypovolemia.
HVAD waveforms and logfiles do NOT conform to a single, classic appearance, and are not intended for diagnostic purposes. In addition to
waveforms and logfiles, other measurements, as determined by the physician, are used to assess a patient’s condition. Waveforms and logfiles
represent pump performance, and should be considered in their clinical context.
25LOGFILE SCENARIOS
Hypertension
Hypertension is characterized by an increase in aortic pressure, which may result in an greatly increased
pressure differential across the HVAD, particularly in diastole.2 This increase in pressure differential can
push flow during diastole to nearly 0 L/min. As a result, the Autologs report in the setting of hypertension is
characterized by increased pulsatility with the possibility of decreased flow.
In the example below, field data later confirmed hypertension.
HVAD waveforms and logfiles do NOT conform to a single, classic appearance, and are not intended for diagnostic purposes. In addition to
waveforms and logfiles, other measurements, as determined by the physician, are used to assess a patient’s condition. Waveforms and logfiles
represent pump performance, and should be considered in their clinical context.
26LOGFILE SCENARIOS
Power disconnect and power loss
The Additional Notes section now provides all of the information that was previously provided by
Medtronic engineers via manual analysis, plus new information such as records of unexpected
Power Disconnect alarms and additional details about power loss events. In the case of a controller
loss of power event, the information provided may help distinguish patient error from device
malfunction. If you suspect patient error, consider additional education.
n If a patient reports a power loss event, attempt to correlate their
observation to the power loss duration provided in the report.
n I f power sources before and after the event differ, this may indicate that
the power loss event was due to patient error while changing power sources.
n I f power sources before and after the event are the same, this may indicate a
device malfunction if the patient did not disconnect any power sources.
n I f the power loss was preceded by a Critical Battery alarm, this may indicate
that the patient allowed the battery to drain completely.
HVAD waveforms and logfiles do NOT conform to a single, classic appearance, and are not intended for diagnostic purposes. In addition to
waveforms and logfiles, other measurements, as determined by the physician, are used to assess a patient’s condition. Waveforms and logfiles
represent pump performance, and should be considered in their clinical context.
27LOGFILE SCENARIOS
Critical Battery alarm
The Additional Notes section now provides the battery capacity at the time of a Critical Battery
alarm. This information could be useful to distinguish patient error from device malfunction.
n I f the battery capacity during a Critical Battery alarm is < 10%, this may be due to patient
error in continuing to drain a battery even while the Low Battery alarm has sounded.
In this case, consider additional patient education.
n If the battery capacity during a Critical Battery alarm is > 10%, this may be due to a
device malfunction.
HVAD waveforms and logfiles do NOT conform to a single, classic appearance, and are not intended for diagnostic purposes. In addition to
waveforms and logfiles, other measurements, as determined by the physician, are used to assess a patient’s condition. Waveforms and logfiles
represent pump performance, and should be considered in their clinical context.
28LOGFILE SCENARIOS
Improper battery management
The Battery Summary provides a great deal of information to help ensure that batteries are well
maintained and that training opportunities for patients are identified. In the example below, there
are three notable issues:
1. Batteries 000001/2 have reached 500 cycles and last less than two hours. They have reached end of life
and should be replaced.
2. Batteries 000003-000006 are very close to end of life and will likely reach end of life before the patient
returns for their following clinic visit. These batteries should be considered for replacement.
3. Batteries 000007/8 have a significantly different cycle count than the rest of the batteries and they were
last used a long time ago. If the patient has had these batteries for the same amount of time as the
others, the clinician should investigate the source of these irregularities and possibly consider additional
patient training.
HVAD waveforms and logfiles do NOT conform to a single, classic appearance, and are not intended for diagnostic purposes. In addition to
waveforms and logfiles, other measurements, as determined by the physician, are used to assess a patient’s condition. Waveforms and logfiles
represent pump performance, and should be considered in their clinical context.
29POSSIBLE CONTRIBUTING FACTORS FOR
OBSERVED CHANGES IN LOGFILE TRENDS
Based on HVAD logfile characteristics1
Though logfile trends exist across all patients, because of the significant variability
in the normal waveform among patients it may be most useful to evaluate changes
from each patient’s own normal pattern. The HVAD logfile should not be interpreted
in isolation but should be considered in its clinical context.2 The table below provides
possible contributing factors for observed changes in logfile trends.
Based on a recently published article in ASAIO, possible factors that may result in observed
logfile trends include1:
HVAD waveforms and logfiles do NOT conform to a single, classic appearance, and are not intended for diagnostic purposes. In addition to
waveforms and logfiles, other measurements, as determined by the physician, are used to assess a patient’s condition. Waveforms and logfiles
represent pump performance, and should be considered in their clinical context.
30FREQUENTLY ASKED QUESTIONS
What is the Autologs Secure Upload Page address? Is there any security against unwanted
Autologs.Medtronic.com. modification of logfiles?
Can I submit Autologs report requests via email? Autologs performs a security check on all
Medtronic has retired email submissions of Autologs submitted files. If any logfile has been modified
requests. All requests should be made via after downloading from the monitor, the user
Autologs.Medtronic.com. will receive a message that says the logfiles could
not be processed.
Can I request manual analysis of logfiles
(HVADlogs reports)? Can multiple sets of logfiles be sent in a
Medtronic has upgraded the Autologs service to single email?
provide the same information as the HVADlogs You may upload several sets of logfiles into a
service, and subsequently retired the HVADlogs single request on the Autologs secure upload
service. If you have any questions about an Autologs website. The single request limit is 10Mb.
report, please contact your Medtronic representative. What happens if I upload multiple logfiles
Is my field representative automatically for a single patient?
copied on my report requests? In the case that multiple logfiles for the same patient
No, Medtronic employees are not automatically ID are submitted, Autologs will combine the data from
copied on report requests. Reports only go to the the various files to create a single report.
email addresses included in the Additional Report How is information organized in the logfile name?
Recipients field. Each logfile name contains 5 pieces of information
I forgot my password for the Medtronic separated by an underscore. The structure is
encrypted email page. What do I do? [Patient ID]_[Controller Serial Number]_
Click “Forgot Password.” You will receive a password [file type (data/event/alarm)]_[Date of last
reset email with a link to set a new password. data point (mmddyy)]_[Time of last data point
(hhmmss)].
Why can’t I access Autologs.Medtronic.com
or the encrypted email page? Does the detailed view of the Additional Notes
Your institution’s information technology group may section include information on high-watt alarms,
need to whitelist these pages. Please notify them of low flow, and suction events?
your need to access these pages. Additional details on high-frequency alarms and
events will not be included in order to maintain a
What are the various dates shown in the report? report that is easily readable/interpretable.
“Report range”: The beginning and ending dates High-watt alarms, low flow, and suction will
of the data points shown in the Autologs report. always be summarized.
“Review Date”: The date that the report was
generated by Autologs. Does Autologs retain historical data?
Data is not archived and therefore historical reports
cannot be recovered. The link to download a report
expires after 60 minutes, and a new request needs to
be submitted after that time.
31References
1
Chorpenning K, Brown MC, Voskoboynikov N, Reyes C, Dierlam AE, Tamez D. HeartWare controller logs a diagnostic tool and clinical management aid
for the HVAD pump. ASAIO J. January-February 2014;60(1):115-118.
2
Rich JD, Burkhoff D. HVAD Flow Waveform Morphologies: Theoretical Foundation and Implications for Clinical Practice. ASAIO J. September-October
2017;63(5):526-535.
3
Scandroglio AM, Kaufmann F, Pieri M, et al. Diagnosis and Treatment Algorithm for Blood Flow Obstructions in Patients With Left Ventricular Assist
Device. J Am Coll Cardiol. June 14, 2016;67(23):2758-2768.
4
Pecha S, Wilke I, Bernhardt A, et al. Clinical experience of combined HeartWare ventricular assist device and implantable cardioverter defibrillator
therapy. J Cardiovasc Electrophysiol. October 2014;25(10):1109-1114.
Brief Statement: HeartWare™ HVAD™ System
Indications for Use the pump to stop. The HVAD™ Pump may cause interference
The HeartWare™ HVAD™ System is indicated for with automatic implantable cardioverter-defibrillators (AICDs),
hemodynamic support in patients with advanced, refracto- which may lead to inappropriate shocks, arrhythmia, and death.
ry left ventricular heart failure; either as a Bridge to Cardiac Chest compressions may pose a risk due to pump location
Transplantation (BTT), myocardial recovery, or as and position of the outflow graft on the aorta — use clinical
Destination Therapy (DT) in patients for whom judgment. If chest compressions have been administered,
subsequent transplantation is not planned. confirm function and positioning of HVAD Pump post CPR.
Contraindications Potential Complications
The HeartWare System is contraindicated in patients who Implantation of a VAD is an invasive procedure requiring
cannot tolerate anticoagulation therapy. general anesthesia and entry into the thoracic cavity. There are
numerous known risks associated with this surgical procedure
Warnings/Precautions
and the therapy including, but not limited to, death, stroke,
Proper usage and maintenance of the HVAD™ System neurological dysfunction, device malfunction, peripheral
is critical for the functioning of the device. Serious and and device-related thromboembolic events, bleeding, right
life threatening adverse events, including stroke, have ventricular failure, infection, hemolysis, and sepsis.
been associated with use of this device. Blood pressure
management may reduce the risk of stroke. Never disconnect Refer to the “Instructions for Use” for detailed information
from two power sources at the same time (batteries or power regarding the implant procedure, indications, contraindications,
adapters) since this will stop the pump, which could lead to warnings, precautions, and potential adverse events prior
serious injury or death. At least one power source must be to using this device.
connected at all times. Always keep a spare controller and Caution: Federal law (USA) restricts these devices to sale by or
fully charged spare batteries available at all times in case of on the order of a physician.
an emergency. Do not disconnect the driveline from the
controller or the pump will stop. Avoid devices and conditions
that may induce strong static discharges as this may cause
the VAD to perform improperly or stop. Magnetic resonance
imaging (MRI) could cause harm to the patient or could cause
Medtronic
710 Medtronic Parkway UC201909382a EN 07/2020
Minneapolis, MN 55432-5604 ©2020 Medtronic.
USA Minneapolis, MN. All Rights Reserved.
Toll-free in USA: 800.633.8766 Medtronic, Medtronic logo, and Further, Together are
Worldwide: +1.763.514.4000 trademarks of Medtronic. ™Third party brands are
trademarks of their respective owners. All other brands are
medtronic.com trademarks of a Medtronic company. Printed in the USA.You can also read