Assessment of Bankline Changes of River Ganga around Patna City, India, using Multi Temporal Satellite Data
←
→
Page content transcription
If your browser does not render page correctly, please read the page content below
Indexed in
Scopus Compendex and Geobase Elsevier, Chemical
Abstract Services-USA, Geo-Ref Information Services-USA
ISSN 0974-5904, Volume 05, No. 03
www.cafetinnova.org June 2012, P.P. 442-450
Assessment of Bankline Changes of River Ganga around Patna City,
India, using Multi Temporal Satellite Data
SHANKAR DAYAL and D. S. PATTANAIK
Department of Geology, Utkal University, Bhubaneswar, Odisha, India
Email: shankard656@gmail.com
Abstract: The river Ganga between Chapra in the upstream and Athmalgola in the downstream, fringing northern
limit of Patna city flows in a 5 – 10 km wide, N - S oscillating channel. The Ganga, in this stretch of 96 km, is
characterised by swelling and pinching of channel in meandering style, widening under the influence of descending
tributaries from both banks. The tributaries discharge heavy sediment load and choke the river channel gradually and
initiate bankline failure. The river bank erosion is related to inhomogeneity in bank material, geotechnical instability
and sub-aerial weathering of sediments. Sequential changes in the position of bankline of the river due to consistent
bank erosion have been studied from Landsat TM digital satellite data of pre monsoon (April) 1975, 1988, 1999 and
2010 on GIS platform. Study of bankline shift due to the bank erosion has been carried out for the periods 1975–
1988, 1988–1999 and 1999–2010 at 8 sections ( I – VIII ), each covering an average of 12 km length. Two broad
kinds of change are observed; there are defined sections along the bankline which are very much prone to changes
and also sections completely devoid of any change. The undercutting of the mid channel bars and alluvial islands is
marked by the deposition of fresh sediments along the bankline. The dynamic nature of bankline helped in
identification of strong erosional and depositional characters of the river. The bankline has reshaped several times
during the last 35 years along the selected stretch.
Keywords: Ganga, Bankline, Erosion, Deposition and shift.
Introduction: stream, covering 25027’24” N - 25045’00” N latitude
and 84045’00” E - 85032’42” E longitude. The river
Ganga is the imprint of civilization and culture in India.
Ganga has four main tributaries in this stretch; river
The river has a 2525 km2 large basin and the study area
Ghagra and Gandak coming from Himalayan catchment
covers about 26.2% of the total basinal area. Monsoon
(North) while river Son and Punpun coming from
(June – September) brings heavy rain in the catchment
peninsular catchment (South). General flow direction of
area, which determines the volume of water in the main
river Ganga is W - E. Near Chapra, the river Ghagra
channel Ganga and its tributaries. Milliman and Meads
coming from Himalayan catchment (North) meets
(1983) calculated the total annual discharge in Ganga –
Ganga on the left bank. The flow direction of Ghagra is
Brahmaputra system to 1.7*109 t. Any alluvial river of
NW – SE. The peninsular river Son, which is coming
such magnitude has problem of sediment erosion –
from south, meets Ganga on the right bank. The flow
deposition attached with it. The tributaries discharge
direction of river Son is SW - NE. Further downstream,
heavy sediment load and choked the river channel
another Himalayan river Gandak, which is coming from
gradually and this initiated bankline erosion. The
north, meets Ganga on the left bank .The general flow
banklines have reshaped several times during the last 35
direction of river Gandak is NNW - SSE. Further down
years and the shift in bankline is marked by erosion and
stream, another river Punpun meets Ganga on the right
deposition along the bank.
bank.
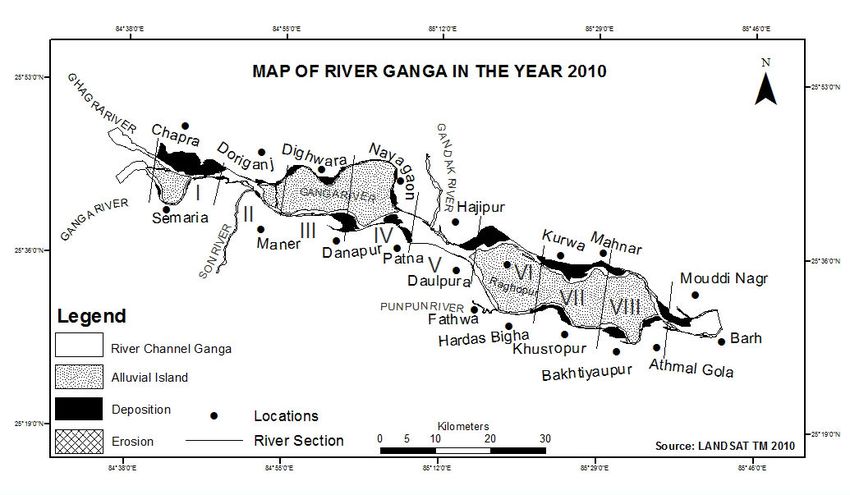
The study area extends almost 96 km W - E from
Chapra in the upstream upto Athmalgola in the down
#02050311 Copyright ©2012 CAFET-INNOVA TECHNICAL SOCIETY. All rights reserved.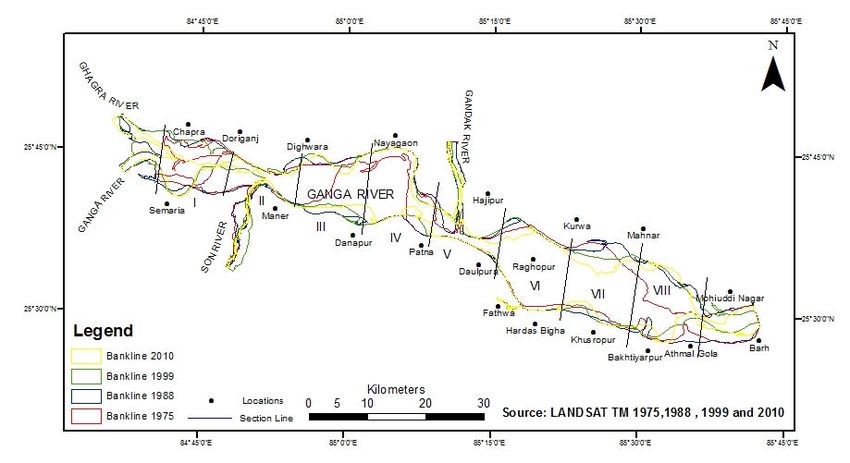
SHANKAR DAYAL and D. S. PATTANAIK                                          443

            Figure 1: Location Map of Study Area Showing different Sections (I-Viii) Along River Ganga
Methodology:                                                  and deposition along the bankline and subsequent shift
                                                              along the bankline was measured. The shift in bankline
The Landsat TM data of premonsoon (April) 1975,
                                                              was measured with respect to change in bank of 1975.
1988, 1999 and 2010 were used to study the bankline
                                                              Since, the river Ganga is flowing west to east and the
changes of river Ganga through Patna city. The Landsat
                                                              left and right banks are on the north and south of the
TM data of 1975 with the band combination 3, 2 and 1
                                                              flow direction, therefore, any shift in bankline is
gave good geomorphic features. Similarly, the Landsat
                                                              measured with respect to the north and south shift of the
TM data of 1988, 1999 and 2010 with the band
                                                              bankline. Moreover, any shift of bankline inching
combination 7, 4 and 2 provided distinct geomorphic
                                                              towards the mid channel flow is marked by deposition
features.
                                                              and any shift of bankline inching away from mid
These data were registered and resampled to 24 pixel          channel flow is marked by erosion. The shift in bankline
size to keep uniformity in data set. The visual               is also marked by addition of new land along the banks
interpretation of the bankline was done based on tone,        known as deposition or removal of present land known
texture and colour. The bankline of 1975, 1988, 1999          as erosion. The addition or subtraction of land along the
and 2010 were generated in the GIS platform using Arc         banks is measured as shift in bankline which is the
GIS 10. On overlying the respective bankline coverage,        lateral distance covered during the process of deposition
changes in the bankline in terms of erosion and               and erosion. The bankline shift in 1999 and 2010 were
deposition were obtained, which helped in thematic            measured in similar manner.
mapping of the bankline changes on 1:50000 scale. To
                                                              Results and Discussion:
study the shift in bankline, the 96 km stretch of the river
was divided into 8 sections at 12 km interval (Fig. 1).       The bankline changes of River Ganga in the study area
The bankline changes were studied based on the activity       from 1975 to 2010 are shown in Table – 1 and the
of erosion and deposition along the right and left banks.     extent of erosion and deposition in the bankline over
                                                              these years are graphically represented in figures III A -
The bankline of river Ganga for the year 1975 was taken
                                                              VB.
as base map. The bankline of year 1988 was over laid
on base map of 1975 to assess the activity of erosion

                               International Journal of Earth Sciences and Engineering
                              ISSN 0974-5904, Vol. 05, No. 03, June 2012, pp. 442-450
444 Assessment of Bankline Changes of River Ganga around Patna City, India,
using Multi Temporal Satellite Data
Table 1: Bankline Changes of River Ganga in the Study Area from 1975 To 2010
Section Year of Change in bank area
Sl.No. Bankline segment ( km) Total bankline change
No. imagery ( km2)
Left Right Left Right Area
Bank Bank Bank Bank (km2)
Left Bank Right Bank
Eros Dep Eros Dep Eros Dep Eros Dep
Eros Dep Eros Dep
14.0 4.0 0-12 0-6
1988 14.0 5.4
1.4 7-12
1. I 0.5 0.5 1.4 3.5 0-1.5 1.5-3.5 3-6 0-3
1999 1.0 4.5 1.4 26.5
(0 – 12 0.5 4.1 23.0 3.5-6.0 6-10.7 6-12
Km) 34.0 0.9 1.0 0-12 2-6 1-1.8
2010 0.5 6-7 34.0 0.9 2.0
0.5 7-9.8
1988 1.3 1.0 2.2 1.5 20-24 12-20 12-22 22-24 1.3 1.0 2.2 1.5
8.5 12-18 12-17
1999 0.5 4.5 1.0 18-22 17-21 0.5 4.5 10.0
II
0.5 18-24 21-24
2. (12-24Km)
0.4 1.7 0.7 12-16 12-14
0.1 1.7 16-18 14-19
2010 0.1 2.4 1.9 1.3
0.6 18-24 19-21
2.0 0.2 21-24
1988 2.5 6.1 24-31 26-36 2.5 6.1
0.1 0.3 24-24.5 24-26
III 1999 2.0 13.1 24.5-29.5 26-34 2.0 4.1 1.1 13.1
3.
(24-36Km) 4.0 0.8 29.5-33 34-36
2.2 2.1 6.1 24-27 24-33 33-36
2010 0.4 6.4 2.1 6.1
0.4 4.2 27-30 30-36
1988 1.5 3.7 43-48 36-43 1.5 3.7
IV 42.6-
1999 5.4 6.5 43.8-48 5.4 6.5
4. (36- 47
48Km) 4.7 36-40
2010 3.0 8.7
3.0 4.0 44-48 43-48
3.0 1.0 48-50 56-60
1988
0.5 53-55 4.0 0.5 1.0
1.0 58-60
V 0.6 57-60
5 (48- 0.7 48-49 6.0 0.7 0.6
1999
60Km) 6.0 49-60
0.7 50-52
2010
1.8 52-56 1.8 5.7
5.0 56-60
1988 4.5 7.0 60-65 66-72
4.5 8.4 7.0
8.4 65-72
VI
1999 3.0 60-63
6 (60- 3.0 0.2
0.2 70-72
72Km)
14.0 0.3 60-66 70-72
2010 14.8 0.3
0.8 70-72
5.5 5.5 2.7 72-84 72-79 79-80
1988 5.5 5.9 2.7
0.4 80-84
4.2 72-76
76-
1.1
VII 80.6
7 1999 0.6 15.6 1.1 5.5
(72- 80.6-
1.3
84Km) 84
15.6 72-84
6.3 72-79
2010 19.6 6.3
19.6 72-84
5.0 0.5 1.2 0.5 84-91 93-94 84-92 92-96
1988 5.5 1.0 1.2 0.5
0.5 0.5 94-95 93-94
86-
VIII 4.5 3.5 1.2 0.4 84-91.7 93-96 84-86
87.4
8 (84- 1999 4.5 3.5 1.2 23.0
87.4-
96Km) 22.6
96
3.0 3.4 1.6 5.4 89-94 84-89 89-92 86-89
2010 3.0 7.6 3.6 9.0
4.2 2.0 3.6 94-96 95-96 92-94
International Journal of Earth Sciences and Engineering
ISSN 0974-5904, Vol. 05, No. 03, June 2012, pp. 442-450SHANKAR DAYAL and D. S. PATTANAIK 445
The general configuration of river Ganga in 0-12 km understanding the stability of the bankline (Little et al,
section (section I) is sudden bending of the river 1982). The bank material comprises mainly clay – silt
channel. The descending Ghagra discharges heavy material and when the slope is almost vertical, there is
sediments into the main channel, Ganga. During 1975- bankline failure due to over steeping. In lower reaches,
1988, the left bank has deposition of 14.0 km2 (near where materials are cohesive and resistant to fluid shear,
Chapra) and the bankline shifted almost 2 km south. In bank heights exceed the critical geotechnical instability
1988-1999, the left bank has deposition of 4.5 km2 and threshold and result in mass failure of bank (Lawler,
the bankline shifted almost 2.8 km south. Left bank also 1995).
witnessed erosion of 0.1 km2 and the bankline shifted
The 24-36 km section (section III) is marked by braided
almost 0.7 km north. But during 1999-2010 there was
river pattern. During 1975-1988, both banks had only
deposition of 34.0 km2 and the left bankline had highest
erosion and the significant erosion was found to be 6.1
shift of almost 4 km south. The high rate of deposition
km2 between 26-36 km on the right bank and bankline
along the left bank is attributed to voluminous sediment
shifted almost 2 km south (between Maner and
discharge from Ghagra. Similarly, during 1975-1988,
Danapur). Deposition predominated during 1988-1999;
the right bank has erosion of 5.4 km2 and the bankline
the left bank had deposition of 4.1 km2 whereas the
shifted almost 1.5 km south whereas during 1988-1999,
right bank had deposition of 13.1 km2 between 26-34
the right bank has deposition of 26.5 km2 and the shift
km (near Danapur) and the bankline shifted almost 1.6
in bankline was almost 6.8 km north. For the year 1999-
km north. This trend continued during 1999-2010 and
2010, the bankline has deposition of about 2.0 km2 and
the depositional area further increased by 6.4 km2 on the
erosion of 0.9 km2.The bankline shifted almost 1.2 km
left bank and 6.1 km2 on the right bank between 33-36
north and 0.3 km south. The gradual increasing size of
km and the bankline shifted almost 3.4 km north near
the mid channel bar and divided bank material of Ganga
Danapur. The strong depositional character on the right
and Ghagra change the flow direction which produces
bank at a stretch between 26-36 km is due to protruding
severe bank caving along the right bank at a stretch
older alluvium into the river, which offer suitable site
from 3-7 km, which leads to bankline failure. Therefore,
for deposition. Moreover, the finely divided bank
the general tendency of river Ganga from 0-12 km
material of Ganga and Son change the flow direction
stretch is swallowing channel. Thus the river has
and made suitable deposition near Danapur. As Huang
systematic tendency of bank erosion to increase
et al (1991) have remarked, the process of detachment,
downstream (Hook, 1980; Hasegawa, 1989).
transportation and deposition occur concurrently in
The 12-24 km section (section II) has erosion and river.
deposition on both banks. The left bank has deposition
The 36-48 km section (section IV) is characterised by
of 1.0 km2 between 12–20 km near Doriganj for the year
only erosion on both banks during 1975-1988. The
1975-1988 and the bankline shifted almost 0.5 km
depositional character increased from 1988 onwards.
south. During 1988-1999, the left bank has deposition of
During 1988-1999, there was only deposition and the
4.5 km2 between 18-22 km and the bankline shifted
total depositional area on the left and right banks was
almost 1.2 km south. Again for the year 1999-2010, the
found to be 5.4 km2 and 6.5 km2 respectively. The same
left bank has deposition of 2.4 km2 at a stretch between
was the case during 1999-2010 and the total
12-24 km and the bankline shifted almost 1.3 km south.
depositional area on the left and right banks was found
This means that during 1988-1999, at a stretch between
to be 3.0 km2 and 8.7 km2 respectively.
18–22 km, the left bank has maximum deposition which
was opposite to the confluence of Son River whereas The 48-60 km section (section V) is marked by strong
the erosion along this stretch was not so significant. On erosional activity on left bank during 1975-1988 and
the right bank, there was decreasing tendency of 1988-1999. However, deposition predominated during
bankline erosion for year 1988-1999 and there was 1999-2010; the 56-60 km stretch on the left bank had
deposition of 10.0 km2 at a stretch between 12-24 km. maximum deposition of 5.0 km2 along the mouth of
This led to the shift of bankline by almost 4.7 km north. Gandak River and the bankline shifted almost 2.2 km
There is also very important phenomenon that south. The right bank in this stretch is solid (man made)
increasing size of the mid channel bar has divided the and hence free from fluvial erosion. Therefore, the right
river water from single channel into two different bankline has not changed along the east of Patna city
channels flowing along the right bank and the left bank. during the last 35 years.
It was revealed by field visit that bank retreat is a
Between 60 km and 72 km (section VI) the increasing
common phenomenon along the left bank (Near
size of midchannel bars has led to the formation of
Doriganj). Bank retreat often occurs by mass failure of
largest alluvial island of Raghopur. The aggraded
unstable blocks (Kesel & Baumann, 1981).The slope
alluvial island divided the river channel of Ganga along
stability model of bank failure is quite successful in
the right bank and the left bank. The increasing size of
International Journal of Earth Sciences and Engineering
ISSN 0974-5904, Vol. 05, No. 03, June 2012, pp. 442-450446 Assessment of Bankline Changes of River Ganga around Patna City, India,
using Multi Temporal Satellite Data
the mid channel bar diverted the channel flow along the during the flood stage (undercutting) and the other
bankline which offered significant erosion for bankline during receding water stage (flow of highly saturated
change. During 1975-1988, left bank had deposition of sediments). However, the intensity of slumping is more
8.4 km2 at a stretch between 65-72 km and the bankline acute after the flood stage; the flood water provides
shifted almost 1 km south whereas on the right bank an additional support to bank material as the pore spaces of
area of 7.0 km2 was eroded at a stretch between 66-72 the loosely bound bank materials are occupied by water
km (near Fathua) and the bankline shifted almost 1.5 km and act as a continuous system. With fall in water level,
south. Similarly, during 1999-2010, there was the support diminishes abruptly and the bank material is
deposition of 14.8 km2 on the left bank at a stretch subjected to failure.
between 60-72 km and the bankline shifted almost 3.5
Many sub - aerial weathering processes cause bank
km south.
sediments to flow or condition bank material for fluvial
The 72- 84 km stretch (section VII) is the continuity of removal. (Twidale, 1964; Lawler, 1993a). The fluvial
divided river channel flow due to presence of large erosion of cohesive soils is extremely complex and is
alluvial island. The divided river channel has narrow related to soil properties and test conditions (Grissinger
width and within the narrowed channel width the river 1982). The soils with high silt-clay content are more
performed erosional and depositional activities. During susceptible to effects of sub - aerial processes, which
1975-1988, the left bank had erosion of 5.5 km2 and the make the soils less resistant to erosion by hydraulic
shift in bankline was almost 0.5 km north whereas the force (Couper, 2003). During winter, the temperature of
right bank had maximum of 5.9 km2 area under erosion the soil water decreases, it expands and this increases
and the bankline shifted almost 0.7 km south. During the soil volume (Lawler, 1993). Increase in soil
1988-1999, the depositional activity dominated over moisture content acts to decrease the magnitude of inter
erosion on both banks; however, the maximum particles forces within the material (Craig, 1992). This
deposition of 15.6 km2 was witnessed on the left bank reduces the resistance to the shear force associated with
and the bankline shifted almost 2.7 km south. In 1999- the flow causing bankline failure. But at the same time
2010, both the banks had only deposition and no erosion low moisture content can also weaken the soil.
but the maximum deposition was found to be 19.6 km2 Therefore, the river banks are the supplier of sediments
on the left bank and the bankline shifted 3.4 km south. to fluvial system (Church & Slay marker, 1989;
Lapointe & Carson 1986; Pretegaard, 1988).
The 84-96 km stretch (section VIII) is the continuous
portion of the braided channel. It is also the extended Desiccation processes are also significant at some sites
portion of the large alluvial island. The finally divided in river banks (Bello et al, 1978; Lawler, 1992). The
river channel flowed along the left bank and the right desiccation is inversely related to rainfall and positively
bank. Both the banks have very active processes of related to riparian summer air temperature and bank
erosion and deposition, but the most significant activity evaporation rates and may increase insignificantly with
in this section was deposition of 23.0 km2 on the right declining altitude downstream (Lawler, 1995). Leaching
bank during 1988-1999, resulting in shift of bankline to of clay minerals may also contribute to great extent of
north by 4.0 km. bank failure (Thorne and Osman, 1988). The high rate
of retreat occurs as a result of high flow during
The bank material along 96 km stretch of Ganga is
prolonged wet periods, rather than largest storm of
rarely homogeneous in composition and results in
floods (Wolman, 1959). The braided nature of river also
uneven bank slumping. This causes the flow to take a
represents a high energy fluvial environment often
different path and the orientation of the bankline to the
characterized by non-cohesive banks lacking vegetation
direction of flow also changes. Ground observation also
and consequently high rate of bank erosion and bed load
reveals that at some localities older alluvium protruding
transport (Thomas & Nicholas, 2002).
into the river offer significant resistance to flow and
causes constant change in flow direction producing From the above discussions, it is found that during
severe bank caving along the channel. When the flow 1975-1988, erosion along both banks was more
approaches the bank at an angle, severe under cutting pronounced than deposition. From 1988 to 1999,
takes place resulting in slumping of sediments. Slumps deposition became more pronounced along the right
are common along banks composed of clayey silt and bank near Semaria, Danapur, Patna (west) and
silty clay. Quite often, the highly saturated clayey silt Bakhtiyarpur. During 1999-2010, deposition dominated
liquefy and tend to flow towards the channel as a result along the left bank near Chapra, Dighwara, Hajipur and
of which the overlying, less saturated bank sediments Mahnar. The 0-21 km, 22.2-38.3 km, 42.6-48.4 km,
tend to slump along well defined shear planes. Thus, 71.6-80.8 km and 82.3-96 km segments on the right
there appears to be two prominent types of slumping bank had reshaped several times during 1975 - 2010.
which causes the bankline to recede; one operating Similarly on the left bank, stretches from 0-13.6 km,
International Journal of Earth Sciences and Engineering
ISSN 0974-5904, Vol. 05, No. 03, June 2012, pp. 442-450SHANKAR DAYAL and D. S. PATTANAIK 447
18.1-34.3 km, 42.7-66.0 km and 70.6-96 km had dynamic in nature with strong erosional and
reshaped several times. This was also concluded from depositional activities during last 35 years. The
super imposing of the banklines of 1975, 1988, 1999 erosional and depositional trend along the different
and 2010 (Figure II). These stretches were very sections is graphically represented in figures IIIA - VB.
Figure 2: Map Showing Dynamic Character of Bankline along Different Sections
Figure 3A: Extent of Erosion and Deposition on Right Bank of River Ganga (1975-1988)
Figure 3B: Extent of Erosion and Deposition on Left Bank of River Ganga (1975-1988)
International Journal of Earth Sciences and Engineering
ISSN 0974-5904, Vol. 05, No. 03, June 2012, pp. 442-450448 Assessment of Bankline Changes of River Ganga around Patna City, India,
using Multi Temporal Satellite Data
Figure 4A: Extent of Erosion and Deposition in Right Bank of River Ganga (1988-1999)
Figure 4B: Extent of Erosion and Deposition on Left Bank of River Ganga (1988-1999)
Figure 5A: Extent of Erosion and Deposition on Right Bank of River Ganga (1999-2010)
Figure 5B: Extent of Erosion and Deposition on Left Bank of River Ganga (1999-2010)
Conclusion: carry sediments. The sediments are deposited at the site
where the velocity of water is checked in mid channel
The river Ganga is bounded by cliffed alluvial surface
flow. This leads to the formation of several bars along
and lateral shifting is limited to a scale of several
the mid-channel flow. It is also found that channel bars
kilometres and so in the 96 km stretch through Patna
are readjusted annually after flood. The readjustments
city (Singh, 2007). It is a dynamic river system and
are in terms of shape, size and relocation of bars. Most
channel along this stretch is choked. The tributaries are
of the mid-channel bars are aggraded to form alluvial
discharging large volume of sediments into the main
island. The increasing size of mid-channel bars and
channel Ganga but along the mouth of tributary the
alluvial islands are largely responsible for bankline
sediments are washed away due to high velocity of
failure. During 1975 - 1988, the right bank at a stretch
water. The peculiar nature of increasing channel width
from 0 - 6 km and 26 - 43 km, had bankline failure
and subsequent squeezing of channel width along the
while on the left bank at a stretch from 20 - 28 km, 45 -
tributary mouth reflects the incompetency of river to
International Journal of Earth Sciences and Engineering
ISSN 0974-5904, Vol. 05, No. 03, June 2012, pp. 442-450SHANKAR DAYAL and D. S. PATTANAIK 449
52 km, 58 - 67 km and 78 - 96 km, the bankline failure [3] Church, M & Slaymaker, O. (1989) Disequilibrium
was prominent. During 1988 – 1999, the right bank had of Holocene sediment yield in glaciated British
bankline failure from 3 - 6 km (Near Semaria), 20 - 26 Columbia, Nature 337, 452-454.
km (Near Maner), 68 - 70 km (Near Hardasbigha) and [4] Couper, P.2003.Effects of silt –clay content on the
76 - 79 km (Near Khushropur). On the left bank, the susceptibility of river banks to subaerial erosion.
bankline failure occurred at 20 - 21 km (down of Geomorphology, 56:95-108.
Doriganj), 25 - 27 km (upstream of Dighwara), 49 - 51 [5] Craig, R.F., Soil Mechanics, Chapman and Hall,
km (mouth of Gandak) and 58 - 62 km. During 1999 - London, 1992, 5th edn.
2010, the right bank had erosion along the stretches [6] Grissinger, E.H. (1982) Bank erosion of cohesive
from 3 - 6 km (Near Semaria), 20 - 32 km and 89 - 92 materials. In Gravel Bed River (ed.by R.D. Hey,
km (Near Bakhtiyarpur) while the left bank had erosion J.C. Bathurst & C.R.Thorne).
in the stretches from 26 - 29 km (upstream Dighwara), [7] Hasegawa, K. (1989) Studies on qualitative
50 - 55km (Near Hajipur) and 86 - 94 km. The prediction of meander channel shift. In River
comparative study of the bankline changes shows that Meandering (ed. by S.Ikeda & G. Parker). AGU,
up to 1988, the bankline had erosive tendency and Washington, D.C.
bankline failure was a common phenomenon. [8] Hooke, J.M. (1980) Migration and distribution of
rates of river bank erosion. Earth Surf. Processes 5,
On the right bank, the 43 - 58 km stretch along the east
143-157.
of city of Patna has no bankline failure during the last
[9] Huang, N.W. 1975. The factors determining the
35 years. Similarly on the left bank at a stretch from 32
extent of soil erosion. The Greenland. R (Ed.) soil
– 43 km near Nayagaon saria, there is no bankline
conservation and Management in the Humid
failure. This is due to solid bank material of the
Tropics. John Wiley and Sons.
bankline and human interference. But down of this
[10] Kesel, R.H. & Bauman, R.H. (1981) Bluff erosion
stable landmass, the river had widening tendency. The
of a Mississipi river meanders at Port Hudson,
aggrading tendency of the mid-channel bars further lead
Louisiana.Phys. geogr.2, 62-82.
to the formation of large size alluvial islands like
[11] Lapointe, M.F. & Carson, M.A. (1986) Migration
Raghopur Diara.The flows diverted sideways and
patterns of an asymmetric meander river: the Rough
caused extensive bankline erosion.
River, Qubec Wat. Resour. Res. 22, 731-743.
From 1999 onwards the intensity of bankline failure [12] Lawler, D.M. (1992) Process dominance in bank
decreased as the size of the mid-channel bars and erosion system. In: Lowland Floodplain Rivers:
alluvial islands have attained the maximum limit in the Geomorphological Perspective (ed.by P.A.Carling
mid-channel flow. Therefore, the mid-channel bars and & G.E. Petts) Wiley, Ch; Chester, U.K.
alluvial islands were readjusted with the fresh volume of [13] Lawler, D.M. (1993 a) Needle ice processes and
water discharge in the channel. To maintain the flow of sediment mobilization on river banks: the River
the fresh volume of water in the channel, the water flow Ilston, West Glamorgan, and U.K. J.Hydrol. 150,
eroded the side wall of the mid-channel bars and 81-114.
alluvial islands. The eroded sediments were deposited [14] Lawler, D.M. (1995) the impact of scale on the
along the bankline of the river. The banklines were process of Channel – side sediment supply; A
reshaped with fresh sediment deposition and new lands conceptual model. Effects of the scale on
have been reclaimed along the left and right banks. Interpretation of sediment and water Quality
(Proceeding of a Boulder Symposium, July 1995).
References:
IAHS Publ. No. 226, 1995, 175-184.
[1] Bardhan, M. (1993). Channel stability of Barak [15] Little, W.C., Thorne, C.B & Murphy, J.B. (1982)
river and its tributaries between Manipur –Assam – Mass bank failure of selected Yazoo basin streams
Bangladesh borders as seen from satellite imagery, .Trans. Am. Soc. Agric .Engrs 25, 1321 -1328.
Proc. National Symposium on Remote Sensing [16] Milliman, J.D. and Mead, R.H. (1983) Worldwide
Application for Resource Management with special delivery of river sediments to the Oceans, Journal
emphasis on NE Region , held at Guwahati from of Geology, 91, 1-21.
Nov 25-27 , PP 481- 485. [17] Prestegaard, K.L. (1988) Morphological controls on
[2] Bello,A.,Day, D, Douglas,J., Lam, K. & Soh , sediment delivery Pathways. In: sediment Budget
Z.B.H.A. ( 1978) Field experiments to analyse (Ed. By M.P. Bordas & D.E. Walling; Proc. Porto
runoff , sediment and solute production in the New Alegre symp. 1988) IAHS Publ. No.174.
England region of Australia . Z. Geomorphol.N.F. [18] Singh, I.B. (2007) Large River: The Ganga River,
Suppl.Bd. 29, 180 -190. 347-371, Wiley & Sons, Ltd.
International Journal of Earth Sciences and Engineering
ISSN 0974-5904, Vol. 05, No. 03, June 2012, pp. 442-450450 Assessment of Bankline Changes of River Ganga around Patna City, India,
using Multi Temporal Satellite Data
[19] Thomas, R and Nicholas, A.P., Simulation of (ed. White, W.R), Hydraulic Research, Walliford,
braided river flow using a new cellular routing 1988, PP.134-148.
scheme. Geomorphology, 2002, 43.173-195. [21] Twidale, C.R. (1964) Erosion of an alluvial bank at
[20] Thorne, C.R. and Osman, A.M; The influence of birdwood, South Australia .Z.Geomorphol.8, 189-
bank stability on regime geometry of natural 211.
channels. In International conference River Regime [22] Wolman, M.G., Factors influencing erosion of a
cohesive river bank .Am. J. Sci., 1959, 257, 204.
International Journal of Earth Sciences and Engineering
ISSN 0974-5904, Vol. 05, No. 03, June 2012, pp. 442-450You can also read