Interim Results Presentation - For the 26 weeks ended 26 June 2016 - Massmart
←
→
Page content transcription
If your browser does not render page correctly, please read the page content below
Interim
Results
Presentation
For the 26 weeks ended
26 June 2016

Interim results Presentation August 2016
                                           2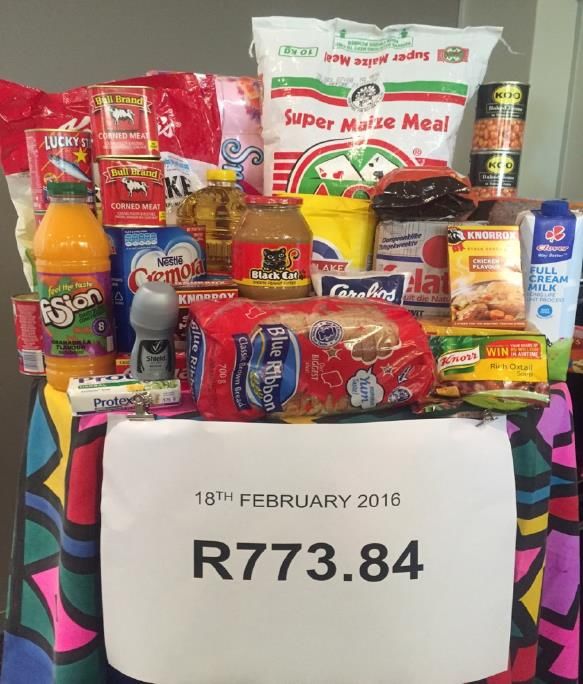
The Macro environment
The New Normal – low growth, rising inequality, with limited monetary & fiscal tools?

Global & sub-Saharan Africa (SSA) per IMF
•   Moderate global growth in 2016 (3.1%) and 2017 (3.4%)
•   SSA growth revised down to 1.6% in ‘16 (was 3.0%) and to 3.3% in ‘17 (was 4.0%).
      •   Due partly to Nigeria's economy likely to contract in ‘16 (-1.8%) and grow only by
          1.1% in ‘17
•   Commodities’ pricing to remain low and US$ relatively strong
•   Some increased appetite for EM risk
South Africa
•   Positives – potential end of drought leading to lower inflation, stronger exports, stable
    electricity supply, restrained cost-inflation, no credit contraction
•   Negatives – low consumer & business confidence, structural impediments to more
    employment (70% of respondents to recent McKinsey consumer survey concerned about imminent job loss)
•   Uncertainties – Rand direction, no more interest rate increases, policy direction?

                        Interim results Presentation August 2016
                                                                                                           3
SA Consumer & Retail environments
With higher Food inflation, consumers are limiting spending to essentials.
A difficult second half for 2016 is likely but may improve during 2017

 •    Q1 of 2016 low-point of current economic cycle?
 •    Forecast South African PCE growth: 0.8% ‘16, 1.6% ‘17 and 1.4% in ‘18 (per Econometrix)
 •    Recent inflation (CPI) increases driven by Food. National Food & NAB inflation 11.3%.
      And Core inflation edged up to 6% at July ’16
 •    Interest rates already +75 bps this year
 •    Consumers delaying purchases, trading down, buying singles, and reducing spending on
      durable goods to support spending on semi- and non-durables
 •    Daily in-store trading is generally softer except for key pay- and grant-days
 •    Customers search for value through: cherry-picking promotions, smaller pack sizes,
      multi-packs, private label
 •    Competitive promotional activity extreme, as is pricing

Note: Core inflation excludes Food, Petrol & Electricity

                                  Interim results Presentation August 2016
                                                                                                4
SA National Retail sales
Inflation accelerating from April ‘16 and recently lower real growth

                 12

                 10
                                                                                                   Nominal sales
                 8
  % Growth YoY

                 6

                                                                                                 Real sales
                 4

                 2

                 0
                      Jan 15        Mar 15          May 15             Jul 15           Sep 15     Nov 15     Jan 16   Mar 16   May 16

                      Source: StatsSA

                                             Interim results Presentation August 2016
                                                                                                                                         5
Food prices accelerate
Basic basket up 13% since February ‘16

                                           The Basket
                                           •     23 basic items
                                           •     Not a full month’s family shop
                                           •     Includes cordial, coffee creamer, pilchards, maize, salt,
                                                 toilet paper, sugar, soap, spaghetti and rice

                                           Current pricing
                                           •     Now R874.08, up almost 13%
                                           •     20 of 23 items now more expensive
                                           •     Maize, sugar & peanut butter amongst the highest
                                                 increases

                    Interim results Presentation August 2016
                                                                                                             6
Massmart response
Trust our model. Be patient and measured. Smart trading in shorter-term

•   Maintain & grow market leadership in our major categories
•   Due to two mature businesses with high market shares in South Africa, we are very
    deliberate about new space growth in Game and Masscash Wholesale:
    •   In Group for six months to June ’16: nine new stores, 2.4% new space, but closed
        seven stores, overall net space decline of -0.1%
•   Our growth into Africa being led by Game and Builders Warehouse. Since June ‘15 we
    have opened four new stores in three countries. Will open four more stores to June ‘17
•   Experiencing significant cost pressure across several areas: administered costs, new
    Labour legislation, US$ costs in Africa, and imported equipment including IT software
•   Maintain positive price-gap
•   Private label
•   Offer customers demonstrable value
•   Find new sales opportunities – product categories, routes to market, geographic areas

                      Interim results Presentation August 2016
                                                                                             7
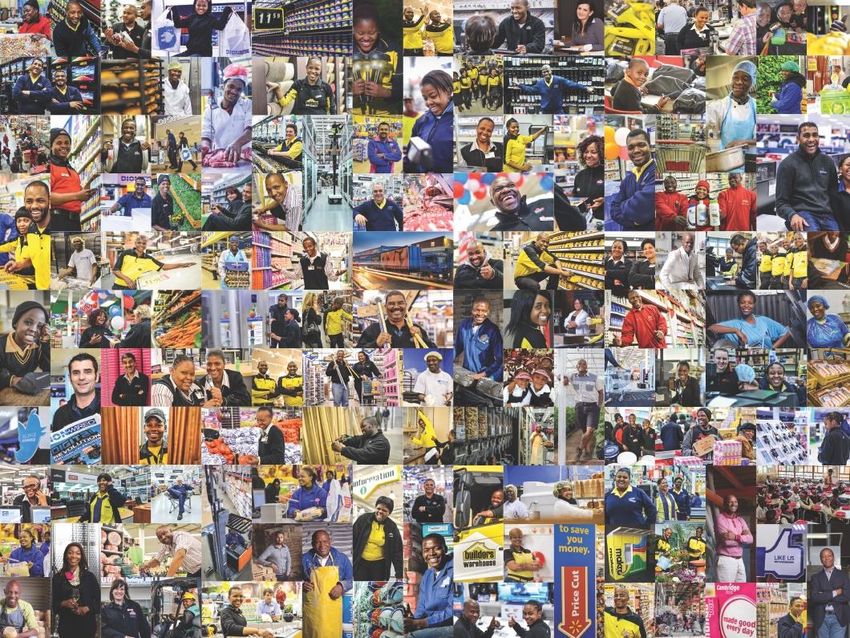
We save our customers money,
so they can live better

 Based on our promotional activity

 we saved our customers
 R783m in 26 weeks
 gaining market share across all major categories

                   Interim results Presentation August 2016
                                                              8
We save our customers money,
so they can live better
In July ‘16 Independent consumer website Retail Price Watch conducted a
price survey across SA’s seven biggest chains in four different categories.
For total basket, Cambridge was cheapest and Makro second.

  Cereals & Porridge                                                 Staples                   Beverages
(Bokomo Weetbix 900g; Jungle Oats                    (Selati White Sugar 2.5kg; Iwisa    (Nescafe Classic Jar 200g; Five
  1kg; Jungle OatsoEasy 10 units;                    Super Maize Meal 2.5kg; Lucky        Roses Tagless Black Tea 102
Kellogg's Corn Flakes Value Pack 2)                  Star Pilchards in Tomato Sauce     units; Joko Tagless Black Tea 100
                                                    400g; Spekko Parboiled Rice 2kg;      units; Cremora 1kg; Freshpak
                                                             Rama 500g Brick)                  Rooibos Tea 80 units)

      is the cheapest                                       is the cheapest                  is the cheapest

                          Interim results Presentation August 2016
                                                                                                                            9
We save our customers money,
so they can live better

          Interim results Presentation August 2016
                                                     10
Financial performance
Great sales and volume growth. Good cost control in tough environment
Estimated
Jun 2016 Jun 2015 Comparable % % sales
(Reviewed) % of sales (Reviewed) % of sales % growth sales growth inflation
Sales 42,310.9 38,917.4 8.7 6.4 5.8
Massdiscounters 9,654.1 8,973.6 7.6 2.4 4.4
Masswarehouse 11,748.3 10,759.2 9.2 7.2 5.5
Massbuild 5,962.4 5,637.1 5.8 0.8 4.0
Masscash 14,946.1 13,547.5 10.3 10.9 7.9
Trading profit before interest and tax 911.3 2.2 806.7 2.1 13.0
Massdiscounters 62.4 0.6 29.6 0.3 110.8
Masswarehouse 508.1 4.3 461.3 4.3 10.1
Massbuild 259.6 4.4 243.9 4.3 6.4
Masscash 81.2 0.5 71.9 0.5 12.9
Interim results Presentation August 2016
11Financial performance
Continued strong performance
Profit growth ahead of sales growth by 4.8%

      26 weeks to June '16

                                                                  +4.8%

                                                                                                       13,5%
                                                                    10,9%
               8,7%

            Growth in Sales                                   Growth in Gross profit   Growth in Trading profit before interest and
                                                                                                        taxation

                              Interim results Presentation August 2016
                                                                                                                                      13
Sales
Robust sales in challenging environment
Jun 2016 Jun 2015 Comparable % sales Estimated
Rm (Reviewed) (Reviewed) % growth growth % sales inflation
Total 42,310.9 38,917.4 8.7 6.4 5.8
Massdiscounters 9,654.1 8,973.6 7.6 2.4 4.4
Masswarehouse 11,748.3 10,759.2 9.2 7.2 5.5
Massbuild 5,962.4 5,637.1 5.8 0.8 4.0
Masscash 14,946.1 13,547.5 10.3 10.9 7.9
9,3%
Rest of Africa businesses’
sales growth: sales in 29,4%
ZAR grew by 23.2% /
in constant local 56,5%
90.7% currencies grew by 16.5%
14,1%
Rest of Africa sales SA sales General Merchandise Home Improvement
Food and Liquor
Interim results Presentation August 2016
14Margin
Our margin improved across divisions – nice recovery in Game
+0.4%
18,9% 19,3%
June '15 June '16
Interim results Presentation August 2016
15Trading profit before forex and interest
Expenses as a percentage of sales decreasing year-on-year
Rbn 0,6 0,8 1,0 1,2 1,4 1,6 1,8
Jun-15 • June 2015: Trading profit before forex of R795.3m
Sales-related gross margin
• Total Group sales for the period increased by 8.7%
• Gross profit for the period increased by 10.9%
Price-and-mix-related gross
margin
• Total increase of 9.4% / Comparable increase of 8.1%
Employment costs • Increase in staff (Full-Time Equivalents) of 3.2% to +/- 45,500 FTE’s
• Conversion of contractor staff into full time employees
• Total increase of 11.8% / Comparable increase of 8.7%
Occupancy costs • 2.4% increase in new trading space since June 2015 to a total of 1,548,799m²
• Electricity, rates and taxes increased by +/- 19.1% and lease renewals in period
Depreciation, Amortisation • Depreciation growth of 16.2% / Comparable increase of 9.5%
and • Increase in line with depreciable assets purchased over the period
Impairment of Assets • Change in the mix of assets acquired in the period; no new property purchases
• Total increase of 9.7% / Comparable increase of 4.8%
Other operating costs • Continued investment in IT infrastructure across the Group
• June 2016: Trading profit before forex of R902.8 million
Jun-16 • R107.5m improvement / increase of 13.5%
Interim results Presentation August 2016
16Trading profit before interest and taxation
Strong divisional performance
Jun 2016 Jun 2015
Rm (Reviewed) (Reviewed) % growth
Total 911.3 806.7 13.0
Massdiscounters 62.4 29.6 110.8
Masswarehouse 508.1 461.3 10.1
Massbuild 259.6 243.9 6.4
Masscash 81.2 71.9 12.9
• Massdiscounters continues their recovery
• Masswarehouse maintains its strong journey
• Massbuild improves margin through strong expense management
• Masscash Wholesale steady on improving sales
• Masscash Retail contributing increasingly to Masscash
Interim results Presentation August 2016
17Good operating profit growth
impacted by forex and interest
Profit for the period before forex growing by 21.6% / HEPS before forex grew by 19.3%
Jun 2016 Jun 2015
Rm (Reviewed) (Reviewed) % change
Operating profit 944.3 791.9 19.2
Net finance costs (279.2) (234.8)
Taxation (162.5) (143.8)
Profit for the period before forex 502.6 413.3 21.6
Foreign exchange loss* (125.2) (106.7)
Profit for the period 377.4 306.6 23.1
Basic EPS (cents) 164.7 129.9 26.8
Headline EPS (cents) 148.2 124.2 19.3
Headline EPS before foreign exchange (taxed) (cents) 187.7 164.0 14.5
* majority is unrealised
Interim results Presentation August 2016
18Interest
Jun 2016 Jun 2015
Rm (Reviewed) (Reviewed) % change
Finance costs (294.1) (252.5)
Finance income 14.9 17.7
Net finance costs (279.2) (234.8) (18.9)
300 Source of increase
Over the period finance costs
250
were mainly incurred from
23%
funding for:
200
• capex expansions;
150
• trading positions;
• early creditor payments; and
77%
100 • rate increases.
50
H1 2015 H1 2016 Rate increase Volumes
Interim results Presentation August 2016
19Forex
Continued focus on reducing foreign exchange volatility for the Group
• Limited growth in foreign exchange result
• Weakening of the Rand against the average basket of African currencies and the USD
during the first half of 2016 caused the majority of the Group’s foreign currency loss
• Volatility in the past period has been particularly high
• Liquidity in Mozambique driving loss in Africa for otherwise well-hedged balances
• Most losses are unrealised
Interim results Presentation August 2016
20Working capital
Net funding gap increased to 15 days (2015: 13 days)
Jun 2016 Jun 2015
(Reviewed) (Reviewed)
• Increase in inventory mainly due to
Inventories (Rm) 11,591 10,531
strategic buy-ins and net 9 new
stores over the 12 months Inventory Days 62 61
• Debtors’ days are calculated based Trade Debtors (Rm) 2,373 2,320
on total Group sales Debtors’ Days 9 10
• Special care given towards trade
Trade Creditors (Rm) 11,969 11,389
credit in a more challenging
environment for customers Creditors’ Days 56 58
• Decrease in creditors’ days mainly
due to accelerated payment of
foreign creditors
Interim results Presentation August 2016
21In summary
• Market share gains
• Strong sales in challenging H1
• Mix impacts improved gross margin
• Comp expenses as a % of sales going down
• Operating profit up 19.2% (before forex)
• HEPS up by 14.5% (before forex)
• Cash flows under control
• Investing in working capital for customers and reducing forex exposure
Interim results Presentation August 2016
22Strategic
priorities
Improve Grow Retail Food & Grow into Africa Grow Online
Profitability Builders formats in
South AfricaImprove
profitability
Fast fact
Our Opex to Sales ratio of
16.4% is the lowest and
enables us to compete
aggressively on priceImproving profitability
Maintain focus on improving sales, operating margin & expenses
• Sales growth +8.7%, comps +6.4%
• Drive existing sales through clear customer & value propositions, superb execution of
retail basics, private label, innovative promotions, positive price-gap
• Explore new opportunities – product categories, routes to market, geographic areas
• Gross profit +10.9%
• Effective margin management through focus on buying, inventory ranges & levels,
product innovation, supplier collaboration & route-to-market relevance
• Operating costs +10.4%, comps 7.5%. A sharp cost focus critical in current environment:
• Careful new store decisions, store closures too
• Leverage IT & digital to reduce / simplify in-store processes
• Cost benefits from workforce scheduling, construct-for-less and operate-for-less projects
• Investing in value-added services & capacity
Interim results Presentation August 2016
25Grow
Retail Food &
Builders
formats in
South Africa Fast fact
Our Food & Liquor sales
are growing ahead of
the SA marketGrow Retail Food
Build a Retail Food proposition on our General Merchandise and Wholesale Food platforms
• In a defensive economic environment, Food acts as buffer from
the pressure on our General Merchandise and DIY / Home
Improvement categories
• Increases customer foot-fall
• Game’s Food & Liquor sales participation already 22% despite
not in all stores
• Sales growth of 14% across Group’s Food private label portfolio
including: Aro, Econo, First Value, Great Value & Marketside
• Fruitspot opens facilities in Cape Town (Aug ‘16) and Durban
(Nov ‘16) delivering Group procurement and distribution
efficiencies to our stores
• Cambridge opened three stores in H1 of ’16, with another 15
planned to end 2017. Two closed in ‘16
Interim results Presentation August 2016
27Grow Builders’ formats
Scale & leverage this powerful brand through several formats
• We have the highest relative market share domestically, but still low – can grow & expand
• More openings of successful Builders Express format due to currently limited real estate
availability for larger Builders Warehouse
• Smaller lower-income format, Superstore, performing very well. Recently opened first
store outside Gauteng
• Sales growth > 25% and profitability improving fast
• Now nine stores. Another nine new stores planned to June ‘18
• Launching pilot of Builder’s online contractor platform in Q4
• Highest private label participation in Massmart
Interim results Presentation August 2016
28Grow into
Africa Fast fact
Builders annualised
ex-SA sales exceed
R1 billionGrow into Africa
Cautious and measured long-term approach
• Despite economic pressures, total ex-SA sales growth strong at 23.2% and 16.5%
in constant currencies
• Currently 38 stores in Africa, representing R3.9bn sales (9.3% participation), in
13 countries
• Weaker African currencies caused lower Rand profits and forex translation losses
in H1 to June ‘16
• Extreme currency movements in Mozambique (-30%) and Nigeria (-43%)
against the Rand
• Establishing legal title to land and land pricing remain challenging
• US$ as de facto currency currently causing extreme cost pressures
• Anticipate opening five new stores in next two years across Ghana, Mozambique,
Nigeria & Zambia
Interim results Presentation August 2016
30Grow online Fast fact
Makro attracted 74% more
online visitors to its site
and DionWired online
visitors grew by 54%Grow online
Build a profitable omni-channel presence
• Why?
• Customers’ convenience
• Enhance experience
• New products & markets
• Makro online:
• Is profitable and had H1 sales growth of 100%
• B2B has in excess of 10,000 registered users
• Rolled-out 20 more online pick-up lockers taking available sites to 30
• DionWired achieved 38% growth in online sales and is profitable
• In Makro & DionWired online represents about 2% of each categories’ online sales
• Builder’s online contractor platform is currently registering users, with pilot launch in Q4.
This will be first African instance of SAP Hybris
Interim results Presentation August 2016
32Investing
in Local
Supplier
Development
Fast fact
Massmart’s verified
procurement from small
business is currently
R4.2 billion per annum
Creating
opportunities
for everyone
to prosperInvesting in Local Supplier Development
Creating opportunities for everyone to prosper
• Total of R128 million has / will be disbursed by the Massmart Supplier Development
Programme (SDF) since inception
• Current portfolio comprises 32 local suppliers (average annual turnover R13.5 million)
• Six of the 32 suppliers are involved in Massmart-led import-substitution projects
• Working closely with Economic Development ministry
• Supplier development benefits to Massmart include: product differentiation; improved
price competitiveness; and improved fill rates
• Product focus includes cooler boxes, 4x4 storage boxes, toilet seats, ladders, nails,
adhesives, paint, hollow core doors, window frames, clay bricks, charcoal, office furniture
and clothing
• Forecast procurement of R300 million per annum from SDF portfolio by 2019
Interim results Presentation August 2016
34Responsible Fast fact
Retail Massmart will generate
3.5 million kWh
electricity from solar
facilities by Q1 in 2017
Making
thoughtful
choices for a
better futureResponsible retail
Making thoughtful choices for a better future
100%
of direct import suppliers that have undergone responsible sourcing audits
207,000
primary school learners receive meals prepared in Massmart mobile kitchens (annual)
800,000 kWh
is the annual output of Makro’s Carnival store solar facility. Woodmead is next …
9,500,000 kg
of paper, plastic and board already recycled across Massmart facilities in 2016
Interim results Presentation August 2016
36Prospects The Group sales update
since June ’16 and our
short-term outlook
Any reference to future financial performance included in this document has not been
reviewed or reported on by the Group’s external auditors. The auditor’s report does not
necessarily report on all of the information contained in this announcement/financial results.
Shareholders are therefore advised that in order to obtain a full understanding of the nature
of the auditor’s engagement they should obtain a copy of the auditor’s report together with
the accompanying financial information from the issuer’s registered office.Sales update & prospects
Slowing sales and a cautious outlook
• For the 34 weeks to 21 August 2016, Massmart’s total sales increased by 8.3% and
comparable sales by 5.9%. Have seen a broad-based slowdown
• Prospects:
• For the remainder of 2016, the SA economic environment will likely constrain consumer
spending across General Merchandise and Home Improvement / DIY, whilst our Food
and Liquor will likely continue to outperform
• Notwithstanding the current uncertainty, should the Rand strengthen and Food pricing
move into disinflation, possible that trading in 2017 may be relatively better
• Trading conditions in non-SA countries are unlikely to deteriorate further provided no
exogenous shocks.
Interim results Presentation August 2016
38For further details, go to www.massmart.co.za/ interimresults2016
Additional
information   • Condensed Consolidated Income
                Statement
              • Tax Rate Reconciliation
              • Cash Flow Statement
              • Capital Expansion
              • Capex Per Category
              • Store Portfolio
              • Forecast Stores: Jul 2016 – Jun 2018
              • Number of shares`
Condensed Consolidated Income Statement
for the six months ended June 2016
Jun 2016 Jun 2015
Rm (Reviewed) (Reviewed) % growth
Revenue 42,466.3 38,980.7 8.9
Sales 42,310.9 38,917.4 8.7
Cost of sales (34,138.3) (31,545.8) (8.2)
Gross Profit 8,172.6 7,371.6 10.9
Other income 63.0 63.3 (0.5)
Depreciation and amortisation (536.6) (461.7) (16.2)
Employment costs (3,541.2) (3,236.8) (9.4)
Occupancy costs (1,582.3) (1,415.7) (11.8)
Other operating costs (1,672.7) (1,525.4) (9.7)
Trading profit before foreign exchange movements and interest 902.8 795.3 13.5
Impairment of assets (50.9) (3.4)
Insurance proceeds on items in PP&E 92.4 -
Operating profit before foreign exchange movements and interest 944.3 791.9 19.2
Foreign exchange loss (125.2) (106.7) (17.3)
Operating profit before interest 819.1 685.2 19.5
Net finance costs (279.2) (234.8) (18.9)
Profit before taxation 539.9 450.4 19.9
Interim results Presentation August 2016
41Tax rate reconciliation
Jun 2016 Jun 2015
% (Reviewed) (Reviewed)
Standard tax rate 28.0 28.0
Non-taxable income and disallowable expenses (1.7) (1.0)
Assessed loss not utilised 4.7 4.8
Other - including foreign tax adjustments (0.9) 0.1
Group tax rate 30.1 31.9
Interim results Presentation August 2016
42Cash Flow Statement
Jun 2016 Jun 2015
Rm (Reviewed) (Reviewed)
Operating cash before working capital
movements 1,666.4 1,308.8
Working capital movements (4,095.2) (2,925.3)
Cash utilised in operations (2,428.8) (1,617.3)
Net interest and tax paid (461.1) (523.1)
Net investment to maintain operations (346.7) (365.5)
Free cash flow (3,236.6) (2,505.9)
Dividends paid (266.2) (622.8)
Investment to expand operations and other net
investing activities (388.9) (290.0)
Cash outflow before financing activities (3,891.7) (3,418.7)
Interim results Presentation August 2016
43Capital expansion
4,0% 1 400,0
3,5%
1 200,0
3,0% Investment to maintain
1 000,0 operations
2,5% Investment to expand
Capex as a % of sales
operations
800,0
2,0% Businesses acquired
Rm
600,0
Property acquisitions
1,5%
400,0 Total capex as a % of sales
1,0%
Total capex as a % of sales
200,0
0,5% excluding business and
property acquisitions
0,0% 0,0
June 2012 June 2013 June 2014 June 2015 June 2016
Interim results Presentation August 2016
44Capex per category
Jun 2016 Jun 2015
Rm (Reviewed) (Reviewed)
1.7%
Land and buildings/leasehold Total Capex as a % of sales
improvements 126.0 155.0
(June 2015: 1.7%)
Vehicles 3.3 6.3
Fixtures, fittings, plant and equipment 220.7 110.9
6,6%
Computer hardware 31.4 8.1 8,7% 21,9%
Computer software 19.5 8.9
Investment to expand operations 400.8 289.2 3,5%
Land and buildings/leasehold
improvements 37.8 56.6 59,3%
Vehicles 23.2 26.6
Fixtures, fittings, plant and equipment 222.3 214.3 Land & buildings/leasehold improvements
Computer hardware 33.5 47.6 Vehicles
Fixtures, fittings, plant & equipment
Computer software 29.9 20.4
Computer hardware
Investment to maintain operations 983.7 365.5 Computer software
Interim results Presentation August 2016
45Store portfolio
Total Massdiscounters Masswarehouse Massbuild Masscash
405 163 20 102 120
Up from 403 Up from 151 Up from 19 Unchanged Down from 121
in Dec 2015 in Dec 2015 in Dec 2015 in Dec 2015
+2 Game +1 Makro Builders Superstore
+9 Opened +3 +1 in South Africa
+1 +1 in South Africa
+2 +1 in South Africa
+3 Retail
+3 in South Africa
+1 in Zambia
–7 Closed Builders Express
+1 DionWired +1 in South Africa –4 –2 Wholesale
-2 in South Africa
+1 in South Africa
Builders Warehouse –2 Retail
–1 DionWired
–2 –1 in Mozambique -2 in South Africa
–1
Builders Trade Depot
–1 in South Africa
Interim results Presentation August 2016
46Forecast stores: Jul 2016 – Jun 2018
Total Massdiscounters Masswarehouse Massbuild Masscash
+40 +10 unchanged +14 +16
Up from 405 to 445 Up from 163 to 173 20 Up from 102 to 116 Up from 120 to 136
Game Builders Warehouse
+35 South Africa +7 +3 in South Africa
+2 +1 in South Africa
+15 Retail
+1 in Ghana +1 in Mozambique +15 in South Africa
+5 Africa +2 in Nigeria
Builders Express
+1 in Zambia +3 +3 in South Africa +1 Wholesale
DionWired +1 in South Africa
+3 +3 in South Africa +9 Builders Superstore
+9 in South Africa
+6.5% +6.4% unchanged +6.5% +10.9%
Up from 1,548,799m2 Up from 540,117m2 216,313m2 Up from 446,300m2 Up from 346,069m2
to 1,650,049m2 to 574,617m2 to 475,300m2 to 383,819m2
This 6.5% increase includes a 12.0% increase in our Rest of Africa trading space
Interim results Presentation August 2016
47Number of shares
‘000
At June 2015 217,136
Shares issued -
At June 2016 217,136
Weighted-average at June 2016 216,359
Diluted weighted-average at 2016 219,885
Interim results Presentation August 2016
48You can also read