1Q 2019 Earnings Conference Call - April 23, 2019 - United Technologies
←
→
Page content transcription
If your browser does not render page correctly, please read the page content below

1Q 2019 Earnings Conference Call
April 23, 2019
Note: All results and expectations in this presentation reflect continuing operations unless otherwise noted.

This communication contains statements which, to the extent they are not statements of historical or present fact, constitute “forward-looking statements” under the securities laws. From time to time, oral
or written forward-looking statements may also be included in other information released to the public. These forward-looking statements are intended to provide management’s current expectations or
plans for our future operating and financial performance, based on assumptions currently believed to be valid. These forward-looking statements are intended to provide management’s current
expectations or plans for our future operating and financial performance, based on assumptions currently believed to be valid. Forward-looking statements can be identified by the use of words such as
"believe," "expect," "expectations," "plans," "strategy," "prospects," "estimate," "project," "target," "anticipate," "will," "should," "see," "guidance," "outlook," "confident,” “on track” and other words of similar
meaning in connection with a discussion of future operating or financial performance or of the separation transactions. Forward-looking statements may include, among other things, statements relating to
future sales, earnings, cash flow, results of operations, uses of cash, share repurchases, tax rates and other measures of financial performance or potential future plans, strategies or transactions of
United Technologies or the independent companies following United Technologies’ expected separation into three independent companies, the anticipated benefits of the acquisition of Rockwell Collins or
of the separation transactions, including estimated synergies resulting from the Rockwell Collins transaction, the expected timing of completion of the separation transactions, estimated costs associated
with such transactions and other statements that are not historical facts. All forward-looking statements involve risks, uncertainties and other factors that may cause actual results to differ materially from
those expressed or implied in the forward-looking statements. For those statements, we claim the protection of the safe harbor for forward-looking statements contained in the U.S. Private Securities
Litigation Reform Act of 1995. Such risks, uncertainties and other factors include, without limitation: (1) the effect of economic conditions in the industries and markets in which we operate in the U.S. and
globally and any changes therein, including financial market conditions, fluctuations in commodity prices, interest rates and foreign currency exchange rates, levels of end market demand in construction
and in both the commercial and defense segments of the aerospace industry, levels of air travel, financial condition of commercial airlines, the impact of weather conditions and natural disasters and the
financial condition of our customers and suppliers; (2) challenges in the development, production, delivery, support, performance and realization of the anticipated benefits (including our expected returns
under customer contracts) of advanced technologies and new products and services; (3) the scope, nature, impact or timing of the expected separation transactions and other acquisition and divestiture
activity, including among other things integration of acquired businesses into United Technologies’ existing businesses and realization of synergies and opportunities for growth and innovation and
incurrence of related costs and expenses; (4) future levels of indebtedness, including indebtedness that may be incurred in connection with the expected separation transactions, and capital spending and
research and development spending; (5) future availability of credit and factors that may affect such availability, including credit market conditions and our capital structure; (6) the timing and scope of
future repurchases of our common stock, which may be suspended at any time due to various factors, including market conditions and the level of other investing activities and uses of cash; (7) delays
and disruption in delivery of materials and services from suppliers; (8) company and customer-directed cost reduction efforts and restructuring costs and savings and other consequences thereof; (9) new
business and investment opportunities; (10) our ability to realize the intended benefits of organizational changes; (11) the anticipated benefits of diversification and balance of operations across product
lines, regions and industries; (12) the outcome of legal proceedings, investigations and other contingencies; (13) pension plan assumptions and future contributions; (14) the impact of the negotiation of
collective bargaining agreements and labor disputes; (15) the effect of changes in political conditions in the U.S. and other countries in which United Technologies and its businesses operate, including the
effect of changes in U.S. trade policies or the U.K.’s pending withdrawal from the European Union, on general market conditions, global trade policies and currency exchange rates in the near term and
beyond; (16) the effect of changes in tax (including U.S. tax reform enacted on December 22, 2017, which is commonly referred to as the Tax Cuts and Jobs Act of 2017), environmental, regulatory
(including among other things import/export) and other laws and regulations in the U.S. and other countries in which United Technologies and its businesses operate; (17) negative effects of the Rockwell
Collins acquisition or of the announcement or pendency of the separation transactions on the market price of United Technologies’ common stock and/or on its financial performance; (18) risks relating to
the integration of Rockwell Collins, including the risk that the integration may be more difficult, time-consuming or costly than expected or may not result in the achievement of estimated synergies within
the contemplated time frame or at all; (20) the ability of United Technologies to retain and hire key personnel; (21) the expected benefits and timing of the separation transactions, and the risk that
conditions to the separation transactions will not be satisfied and/or that the separation transactions will not be completed within the expected time frame, on the expected terms or at all; (22) the expected
qualification of the separation transactions as tax-free transactions for U.S. federal income tax purposes; (23) the possibility that any consents or approvals required in connection with the expected
separation transactions will not be received or obtained within the expected time frame, on the expected terms or at all; (24) expected financing transactions undertaken in connection with the separation
transactions and risks associated with additional indebtedness; (25) the risk that dissynergy costs, costs of restructuring transactions and other costs incurred in connection with the separation
transactions will exceed our estimates; and (26) the impact of the expected separation transactions on our businesses and the risk that the separation transactions may be more difficult, time-consuming
or costly than expected, including the impact on our resources, systems, procedures and controls, diversion of management’s attention and the impact on relationships with customers, suppliers,
employees and other business counterparties. There can be no assurance that the separation transactions or any other transaction described above will in fact be consummated in the manner described
or at all. For additional information on identifying factors that may cause actual results to vary materially from those stated in forward-looking statements, see the reports of United Technologies and
Rockwell Collins on Forms S-4, 10-K, 10-Q and 8-K filed with or furnished to the SEC from time to time. Any forward-looking statement speaks only as of the date on which it is made, and United
Technologies assumes no obligation to update or revise such statement, whether as a result of new information, future events or otherwise, except as required by applicable law.

2019 Outlook

                                              Adjusted EPS*                                               Sales
                           $7.80 - $8.00 up from $7.70 - $8.00                                     $75.5 - $77.0B
                                                      + 5 cents
                           Increasing mid point of prior outlook

                                              Organic sales*                                Free cash flow*
                                                           3% - 5%                                    $4.5 - $5.0B
                                                                                        Includes $1.5B of one-time portfolio separation costs

*See appendix for additional information regarding these non-GAAP financial measures.                                                           1
1Q 2019
                            Sales                                                                     EPS                                     Cash Flow
                                                                                        GAAP                   Adjusted*                 (attributable to common shareowners)

                            Up 20%
                                                                                        Down 4%                   Up 8%
                                                                                                                                       $1.5B         ($0.4B)
                                        $18.4B                                                                              $1.91
                                                                                                             $1.77                                                    $1.1B
                   $15.2B
                                                                                  $1.62
                                                                                             $1.56

                  1Q 2018              1Q 2019                                  1Q 2018     1Q 2019         1Q 2018       1Q 2019       Cash          CapEx           Free
                                                                                                                                        Flow                          Cash
                                                                                                             ($0.15)        ($0.35)     From                          Flow*
                Organic*                 8 pts.                                                                  Restructuring/       Operations
                FX                      (3) pts.                                                                  Other items
                Net Acq.                15 pts.                                                                  gain/(charge)

*See appendix for additional information regarding these non-GAAP financial measures.
                                                                                                                                                                                2
Organic Sales Growth
(VPY %)
Quarterly Trend 1Q 2019
UTC = 8%
Commercial
12
11
11 Americas 9
10
9 EMEA 0
8 8
8
7
6 6 Asia 4
6
5
4
Aerospace
3
2 Commercial Aero 10
1
0 Military Aero 13
1Q18 2Q18 3Q18 4Q18 1Q19
See appendix for definition and reconciliation of organic sales. 31Q 2019 Segment Highlights
Otis ($ millions)
Reported Adjusted* YOY Var.*
Sales 3,096 3,096 2%
Operating profit 426 451 (5%)
ROS 13.8% 14.6% (1.1) pts
Organic sales up 7%*
Sales up 7%**
New equipment sales up 10%
Service up 4%
Adjusted operating profit* flat**
Higher volume contribution
Mark-to-market FX headwind (6 points) Otis Elevator (China) Co., Ltd. (Otis China) has been awarded Otis will install 27 units at 308 Exhibition Street in Melbourne,
a contract to provide more than 180 elevators and escalators Australia. The project consists of two towers. The western
for Qingdao Metro Line 8. In addition to escalators and tower will be the first Shangri-La hotel in Melbourne. The
elevators, Otis will also provide tailored maintenance service. eastern tower will be residential with 300 luxury apartments as
New equipment orders down 1% This award marks another significant expansion of Otis’
footprint in the infrastructure segment in North China.
well as retail and hospitality space. This is also the second
project in Melbourne to use the Otis Skybuild™ self-climbing
North America down 16% elevator during construction with one in use in each tower.
China up 8%
*See appendix for additional information regarding these non-GAAP financial measures. 4
**At constant currency.1Q 2019 Segment Highlights
Carrier ($ millions)
Reported Adjusted* YOY Var.*
Sales 4,323 4,323 (1%)
Operating profit 529 562 (7%)
ROS 12.2% 13.0% (0.8) pts
Organic sales up 3%*
Refrigeration up 9%
HVAC up 3%
Fire & Security flat
Adjusted operating profit* down 5%**
Input cost headwinds
Absence of Taylor
Higher volume and pricing contribution
Organic equipment orders down 2%
Refrigeration down 18% (prior year up 20%) Customers in France can now experience the performance, efficiency and
environmental benefits of a completely compressed natural gas (CNG)-powered
HVAC up 3% solution for refrigerated trucks during field tests of IVECO's first Stralis NP
Fire & Security up 5% refrigerated truck equipped with Carrier Transicold’s Supra® CNG refrigeration unit.
*See appendix for additional information regarding these non-GAAP financial measures. 5
**At constant currency.1Q 2019 Segment Highlights
Pratt & Whitney ($ millions)
Reported Adjusted* YOY Var.*
Sales 4,817 4,817 11%
Operating profit 433 447 8%
ROS 9.0% 9.3% (0.2) pts
Organic sales up 12%*
Sales up 11%
Commercial OEM up 35%
Military up 16%
Commercial aftermarket up 1%
Adjusted operating profit* up 8%
Higher military volume
Favorable commercial aftermarket content/mix
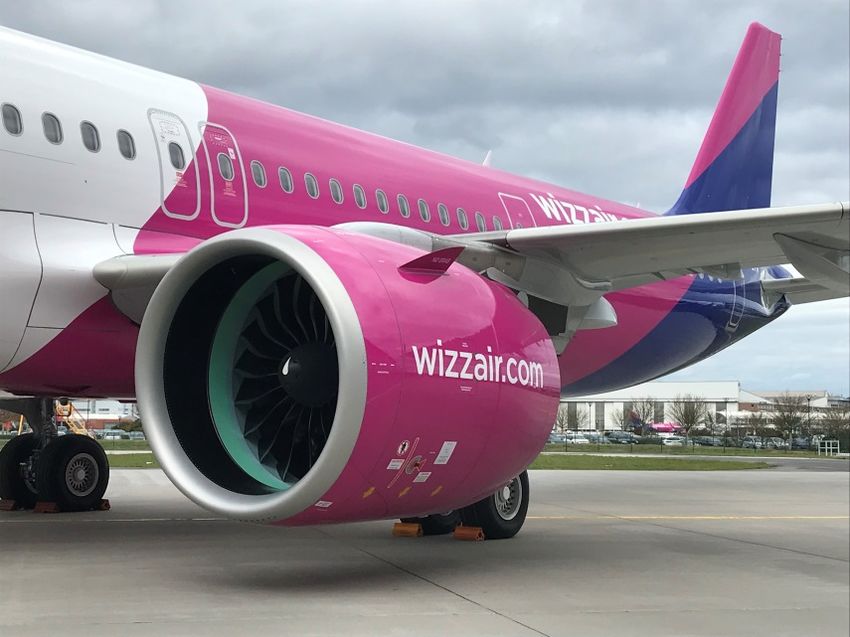
Commercial OE flat on higher volume Wizz Air accepts the first of 110+ Airbus A321neo Aircraft,
Higher E&D investment powered by Pratt & Whitney.
6
*See appendix for additional information regarding these non-GAAP financial measures.1Q 2019 Segment Highlights
Collins Aerospace ($ millions)
Reported Adjusted* YOY Var.*
Sales 6,513 6,513 71%
Operating profit 856 1,101 79%
ROS 13.1% 16.9% 0.8 pts
Organic sales up 10%*
Pro-forma sales up 10%*
Commercial OEM up low double digits
Commercial aftermarket up low double digits
Military up high single digit
Adjusted operating profit* up 79%
Contribution from Rockwell Collins
Drop through on organic volume
When the U.S. Air Force flies its new advanced pilot trainer from Boeing and Saab, it will be
equipped with an ACES 5® ejection seat from Collins Aerospace. ACES 5 offers passive head
and neck protection, arm and leg flail prevention, and a load-compensating catapult rocket that
varies its thrust based on the occupant’s weight. In addition to ACES 5, Collins Aerospace will
supply the aircraft’s fully integrated landing gear system, including structure, actuation, dressings,
hydraulics, and wheels and brakes. 7
*See appendix for additional information regarding these non-GAAP financial measures and pro-forma financial information.Appendix
Use and Definitions of Non-GAAP Financial Measures
United Technologies Corporation reports its financial results in accordance with accounting principles generally accepted in the United States ("GAAP").

We supplement the reporting of our financial information determined under GAAP with certain non-GAAP financial information. The non-GAAP information presented provides investors with additional useful information,
but should not be considered in isolation or as substitutes for the related GAAP measures. Moreover, other companies may define non-GAAP measures differently, which limits the usefulness of these measures for
comparisons with such other companies. We encourage investors to review our financial statements and publicly-filed reports in their entirety and not to rely on any single financial measure.

Adjusted net sales, organic sales, adjusted operating profit, adjusted net income, adjusted earnings per share (“EPS”), and the adjusted effective tax rate are non-GAAP financial measures. Adjusted net sales
represents consolidated net sales from continuing operations (a GAAP measure), excluding significant items of a non-recurring and/or nonoperational nature (hereinafter referred to as “other significant items”). Organic
sales represents consolidated net sales (a GAAP measure), excluding the impact of foreign currency translation, acquisitions and divestitures completed in the preceding twelve months and other significant items.
Adjusted operating profit represents income from continuing operations (a GAAP measure), excluding restructuring costs and other significant items. Adjusted net income represents net income from continuing
operations (a GAAP measure), excluding restructuring costs and other significant items. Adjusted EPS represents diluted earnings per share from continuing operations (a GAAP measure), excluding restructuring costs
and other significant items. The adjusted effective tax rate represents the effective tax rate (a GAAP measure), excluding restructuring costs and other significant items. For the business segments, when applicable,
adjustments of net sales, operating profit and margins similarly reflect continuing operations, excluding restructuring and other significant items. Management believes that the non-GAAP measures just mentioned are
useful in providing period-to-period comparisons of the results of the Company’s ongoing operational performance.

Free cash flow is a non-GAAP financial measure that represents cash flow from operations (a GAAP measure) less capital expenditures. Management believes free cash flow is a useful measure of liquidity and an
additional basis for assessing UTC's ability to fund its activities, including the financing of acquisitions, debt service, repurchases of UTC's common stock and distribution of earnings to shareholders.

A reconciliation of the non-GAAP measures to the corresponding amounts prepared in accordance with GAAP appears in the tables in this Appendix. The tables provide additional information as to the items and
amounts that have been excluded from the adjusted measures.

When we provide our expectation for adjusted EPS, adjusted operating profit, adjusted effective tax rate, organic sales and free cash flow on a forward-looking basis, a reconciliation of the differences between the non-
GAAP expectations and the corresponding GAAP measures (expected diluted EPS from continuing operations, operating profit, the effective tax rate, sales and expected cash flow from operations) generally is not
available without unreasonable effort due to potentially high variability, complexity and low visibility as to the items that would be excluded from the GAAP measure in the relevant future period, such as unusual gains
and losses, the ultimate outcome of pending litigation, fluctuations in foreign currency exchange rates, the impact and timing of potential acquisitions and divestitures, and other structural changes or their probable
significance. The variability of the excluded items may have a significant, and potentially unpredictable, impact on our future GAAP results.
Key Market Trends
(VPY %*)
30
20
10
Flat
0
(10)
Otis Carrier Pratt & Whitney Legacy UTC Aerospace Systems
New Equipment Orders Global Equipment Orders Commercial Aftermarket Sales Commercial Aftermarket Sales
1Q18 2Q18 3Q18 4Q18 1Q19
10
*% VPY for Otis at constant currency and excludes the New Revenue Standard adoption impact in 2018. % VPY for Carrier and Legacy UTC Aerospace Systems are on an organic basis. % VPY for Pratt is on a reported basis.Otis 12 Month Rolling New Equipment Orders
(VPY %*)
Trailing 12 months as of 1Q 19
Americas 8%
EMEA (2%)
Asia 4%
Total Otis 3%
11
*% VPY for Otis at constant currency and on a reported basis.1Q 2019 Financial Data
(% VPY*)
Commercial Sales
Otis Americas EMEA Asia Total
New equipment up low double digit up mid single digit up mid teens up low double digit
Service up mid single digit up low single digit up high single digit up mid single digit
Carrier Americas EMEA Asia Total
Residential HVAC up mid single digit up mid single digit
Commercial HVAC up high single digit down mid single digit up low single digit up low single digit
Fire & security product down mid single digit up low single digit up high single digit down slightly
Fire & security field down mid single digit down slightly up low double digit up low single digit
Transport refrigeration up low double digit
Commercial refrigeration up mid single digit
Aerospace Sales
Pratt & Whitney Legacy UTC Aerospace Systems
Commercial aero OEM up ~35% Commercial aero OEM up low teens
Commercial aero aftermarket up slightly Commercial aero aftermarket up high single digit
Military up mid teens Military up high single digit
*% VPY for Otis at constant currency. % VPY for Carrier and Legacy UTC Aerospace Systems sales are on an organic basis. % VPY for Pratt adjusted to exclude other significant items.
121Q 2019 Sales Reconciliation
Total Growth Organic FX Net Acquisitions Other
Otis 2% 7% (5%) 0% 0%
Carrier (1%) 3% (3%) (1%) 0%
Pratt & Whitney 11% 12% (1%) 0% 0%
Collins Aerospace 71% 10% 0% 61% 0%
Total UTC* 20% 8% (3%) 15% 0%
*Reflects consolidated net sales.
13Selected Metrics
Pratt & Whitney engine shipments to customers
2018 2019
Q1 Q2 Q3 Q4 FY Q1
Military 25 43 36 47 151 39
Large commercial* 124 210 198 247 779 189
Pratt & Whitney Canada** 503 492 546 641 2,182 524
*Large commercial excludes industrial engine shipments.
**Excludes APUs. 14Segment Data – GAAP
UNITED TECHNOLOGIES CORPORATION
SEGMENT DATA - Reported 2019 2018
($ Millions except per share amounts) 1st 1st 2nd 3rd 4th 2018
Qtr. Qtr. Qtr. Qtr. Qtr. Total
Otis
Net Sales 3,096 3,037 3,344 3,223 3,300 12,904
Operating Profit (a) 426 450 488 486 491 1,915
Operating Profit % 13.8% 14.8% 14.6% 15.1% 14.9% 14.8%
Carrier
Net Sales 4,323 4,376 5,035 4,880 4,631 18,922
Operating Profit (a),(e),(u) 529 592 1,645 844 696 3,777
Operating Profit % 12.2% 13.5% 32.7% 17.3% 15.0% 20.0%
Pratt & Whitney
Net Sales (o) 4,817 4,329 4,736 4,789 5,543 19,397
Operating Profit (a),(l) 433 413 397 109 350 1,269
Operating Profit % 9.0% 9.5% 8.4% 2.3% 6.3% 6.5%
Collins Aerospace Systems
Net Sales 6,513 3,817 3,962 3,955 4,900 16,634
Operating Profit (a),(f),(o),(y),(z) 856 588 569 610 536 2,303
Operating Profit % 13.1% 15.4% 14.4% 15.4% 10.9% 13.8%
Total Segments
Net Sales 18,749 15,559 17,077 16,847 18,374 67,857
Operating Profit 2,244 2,043 3,099 2,049 2,073 9,264
Operating Profit % 12.0% 13.1% 18.1% 12.2% 11.3% 13.7%
Corporate, Eliminations, and Other
Net Sales:
Other (384) (317) (372) (337) (330) (1,356)
Operating Profit:
General corporate expenses (a) (98) (104) (126) (109) (136) (475)
Eliminations and other (a),(b),(d),(h),(i),(k),(n),(p),(q),(r),(x),(aa) (101) (11) (97) (102) (26) (236)
Consolidated
Net Sales 18,365 15,242 16,705 16,510 18,044 66,501
Operating Profit 2,045 1,928 2,876 1,838 1,911 8,553
Operating Profit % 11.1% 12.6% 17.2% 11.1% 10.6% 12.9%
Non-service pension (benefit) cost (208) (191) (192) (188) (194) (765)
Interest expense, net (j),(s),(t) 431 229 234 258 317 1,038
Income from operations before income taxes 1,822 1,890 2,834 1,768 1,788 8,280
Income tax expense (c),(g),(m),(u),(v) (397) (522) (695) (419) (990) (2,626)
Effective Tax Rate 21.8% 27.6% 24.5% 23.7% 55.3% 31.7%
Income from operations 1,425 1,368 2,139 1,349 798 5,654
Net income 1,425 1,368 2,139 1,349 798 5,654
Less: Noncontrolling interest in subsidiaries' earnings (w) (79) (71) (91) (111) (112) (385)
Net income attributable to common shareowners 1,346 1,297 2,048 1,238 686 5,269
Net income attributable to common shareowners:
Income from operations 1,346 1,297 2,048 1,238 686 5,269
1st 1st 2nd 3rd 4th 2018
Qtr. Qtr. Qtr. Qtr. Qtr. Total YTD
Operations
Earnings per share - basic 1.58 1.64 2.59 1.56 0.83 6.58
Earnings per share - diluted 1.56 1.62 2.56 1.54 0.83 6.50
Total EPS attributable to common shareowners
Total basic earnings per share 1.58 1.64 2.59 1.56 0.83 6.58
Total diluted earnings per share 1.56 1.62 2.56 1.54 0.83 6.50
Weighted average number of shares outstanding (m illions)
Basic shares 853.2 789.9 790.5 791.3 822.7 800.4
Diluted shares 860.7 800.4 799.6 801.8 831.4 810.1
Q1 Q1 Q2 Q3 Q4 Total YTD
15
Effective Tax Rate - ops 21.8% 27.6% 24.5% 23.7% 55.3% 31.7%Segment Data – Notes
The earnings release and conference-call discussion adjust 2019 and 2018 segment results for restructuring costs as well as certain significant non-recurring and/or non-operational items
The following restructuring costs and significant non-recurring and/or non-operational items are included in current and prior year GAAP results and have been
excluded from the adjusted results (non-GAAP measures) presented in the earnings release and conference-call discussion.
(a) Restructuring costs as included in 2019 and 2018 results:
2019 2018
Restructuring Costs Restructuring Costs
Q1 Q1 Q2 Q3 Q4 Total
Operating Profit:
Otis (25) (26) (23) (3) (19) (71)
Carrier (33) (14) (21) (17) (28) (80)
Pratt & Whitney (14) - (3) - 10 7
Collins Aerospace Systems (39) (27) (33) (17) (83) (160)
Total Segments operating profit (111) (67) (80) (37) (120) (304)
General corporate expenses (1) (2) (2) - (1) (5)
Eliminations and other - - - - - -
Total consolidated operating profit (112) (69) (82) (37) (121) (309)
Non-service pension costs 2 2
Total UTC Net Income (112) (69) (80) (37) (121) (307)
(b) Q1 2018: Approximately $30 million of transaction and integration costs related to merger agreement with Rockwell Collins.
(c) Q1 2018: Approximately $44 million of unfavorable income tax adjustments related to the estimated impact of the U.S tax reform legislation, including the effects
related to repatriation of undistributed foreign earnings provision and other revaluations of U.S deferred taxes.
(d) Q2 2018: Approximately $20 million of transaction and integration costs related to merger agreement with Rockwell Collins.
(e) Q2 2018 Approximately $795 million of pre-tax gains related to the divestiture of Taylor Co from UTC Climate, Controls & Security.
(f) Q2 2018 Approximately $48 million of unfavorable charges associated with asset impairment at UTC Aerospace Systems.
(g) Q2 2018: Approximately $2 million of unfavorable income tax adjustments related to the estimated impact of the U.S tax reform legislation, including the effects
related to repatriation of undistributed foreign earnings provision and other revaluations of U.S deferred taxes.
(h) Q3 2018 Approximately $21 million of transaction and integration costs related to merger agreement with Rockwell Collins.
(i) Q3 2018 Approximately $4 million of pre-tax gains related to the divestiture of Taylor Co from UTC Climate, Controls & Security.
(j) Q3 2018 Approximately $22 million of pre-tax interest charges related to the Rockwell Collins acquisition.
(k) Q3 2018 Approximately $23 million of pre-tax charges associated with the Company's intention to separate its commercial businesses.
(l) Q3 2018 Approximately $300 million of pre-tax charges resulting from customer contract matters.
(m) Q3 2018 Approximately $6 million of unfavorable income tax adjustments related to the estimated impact of the U.S tax reform legislation, including the effects related
to repatriation of undistributed foreign earnings provision and other revaluations of U.S deferred taxes.
(n) Q4 2018 Approximately $47 million of transaction and integration costs related to merger agreement with Rockwell Collins.
(o) Q4 2018 Approximately $102 of costs related to amortization of Rockwell Collins inventory fair value adjustment.
(p) Q4 2018 Approximately $4 million of pre-tax charges associated with the Company's intention to separate its commercial businesses.
(q) Q4 2018 Approximately $11 million of pre-tax charges related to transaction expenses associated with a potential disposition.
(r) Q4 2018 Approximately $21 million of pre-tax gains related to agreement with a state taxing authority for monetization of tax credits.
(s) Q4 2018 Approximately $24 million of pre-tax interest adjustment related to the Rockwell Collins acquisition.
(t) Q4 2018 Approximately $4 million of favorable pre-tax interest adjustment related to agreement with a state taxing authority for monetization of tax credits.
(u) Q4 2018 Approximately $692 million of unfavorable income tax adjustments related to repatriation of undistributed foreign earnings which is now accessible as a result of tax reform.
(v) Q4 2018 Approximately $29 million of unfavorable income tax adjustments resulting from the Company's announcement of its intention to separate its commercial businesses.
(w) Q4 2018 Approximately $7 million of favorable Noncontrolling interest resulting from the Company's announcement of its intention to separate its commercial businesses.
(x) Q1 2019 Approximately $9 million of transaction and integration costs related to merger agreement with Rockwell Collins.
(y) Q1 2019 Approximately $181 of costs related to amortization of Rockwell Collins inventory fair value adjustment.
(z) Q1 2019 Approximately $25 million of unfavorable charges associated with the loss on the sale of a business at Collins Aerospace Systems. 16
(aa) Q1 2019 Approximately $55 million of pre-tax charges associated with the Company's intention to separate its commercial businesses.Segment Data – Adjusted
UNITED TECHNOLOGIES CORPORATION
SEGMENT DATA - Adjusted (Unaudited) 2019 2018
($ Millions except per share amounts) Ex Rest &
Significant non-
Ex Rest & Significant non-recurring and non-operational
recurring and non-
items
operational item s
1st 1st 2nd 3rd 4th 2018
Qtr. Qtr. Qtr. Qtr. Qtr. Total
Otis
Net Sales 3,096 3,037 3,344 3,223 3,300 12,904
Operating Profit (a) 451 476 511 489 510 1,986
Operating Profit % 14.6% 15.7% 15.3% 15.2% 15.5% 15.4%
Carrier
Net Sales 4,323 4,376 5,035 4,880 4,631 18,922
Operating Profit (a),(e),(u) 562 606 871 857 724 3,058
Operating Profit % 13.0% 13.8% 17.3% 17.6% 15.6% 16.2%
Pratt & Whitney
Net Sales (o) 4,817 4,329 4,736 4,789 5,543 19,397
Operating Profit (a),(l) 447 413 400 409 340 1,562
Operating Profit % 9.3% 9.5% 8.4% 8.5% 6.1% 8.1%
Collins Aerospace Systems
Net Sales 6,513 3,817 3,962 3,955 4,900 16,634
Operating Profit (a),(f),(o),(y),(z) 1,101 615 650 627 721 2,613
Operating Profit % 16.9% 16.1% 16.4% 15.9% 14.7% 15.7%
Total Segments
Net Sales 18,749 15,559 17,077 16,847 18,374 67,857
Operating Profit 2,561 2,110 2,432 2,382 2,295 9,219
Operating Profit % 13.7% 13.6% 14.2% 14.1% 12.5% 13.6%
Corporate, Eliminations, and Other
Net Sales:
Other (384) (317) (372) (337) (330) (1,356)
Operating Profit:
General corporate expenses (a) (97) (102) (124) (109) (135) (470)
Eliminations and other (a),(b),(d),(h),(i),(k),(n),(p),(q),(r),(x),(aa) (37) 19 (77) (58) 15 (101)
Consolidated
Net Sales 18,365 15,242 16,705 16,510 18,044 66,501
Operating Profit 2,427 2,027 2,231 2,215 2,175 8,648
Operating Profit % 13.2% 13.3% 13.4% 13.4% 12.1% 13.0%
Non-service pension (benefit) cost (208) (191) (190) (188) (194) (763)
Interest expense, net (j),(s),(t) 431 229 234 236 297 (362)
Income from operations before income taxes 2,204 1,989 2,187 2,167 2,072 9,774
Income tax expense (c),(g),(m),(u),(v) (478) (497) (520) (509) (332) (1,858)
Effective Tax Rate 21.7% 25.0% 23.8% 23.5% 15.9% 19.0%
Income from operations 1,726 1,492 1,667 1,658 1,740 6,557
Income (loss) from discontinued operations - - - - - -
Net income 1,726 1,492 1,667 1,658 1,740 6,557
Less: Noncontrolling interest in subsidiaries' earnings (hh) (79) (71) (91) (111) (119) (392)
Net income attributable to common shareowners 1,647 1,421 1,576 1,547 1,621 6,165
Net income attributable to common shareowners:
From operations
From discontinued operations
1,647
-
1,421
-
1,576
-
1,547
-
1,621
-
6,165
-
17EPS Reconciliation
Reconciliation of Diluted Earnings per Share to Adjusted Diluted Earnings per Share
(dollars in millions except per share amounts) 2019 2018
Q1 Q1 Q2 Q3 Q4 Total
Diluted earnings per share - Net income from reported operations attributable to common shareowners (GAAP) $ 1.56 $ 1.62 $ 2.56 $ 1.54 $ 0.83 $ 6.50
Net income attributable to common shareowners $ 1,346 $ 1,297 $ 2,048 $ 1,238 $ 686 $ 5,269
Adjustments to net income from operations attributable to common shareowners:
Restructuring costs (112) (69) (80) (37) (121) (307)
Collins Transaction & Integration costs (9) (30) (20) (21) (47) (118)
Carrier - Taylor Divestiture - - 795 4 - 799
Asset Impairment/Subsequent loss on sale (25) - (48) - - (48)
Costs associated with the Company's intention to separate its commercial businesses (55) - - (23) (4) (27)
Transaction expenses associated with a potential disposition - - - - (11) (11)
Charge resulting from customer contract matters - - - (300) - (300)
Amortization of Rockwell Collins inventory fair value adjustment (181) - - - (102) (102)
Adjustment related to agreement with a state taxing authority for monetization of tax credits - - - - 21 21
Other significant non-recurring and non-operational items included in interest expense, net - - - (22) (20) (42)
Income tax benefit on restructuring costs and significant non-recurring and non-
81 19 (173) 96 63 5
operational items
U.S Tax Reform Legislation - (44) (2) (6) (692) (744)
Unfavorable tax adjustment resulting from the Company’s announcement of its intention to separate
- - - - (29) (29)
its commercial businesses
Other significant non-recurring and non-operational gains (charges) recorded within Noncontrolling
- - - - 7 7
interest
Total adjustments to net income from operations attributable to common shareowners (301) (124) 472 (309) (935) (896)
Adjusted net income from operations attributable to common shareowners $ 1,647 $ 1,421 $ 1,576 $ 1,547 $ 1,621 $ 6,165
Less: Impact of total adjustments on diluted earnings per share $ (0.35) $ (0.15) $ 0.59 $ (0.39) $ (1.12) $ (1.11)
Adjusted diluted earnings per share - Net income from operations attributable to common shareowners (Non-
$ 1.91 $ 1.77 $ 1.97 $ 1.93 $ 1.95 $ 7.61
GAAP)
Effective Tax Rate 21.8% 27.6% 24.5% 23.7% 55.3% 31.7%
Less: Impact on effective tax rate -0.1% -2.6% -0.7% -0.2% -39.4% -9.6%
Adjusted effective tax rate 21.7% 25.0% 23.8% 23.5% 15.9% 22.1%
18Collins Aerospace Pro Forma Reconciliation
($ millions)
1Q 18 1Q 19 VPY%
Segment sales – as reported 3,817
Net acquisitions – pro forma* 2,078
Segment sales – pro forma* 5,895 6,513 10%
*Includes Rockwell Collins – assumes the transaction had been completed on January 1, 2017.
19Key Data
($ millions)
1Q 19 1Q 18
Free cash flow 1,137 116
Debt/capital* 52% 46%
Net debt/capital* 48% 38%
Capital expenditures 363 337
Share repurchase 29 25
Acquisitions** 19 125
*Adjusted to reflect the accounting for noncontrolling interests.
**Includes debt assumed.
201Q 2019 Free Cash Flow Reconciliation
($ millions)
1Q
2019 2018
Net income attributable to common shareowners 1,346 1,297
from continuing operations
Depreciation & amortization 942 581
Change in working capital (445) (972)
Other (343) (453)
Cash flow from operations 1,500 453
Capital expenditures (363) (337)
Free cash flow 1,137 116
Free cash flow as a % of net income
attributable to common shareowners from continuing operations 84% 9%
21You can also read