PRESENTATION 15 NOVEMBER 2018 - NINE-MONTH 2018 RESULTS - Bouygues
←
→
Page content transcription
If your browser does not render page correctly, please read the page content below

NINE-MONTH
2018 RESULTS
15 NOVEMBER 2018
PRESENTATION
This presentation contains forward-looking information and statements about the Bouygues group and its businesses. Forward-looking statements may be identified by the use of
words such as “will”, “expects”, “anticipates”, “future”, “intends”, “plans”, “believes”, “estimates” and similar statements.
Forward-looking statements are statements that are not historical facts, and include, without limitation: financial projections, forecasts and estimates and their underlying
assumptions; statements regarding plans, objectives and expectations with respect to future operations, products and services; and statements regarding future performance of the
Group. Although the Group’s senior management believes that the expectations reflected in such forward-looking statements are reasonable, investors are cautioned that forward-
looking information and statements are subject to various risks and uncertainties, many of which are difficult to predict and generally beyond the control of the Group, that could
cause actual results and developments to differ materially from those expressed in, or implied or projected by, the forward-looking information and statements. Investors are
cautioned that forward-looking statements are not guarantees of future performance and undue reliance should not be placed on such statements. The following factors, among
others set out in the Group’s Registration Document (Document de Référence) in the chapter headed Risk factors (Facteurs de risques), could cause actual results to differ materially
from projections: unfavorable developments affecting the French and international telecommunications, audiovisual, construction and property markets; the costs of complying with
environmental, health and safety regulations and all other regulations with which Group companies are required to comply; the competitive situation on each of our markets; the
impact of tax regulations and other current or future public regulations; exchange rate risks and other risks related to international activities; industrial and environmental risks;
aggravated recession risks; compliance failure risks; brand or reputation risks; information systems risks; risks arising from current or future litigation. Except to the extent required by
applicable law, the Bouygues group makes no undertaking to update or revise the projections, forecasts and other forward-looking statements contained in this presentation.

                                                                                                                                                                        2
CONTENTS
HIGHLIGHTS AND KEY FIGURES
REVIEW OF OPERATIONS
FINANCIAL STATEMENTS
OUTLOOK
ANNEX
3
9M 2018 HIGHLIGHTS
VERY GOOD COMMERCIAL PERFORMANCE IN ALL BUSINESSES
Net-adds acceleration in both Mobile and FTTH at Bouygues Telecom in Q3
Construction businesses’ backlog at a record level at end-September
Increase in advertising revenue year-on-year at TF1
STRONG RESULTS AT BOUYGUES TELECOM
CONSTRUCTION BUSINESSES PROFITABILITY PENALIZED BY DIFFICULTIES IN
The completion of three energy and services projects
Specialized activities in France (strikes at SNCF in rail business and overruns on a pipeline project)
INCREASE IN NET PROFIT ATTRIBUTABLE TO THE GROUP
2018 GROUP CURRENT OPERATING PROFIT EXPECTED STABLE OR SLIGHTLY LOWER THAN 2017
4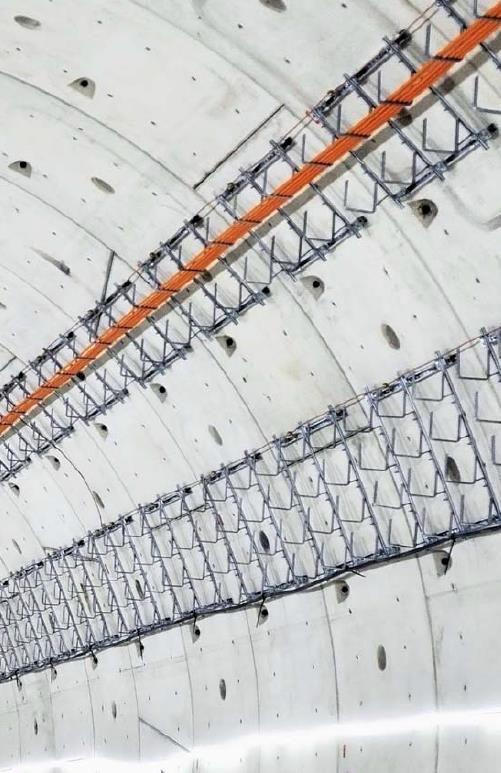
GROUP KEY FIGURES
Sales up 6% year-on-year driven by all businesses 9M 2017
€m 9M 2018 Change
restated
9-month current operating profit of €820m reflects
Sales 23,752 25,219 +6%a
> Significant improvement at Bouygues Telecom and TF1 o/w France 14,911 15,646 +5%
o/w international 8,841 9,573 +8%
> Increase of €17m at Bouygues Immobilier (excluding
Nextdoor one-off impact in Q3 2017) Current operating profit 933 820 -€113m
> Decline at Bouygues Construction (-€138m YoY) o/w Bouygues Telecom 263 314 +€51m
and Colas (-€24m YoY) o/w TF1 116 124 +€8m
Stable operating profit year-on-year o/w construction businesses 579b 406 -€173m
Operating profit 1,015c 1,018d +€3m
> Including €110m of non current income related to 1800 MHz
frequency charges accounted for prior to 2018 at Bouygues Net profit attributable to the
689 772 +€83m
Group
Telecom
(a) Up 4% like-for-like and at constant exchange rates
(b) Including the capital gain of €28m on Nextdoor
Increase in net profit attributable to the Group (c) Including non-current charges of €17m at TF1 and €5m at Colas and non-current income of
€105m at Bouygues Telecom
(d) Including non-current charges of €16m at TF1 and non-current income of €214m at
> Higher net contribution from Alstom (+€125m YoY) Bouygues Telecom
5
CHANGE IN NET DEBT POSITION IN 9M 2018 (1/2)
  €m
                            Net debt at 31/12/2017                                                                                                                  Net debt at 30/09/2018

                                      (1,917)

                                                                                                                                                                                (5,498)
                                                                 -1,557
                                                                                                  +9
                                                               Acquisitions/                  Otherb                      -680
                                                                disposalsa                                                                         -1,353
                                                                                                                        Dividends
                                                                                                                                                  Operations

            2017
                                     (1,866)c                      +24d                      +147e                        -606                      -1,406                      (3,707)
          Restated

(a) Including the acquisition of Alpiq Engineering Services by Bouygues Construction and Colas Rail, of the Miller McAsphalt group by Colas and of the aufeminin group by TF1
(b) Including share buybacks, exercise of stock options and the remainder of the Bouygues Confiance n°9 capital increase reserved for employees
(c) At 31/12/2016
(d) Including divestment of Groupe AB and Teads, acquisitions of Tuvalu Media, Minute Buzz and Studio 71 by TF1 and of activities in North America by Colas and scope effects             6
(e) Including exercise of stock options and the remainder of the Bouygues Confiance n°8 capital increase reserved for employees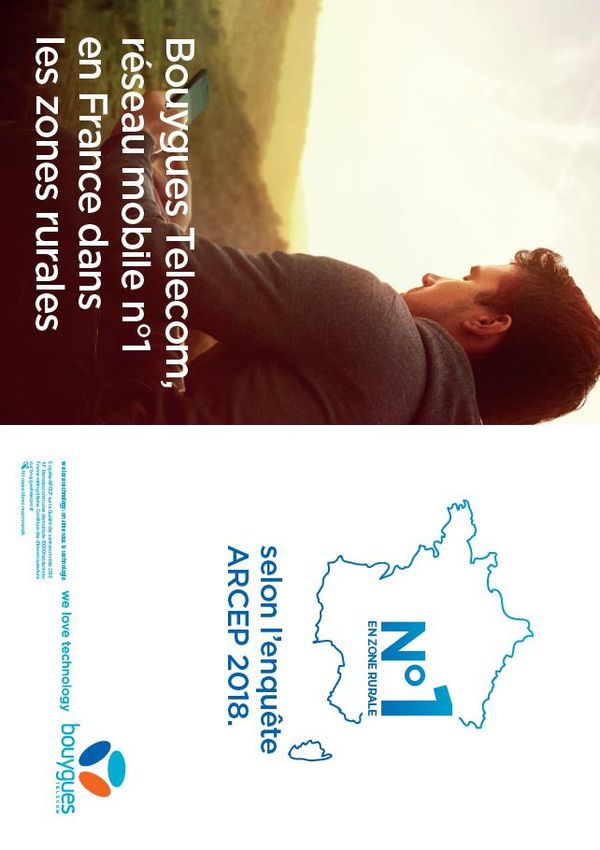
CHANGE IN NET DEBT POSITION IN 9M 2018 (2/2)
  €m
                                                                            Breakdown of operations

                                                  Net cash flowa                                Net capex                          Change in operating
                                                                                                                                     WCR and otherb

                                                                                                  -1,179
                                                       +1,648

                                                                                                                                                                              -1,353
                                                                                                                                             -1,822

        9M 2017 Restated                                 +1,525                                      -963                                     -1,968                          -1,406

(a) Net cash flow = cash flow - cost of net debt - income tax expense
(b) Operating WCR: WCR relating to operating activities + WCR relating to net liabilities related to property, plant & equipment and intangible assets + WCR related to tax

                                                                                                                                                                                 7
CONTENTS
HIGHLIGHTS AND KEY FIGURES
REVIEW OF OPERATIONS
FINANCIAL STATEMENTS
OUTLOOK
ANNEX
8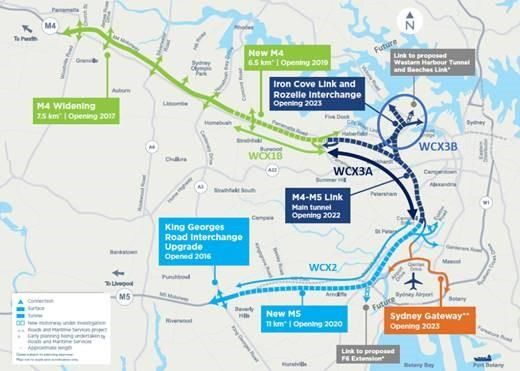
CONSTRUCTION
BUSINESSES
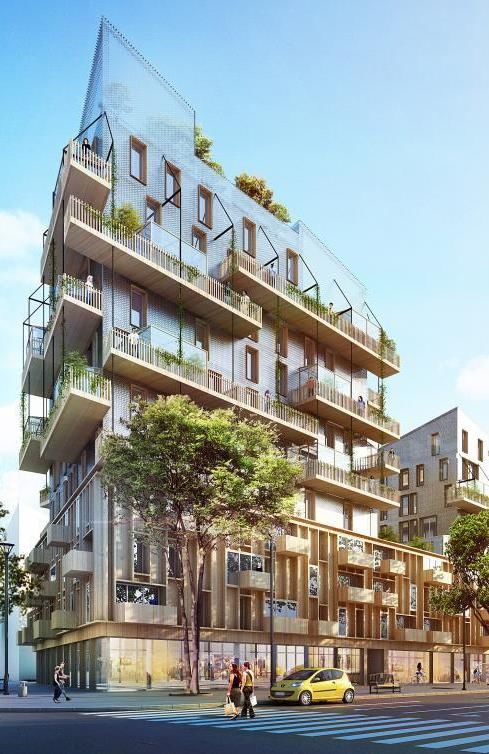
Rehabilitation of old Bern post office – Switzerland Sensations – Strasbourg - France Courtyard of Saint Aubin’s castle - France
9
Backloga (€b)
BACKLOG AT A RECORD LEVEL +13%b
33.8
BACKLOG AT END-SEPTEMBER 2018: €33.8B
2.6
29.9 -1%
Up 13% year-on-year and up 15% at constant exchange rates 2.6
8.7
+13%
59% of the backlog at Bouygues Construction and Colas
7.7
in international markets (vs 56% at end-September 2017)
Increased visibility
> Half of Bouygues Construction backlog with execution dates > N+2
+14%
22.5c
19.7
Bouygues Construction’s backlog
with execution dates > N+2
60% Allongement durée carnet
40%
End-Sept 2017 End-Sept 2018
41% 49%
20% 35%
Bouygues Construction Colas Bouygues Immobilier
0% (a) Restated for IFRS 15
(b) Up 15% at constant exchange rates (up 13% at constant exchange rates
End-Sept 2008 End-Sept 2013 End-Sept 2018 and excluding Miller McAsphalt)
(c) Including the AW Edwards backlog for €0.2b
10GOOD COMMERCIAL MOMENTUM IN FRANCE
EXAMPLE OF CONTRACTS WON IN Q3 2018
Backloga in France (€b)
+5%
15.2
14.4
+1% 2.4
2.4
+3% 3.4
3.3 Track and catenary on Line 15 South-East CO’Met project (Concert hall, exhibition
- Grand Paris (€108m) center and sport hall) - Orléans (€107m)
+8%
8.7 9.4
End-Sept 2017 End-Sept 2018
Bouygues Immobilier Colas Bouygues Construction
(a) Restated for IFRS 15 Renovation of 17 Boulevard Morland – Paris (€146m)
11UPBEAT INTERNATIONAL MARKETS
EXAMPLE OF CONTRACTS WON IN Q3 2018
International backloga (€b)
+20%b
18.5
-28% 0.1
15.5
0.2 5.3
+21%
4.4
University of Cambridge physics laboratory – Cambridge (€281m)
Design and construction of the Lille 13.1c
+20%
metropolitan authority
10.9 offices (€154m)
End-Sept 2017 End-Sept 2018
Bouygues Construction Colas Bouygues Immobilier
(a) Restated for IFRS 15 WestConnex tunnel - Sydney - Australia (around €650m
(b) Up 24% at constant exchange rates (up 20% at constant exchange rates and excluding Miller in order intake in Q3)
McAsphalt)
12
(c) Including AW Edwards backlog for €0.2bKEY FIGURES IN THE CONSTRUCTION BUSINESSES
Increase in profitability at Bouygues Immobilier in 9M 2018,
excluding Nextdoor one-off impact in Q3 2017 9M 2017 9M
€m Change
restated 2018
> Current operating margin: 6.5%, up 0.9pts YoY Sales 18,628 19,736 +6%a
Strong performance in building and civil works activities o/w France 9,845 10,270 +4%
in 9M 2018 at Bouygues Construction while energy o/w international 8,783 9,466 +8%
and services activities are penalized by challenges Current operating profit 579 406 -€173m
in the completion of three projects
o/w Bouygues Construction 277 139 -€138m
> Building and civil works current operating margin: 4.1%,
o/w Bouygues Immobilier excl. Nextdoor 95 112 +€17m
up 0.4pts YoY
Nextdoor capital gain 28 0 -€28m
Good 9M 2018 results in roads in mainland France and
o/w Colas 179 155 -€24m
difficulties in specialized activities (strikes at SNCF in French
rail business and overruns on a pipeline project) at Colas Current operating margin 3.1% 2.1% -1pt
(a) Up +4% like-for-like and at constant exchange rates
> Roads in mainland France current operating margin up 0.4pts YoY
1314
VERY GOOD PERFORMANCE IN MOBILE
Mobile plan customer base excluding MtoMa
(millions of customers)
15.8 MILLION MOBILE CUSTOMERS AT END-SEPTEMBER 10.8
2018
+1,377k customers in 9M 2018 10.2
+475k customers in Q3 2018
9.6
OF WHICH 10.8 MILLION MOBILE PLAN CUSTOMERS
9.0
EXCLUDING MTOMa
+452k customers in 9M 2018 8.5
+199k customers in Q3 2018
Q3 2014 Q3 2015 Q3 2016 Q3 2017 Q3 2018
(a) Machine-to-Machine
15A HIGH QUALITY MOBILE NETWORK
EXCELLENT RESULTS IN ARCEP 2018 SURVEY
Bouygues Telecom #1 in rural areasa in Voice, SMS and Mobile Broadband
Bouygues Telecom Bouygues Telecom Bouygues Telecom Bouygues Telecom Bouygues Telecom
#1 in voice calls #1 in text messages #1 in web surfing #1 in speed #1 in online videos
Bouygues Telecom #2 on average in France
IMPROVED SERVICES TO THE CUSTOMERS THANKS TO A WIDER COVERAGE
Bouygues Telecom reached 98% 4G coverage at end-September 2018 (99% expected at end-2018)
> 87% of shared network rolled-out at end-September 2018 (95% expected at end-2018)
> Densification of sites in dense areas (2,000 additional sites expected by 2022, up 50%)
(a) Rural areas : municipalities of less than 10,000 inhabitants (89% of the French territory) 16GROWTH ACCELERATION IN FTTHa
Fixed customer base (‘000 customers)
3.6 MILLION FIXED CUSTOMERS AT END-SEPTEMBER and share of FTTHa customers
2018 Total % FTTH 3.6
3.3
+162k customers in 9M 2018 3.0
2.7
+71k customers in Q3 2018 2.3 12.9%
6.3%
467K FTTH CUSTOMERS AT END-SEPTEMBER 2018
3.0%
+201k customers in 9M 2018
1.1%
+76k customers in Q3 2018 0.2%
Q3 2014 Q3 2015 Q3 2016 Q3 2017 Q3 2018
17
(a) Fiber-To-The-Home: optical fiber from the central office (where the operator's transmission equipment is installed) all the way to homes or business premises (Arcep definition)SHARP INCREASE IN PROFITABILITY
SALES FROM SERVICES UP 5% YEAR-ON-YEAR IN A HIGHLY €m
9M 2017
9M 2018 Change
COMPETITIVE MARKET restated
Sales 3,695 3,934 +6.5%a
Positive impact of Q2 2018 launch of new offers in Fixed
o/w sales from services 3,024 3,172 +5%
and Mobile
o/w sales billed to customers 2,882 3,027 +5%
9-MONTH 2018 EBITDA UP 15% AT €931M EBITDA 808 931 +15%
EBITDA margin of 29.4%, +2.7pts year-on-year EBITDA/sales from services 26.7% 29.4% +2.7pts
Current operating profit 263 314 +19%
+2.1pts year-on-year excluding the impact of 1800 MHz
frequency charges in 9M 2017 Operating profit 368b 528c +44%
Q3 2018 OPERATING PROFIT INCLUDES NON CURRENT Gross capex 789 920 +€131m
INCOME OF (a) Up 6.5% like-for-like and at constant exchange rates
(b) Including non-current income of €105m (mainly non-current income of €144m related to the
€110m related to 1800 MHz frequency charges capital gain on the transfer of sites and non-current charges of €48m related to network sharing)
(c) Including non-current income of €214m (mainly non-current income of €120m related to the
accounted for prior to 2018 capital gain on the transfer of sites and of €110m related to the cancellation of fees accounted
for the use of 1800 MHz frequencies prior to 2018 and non-current charges of €28m related to
network sharing)
€16m related to transfer of sites
18BTOB MARKET, A GROWTH DRIVER FOR BOUYGUES TELECOM
BOUYGUES TELECOM ENTREPRISES, 3RD BTOB TELECOM OPERATOR IN FRANCE
Over 20% Mobile market share in France with a presence in 35% of large companies and 10% of SME
A growing market share in Fixed: around 3%, +1pt in one year
Full range of Mobile, Fixed, Internet and network innovative solutions and related services (Digital/Cloud/Security)
DEMONSTRATING CONTINUED INVESTMENTS IN PROPRIETARY MOBILE AND FIXED INFRASTRUCTURE WITH
HIGH-QUALITY CUSTOMER SERVICE
STRATEGY: TO STRENGTHEN BOUYGUES TELECOM ENTREPRISES’ POSITION IN BOTH MOBILE AND FIXED
Expand Fixed market share and new innovative services for large companies and mid-sized businesses
Increase Mobile and Fixed market share in the fast growing SME segment
> Accelerated development through external growth
19BOUYGUES TELECOM OPENS EXCLUSIVE NEGOTIATIONS WITH KEYYO
COMMUNICATIONS TO STRENGTHEN ITS POSITION IN SME
KEYYO COMMUNICATIONS, A TELECOM OPERATOR TARGETING EXCLUSIVELY SME AND MID-SIZED
BUSINESSES
A well known brand with an excellent customer satisfaction level
Expert in marketing and advanced digitization
Simple, reliable and competitive solutions with a fully internally controlled technical platform
KEYYO COMMUNICATIONS KEY FIGURES
14,000 clients (200,000 end-users)
2018 objectives : sales expected to increase 30% vs 2017 (€24.4m) with current operating profit of €3.1m
Keyyo Communications is a Paris Euronext Growth listed company
PUBLIC TENDER OFFER EXPECTED TO CLOSE DURING H1 2019 WITH COMPLETION OF TRANSACTION SUBJECT TO
USUAL CONDITIONS
20CONTENTS
HIGHLIGHTS AND KEY FIGURES
REVIEW OF OPERATIONS
FINANCIAL STATEMENTS
OUTLOOK
ANNEX
21CONDENSED CONSOLIDATED INCOME STATEMENT (1/2)
9M 2017
€m 9M 2018 Change
restated
Sales 23,752 25,219 +6%a
Current operating profit 933 820 -€113m
Other operating income and expenses 82b 198c +€116m
Operating profit 1,015 1,018 +€3m
Cost of net debt (170) (163) +€7m
o/w financial income 17 21 +€4m
o/w financial expenses (187) (184) +€3m
Other financial income and expenses 12 25 +€13m
(a) Up 4% like-for-like and at constant exchange rates
(b) Including non-current charges of €17m at TF1 corresponding to amortization of audiovisual rights remeasured as part of the acquisition of Newen Studios and of €5m at Colas related to preliminary works
for the dismantling of the Dunkirk site, and non-current income of €105m at Bouygues Telecom (mainly non-current income of €144m related to the capital gain on the transfer of sites and non-current
charges of €48m related to network sharing)
(c) Including non-current charges of €16m at TF1 corresponding to amortization of audiovisual rights remeasured as part of the acquisition of Newen Studios and non-current income of €214m at Bouygues
Telecom (mainly non-current income of €120m related to the capital gain on the transfer of sites and €110m related to 1800 MHz frequency charges accounted for prior to 2018 and non-current charges of
€28m related to network sharing)
22CONDENSED CONSOLIDATED INCOME STATEMENT (2/2)
9M 2017
€m 9M 2018 Change
restated
Income tax (239) (266) -€27m
Share of net profit of joint ventures and associates 151 253 +€102m
o/w Alstom 105 230 +€125m
Net profit from continuing operations 769 867 +€98m
Net profit attributable to non-controlling interests (80) (95) -€15m
Net profit attributable to the Group 689 772 +€83m
23CONTENTS
HIGHLIGHTS AND KEY FIGURES
REVIEW OF OPERATIONS
FINANCIAL STATEMENTS
OUTLOOK
ANNEX
24OUTLOOK
THE GROUP EXPECTS STABLE OR SLIGHTLY LOWER CURRENT OPERATING PROFIT IN 2018 VS 2017
In the construction businesses, current operating profita and current operating margina should decline in
2018 compared to 2017 (by a few dozen basis points for current operating margin)
The Group remains confident in the strengths and the good positioning of its construction businesses in a
market demonstrating strong worldwide demand over the long term
TF1 confirmed its guidance in its nine-month results publication
> In 2018 TF1 should deliver a higher current operating margin than in 2017, excluding major sporting events
Bouygues Telecom is continuing its profitable growth momentum with a free cash flowb target of
€300m for 2019
> In 2018, sales from services are expected to grow more than 3% vs 2017, the EBITDA marginc should be higher
than in 2017 and gross capex is forecast at around €1.2 billion
25
(a) Excluding the capital gain of €28m on the sale of 50% of Nextdoor and on the remeasurement of the residual interest in the company at Bouygues Immobilier in 2017 (b) Free cash
flow = cash flow - cost of net debt - income tax expense - net capital expenditure. It is calculated before changes in WCR (c) EBITDA/sales from servicesCONTENTS
HIGHLIGHTS AND KEY FIGURES
REVIEW OF OPERATIONS
FINANCIAL STATEMENTS
OUTLOOK
ANNEX
26ANNEX
ITEMS IMPACTING 2018 RESULTS
REMINDER: APPLICATION OF IFRS 9 AND IFRS 15 FROM 1 JANUARY 2018
The 2017 figures have been restated by business segment; the quarterly impacts on the 2017 results are detailed in the Annex
The financial statements for the first half of 2018/2019 of Alstom were published after application from 1 April 2018 of IFRS 9 and 15.
The effect of this change results in a decrease in Bouygues’ shareholder equity recorded in Q3 2018 of €152m (for more details see the notes
for the consolidated financial statements 3.2)
SCOPE EFFECTS
Acquisition of the Miller McAsphalt group by Colas on 28 February 2018
> The acquisition price for 100% of the equity interest amounts to €611m
> Assets and liabilities were recognized in Q3 2018
> Pending the allocation of the acquisition price, a provisional goodwill of €223m has been recognized in Q3 2018
Acquisition of the aufeminin group by TF1 on 27 April 2018
> TF1 holds 95.26% of aufeminin on 30 September 2018 and filed a simplified cash tender offer followed by a squeeze-out on 3 October 2018
> The aufeminin group is fully consolidated on 30 September 2018
Acquisition of the Alpiq Engineering Services by Bouygues Construction and Colas on 31 July 2018
> The provisional acquisition price of €626m for 100% of the equity interest and current accounts net of cash acquired has been recognized as
provisional goodwill
> Assets and liabilities will be recognized as of Q4 2018
> The contribution to results for August and September will be booked in Q4 2018 27ANNEX
KEY FIGURES AT BOUYGUES CONSTRUCTION
France Order intakea (€b) Backlog by geographic region (at end-Sept 2018)
International 6%
10.2 +26% 25%
3%
8.1
5.8 +48%
3.9
42%
4.2 4.4 +5% 24%
End-Sept 2017 End-Sept 2018
France Asia and Middle East Europe (excl. France) Americas Africa
(a) Contracts are booked as order intakes at the date they take effect
For execution > Y+5
Backlog (€b)
9M 2017
For execution in Y+2 to Y+5 €m 9M 2018 Change
restated
For execution in Y+1 +14%a
For execution in Y Sales 8,521 8,589 +1%a
22.5
19.7 o/w France 3,949 4,089 +4%
2.5 +6%
2.4 o/w international 4,572 4,500 -2%
8.6 +18%
7.3 Current operating profit 277 139 -€138m
Current operating margin 3.3% 1.6% -1.7pts
7.2 8.5 +18%
Operating profit 277 139 -€138m
2.8 2.9 +2% (a) Up 3% like-for-like and at constant exchange rates
(a) Up 7% at constant exchange rates
End-Sept 2017 End-Sept 2018
(a) Up 17% at constant exchange rates
28ANNEX
KEY FIGURES AT BOUYGUES IMMOBILIER
Residential property Reservationsa (€b)
Commercial property
-9%
1.9
1.7
0.2
0.2 +12%
1.7 -11%
1.5
9M 2017 9M 2018
(a) Net of cancellations (residential property) and firm orders which cannot be cancelled (commercial property); Sways – Issy les Moulineaux – France
includes reservations taken via co-promotion
Commercial property 9M 2017
Backlog (€b)b €m 9M 2018 Change
Residential property restated
-1% Sales 1,695 1,716 +1%a
2.6 2.6 o/w residential 1,487 1,522 +2%
0.3 0.3 +8% o/w commercial 208 194 -7%
Current operating profit excl. Nextdoor 95 112 +€17m
2.3 2.3
-2% Current operating margin excl. Nextdoor 5.6% 6.5% +0.9pts
Current operating profit incl. Nextdoor 123 112 -€11m
End-Sept 2017 End-Sept 2018 Current operating margin incl. Nextdoor 7.3% 6.5% -0.8pts
(restated)
Operating profit 123 112 -€11m
(b) Backlog does not include reservations taken via co-promotion (a) Up 3% like-for-like and at constant exchange rates
29ANNEX
KEY FIGURES AT COLAS
9M 2017
Backlog (€b) €m 9M 2018 Change
restated
+13%a Sales 8,617 9,602 +11%a
o/w France (incl. French overseas
4,470 4,691 +5%
8.7 territories)
7.7 o/w international 4,147 4,911 +18%
+3%
3.4 Current operating profit 179 155 -€24m
3.3 Current operating margin 2.1% 1.6% -0.5pts
Operating profit 174 155 -€19m
(a) Up 5% like-for-like and at constant exchange rates
+21%
5.3
4.4
End-Sept 2017 End-Sept 2018
International and French overseas territories Mainland France
(a) Up 15% at constant exchange rates (up 7% excluding Miller McAsphalt)
30ANNEX
A STRONG AND SELECTIVE INTERNATIONAL PRESENCE
BOUYGUES OPERATES IN GROWING COUNTRIES WITH A LOW-RISK PROFILE
NORTHERN AND CENTRAL EUROPE
NORTH AMERICA United Kingdom: +1.4%
Switzerland: +2.3% RUSSIA: +1.7%
United States: +2.9%
Canada: +2.1%
0%
41%
25%
SOUTHERN EUROPE 1%
Spain: +2.8%
1%
AFRICA AND MIDDLE EAST: +3,5%
North Africa: +3.8%
10%
Construction businesses: regional sales
2% 20%
% as a proportion of total international
sales in 2017
LATIN AMERICA AND
%: IMF economic growth forecast for 2018 CARIBBEAN: +1.6% ASIA: +5.5%
Region classified A by Coface (low risk) AUSTRALIA: +3.0%
%: IMF economic growth forecast for 2018 31
Region classified B and C by Coface
(medium to high risk)ANNEX
KEY INDICATORSQ1restated
AT
2017
BOUYGUES
Q2 2017
restated TELECOM
Q3 2017
restated
Q4 2017
restated
2017 restated Q1 2018 Q2 2018 Q3 2018
Sales from mobile services
705 713 750 737 2,904 719 734 779
(€m)
Sales from fixed services (€m) 278 283 296 309 1,166 312 309 319
Mobile customer base 13,359 13,641 13,935 14,387 14,840 15,288 15,764
Mobile customer base excl.
10,773 10,819 10,874 10,998 11,097 11,175 11,343
MtoM
o/w plana 9,947 10,057 10,167 10,317 10,449 10,570 10,769
Mobile ABPUb 19.3 19.5 19.6 19.4 19.2 19.6 19.9
Data usage
3,312 4,503 5,267 n/a 5,415 6,171 6,858
(MB/month/subscriber)c
Fixed broadband customer
3,189 3,234 3,344 3,442 3,492 3,533 3,604
based
o/w FTTHe 144 171 209 265 329 391 467
Fixed ABPUf 26.6 26.3 27.0 27.2 26.3 25.6 25.5
(a) Plan subscribers: total customer base excluding prepaid customers according to the Arcep definition
(b) Average Billing Per User (see glossary on slide 47): excluding MtoM SIM cards and free SIM cards
(c) Quarterly usage, adjusted on a monthly basis, excluding MtoM SIM cards
(d) Includes broadband and very-high-speed subscriptions according to the Arcep definition
(e) Arcep definition: subscriptions with a peak download speed higher or equal to 100 Mbit/s 32
(f) Average Billing Per User (see glossary on slide 47), excluding B2BANNEX
FTTHa PREMISES MARKETEDb (MILLIONS)
Bouygues Telecom at end- Bouygues Telecom expected
Total premises on the marketc
September 2018 at end-2019
Very Dense
6.4
Area 2.7 4.5
Medium
Dense 13.2
Area/AMIId
6.5
35.5 3.4 6.3 12
Public
Initiative
15.9
Network
(PIN) Aread
0.2 1
(a) Fiber-To-The-Home – optical fiber from the central office (where the operator's transmission equipment is installed) all the way to homes or business premises (Arcep definition)
(b) Premises marketed: the connectable sockets, i.e. the horizontal and vertical deployed and connected via the concentration point
(c) As disclosed by Arcep in its public consultation of 5 October 2017 33
(d) In accordance with deployment by building operators in the AMII zone and by operators in the PIN zoneANNEX
SALES BY SECTOR OF ACTIVITY
Lfl &
9M 2017
€m 9M 2018 Change constant
restated
fxa
Construction businessesb 18,628 19,736 +6% +4%
o/w Bouygues Construction 8,521 8,589 +1% +3%
o/w Bouygues Immobilier 1,695 1,716 +1% +3%
o/w Colas 8,617 9,602 +11% +5%
TF1 1,474 1,576 +7% +2%
Bouygues Telecom 3,695 3,934 +6% +6%
Holding company and other 104 118 Ns Ns
Intra-Group eliminationc (354) (316) Ns Ns
Group sales 23,752 25,219 +6% +4%
o/w France 14,911 15,646 +5% +5%
o/w international 8,841 9,573 +8% +4%
(a) Like-for-like and at constant exchange rates
(b) Total of the sales contributions (after eliminations within the construction businesses)
(c) Including intra-Group eliminations of the construction businesses 34ANNEX
CONTRIBUTION TO GROUP EBITDAa BY SECTOR OF ACTIVITY
9M 2017
€m 9M 2018 Change
restated
Construction businesses 850 715 -€135m
o/w Bouygues Construction 317 222 -€95m
o/w Bouygues Immobilier 110 85 -€25m
o/w Colas 423 408 -€15m
TF1 257 299 +€42m
Bouygues Telecom 808 931 +€123m
Holding company and other (18) (21) -€3m
Group EBITDA 1,897 1,924 +€27m
(a) EBITDA: current operating profit before net depreciation and amortization expense, net provisions and impairment losses, reversals of unutilized provisions and impairment losses
and before effects of acquisition/loss of control
35ANNEX
CONTRIBUTION TO GROUP CURRENT OPERATING PROFIT BY SECTOR OF ACTIVITY
9M 2017
€m 9M 2018 Change
restated
Construction businesses 579 406 -€173m
o/w Bouygues Construction 277 139 -€138m
o/w Bouygues Immobilier 123 112 -€11m
o/w Colas 179 155 -€24m
TF1 116 124 +€8m
Bouygues Telecom 263 314 +€51m
Holding company and other (25) (24) +€1m
Group current operating profit 933 820 -€113m
36ANNEX
CONTRIBUTION TO GROUP OPERATING PROFIT BY SECTOR OF ACTIVITY
9M 2017
€m 9M 2018 Change
restated
Construction businesses 574 406 -€168m
o/w Bouygues Construction 277 139 -€138m
o/w Bouygues Immobilier 123 112 -€11m
o/w Colas 174 155 -€19m
TF1 99 108 +€9m
Bouygues Telecom 368 528 +€160m
Holding company and other (26) (24) +€2m
Group operating profit 1,015a 1,018b +€3m
(a) Including non-current charges of €17m at TF1 corresponding to amortization of audiovisual rights remeasured as part of the acquisition of Newen Studios and of €5m at Colas related to preliminary works
for the dismantling of the Dunkirk site, and non-current income of €105m at Bouygues Telecom (of which non-current income of €144m related to the capital gain on the sale of sites and non-current charges
of €48m related to network sharing)
(b) Including non-current charges of €16m at TF1 corresponding to amortization of audiovisual rights remeasured as part of the acquisition of Newen Studios and non-current income of €214m at Bouygues
Telecom (mainly non-current income of €120m related to the capital gain on the transfer of sites and €110m related to the cancellation of fees accounted for the use of 1800 MHz frequencies prior to 2018
and non-current charges of €28m related to network sharing)
37ANNEX
CONTRIBUTION TO NET PROFIT ATTRIBUTABLE TO THE GROUP
BY SECTOR OF ACTIVITY
9M 2017
€m 9M 2018 Change
restated
Construction businesses 457 278 -€179m
o/w Bouygues Construction 233 109 -€124m
o/w Bouygues Immobilier 70 62 -€8m
o/w Colas 154 107 -€47m
TF1 37 36 -€1m
Bouygues Telecom 216 311 +€95m
Alstom 105 230 +€125m
Holding company and other (126) (83) +€43m
Net profit attributable to the Group 689 772 +€83m
38ANNEX
CONDENSED CONSOLIDATED BALANCE SHEET
End-Dec
End-Sept
€m 2017 Change
2018
restated
Non-current assets 17,568 19,194 +€1,626m
Current assets 18,697 18,808 +€111m
Held-for-sale assets and operations 38 10 -€28m
TOTAL ASSETS 36,303 38,012 +€1,709m
Shareholders' equity 10,416 10,383 -€33m
Non-current liabilities 8,128 9,097 +€969m
Current liabilities 17,759 18,532 +€773m
Liabilities related to held-for-sale operations - - -
TOTAL LIABILITIES 36,303 38,012 +€1,709m
Net debt (-)/Net surplus cash (+) (1,917) (5,498) -€3,581m
39ANNEX
CONTRIBUTION TO GROUP NET CASH FLOWa BY SECTOR OF ACTIVITY
9M 2017
€m 9M 2018 Change
restated
Construction businesses 794 641 -€153m
o/w Bouygues Construction 292 160 -€132m
o/w Bouygues Immobilier 68 62 -€6m
o/w Colas 434 419 -€15m
TF1 208 252 +€44m
Bouygues Telecom 610 801 +€191m
Holding company and other (87) (46) +€41m
TOTAL 1,525 1,648 +€123m
(a) Net cash flow = cash flow - cost of net debt - income tax expense
40ANNEX
CONTRIBUTION TO NET CAPITAL EXPENDITURE BY SECTOR OF ACTIVITY
9M 2017
€m 9M 2018 Change
restated
Construction businesses 270 314 +€44m
o/w Bouygues Construction 65 97 +€32m
o/w Bouygues Immobilier 12 6 -€6m
o/w Colas 193 211 +€18m
TF1 154 145 -€9m
Bouygues Telecom 534 714 +€180m
Holding company and other 5 6 +€1m
TOTAL 963 1,179 +€216m
41ANNEX
CONTRIBUTION TO GROUP FREE CASH FLOWa BY SECTOR OF ACTIVITY
9M 2017
€m 9M 2018 Change
restated
Construction businesses 524 327 -€197m
o/w Bouygues Construction 227 63 -€164m
o/w Bouygues Immobilier 56 56 €0m
o/w Colas 241 208 -€33m
TF1 54 107 +€53m
Bouygues Telecom 76 87 +€11m
Holding company and other (92) (52) +€40m
TOTAL 562 469 -€93m
(a) Free cash flow = cash flow - cost of net debt - income tax expense - net capital expenditure. It is calculated before changes in WCR
42ANNEX
NET DEBT (-)/NET SURPLUS CASH (+)
End-Dec
End-Sept
€m 2017 Change
2018
restated
Bouygues Construction 3,409 2,356 -€1,053m
Bouygues Immobilier (86) (458) -€372m
Colas 433 (1,293) -€1,726m
TF1 257 (51) -€308m
Bouygues Telecom (976) (1,173) -€197m
Holding company and other (4,954) (4,879) +€75m
TOTAL (1,917) (5,498) -€3,581m
43ANNEX
DEBT MATURITY SCHEDULE AT END-SEPTEMBER 2018
Available cash: €7.9b
€11b
€10b
€9b
€8b
€7b
€6b Undrawn MLT
facilities
€5b €6.3b
€4b
€3b
€2b
€1b Cash
€1.6b
€0b
Liquidity
44ANNEX
IMPACT OF IFRS 15 ON 2017 FINANCIAL STATEMENTS
o/w o/w o/w
€m 2017 reported 2017 restated
Bouygues Immobilier Bouygues Telecom TF1
Sales 32,904 +37 -26 +7 32,923
Current operating profit 1,420 -5 -9 0 1,406
Operating profit 1,533 -5 -9 0 1,519
Income tax (303) 0 +4 0 (299)
Share of net profit of joint ventures and associates 163 +6 0 0 169
Net profit from continuing operations 1,205 +1 -5 0 1,201
Net profit attributable to non-controlling interests (120) 0 +1 0 (119)
Net profit attributable to the Group 1,085 +1 -4 0 1,082
45ANNEX
IMPACT OF IFRS 15 ON 2017 INTERIM RESULTS
Par
€m trimestre Q1 Q2 Q3 Q4
Reported Impact Restated Reported Impact Restated Reported Impact Restated Reported Impact Restated
Sales 6,847 -10 6,837 8,315 -44 8,271 8,666 -22 8,644 9,076 +95 9,171
o/w Bouygues Telecom 1,222 -12 1,210 1,212 -16 1,196 1,293 -4 1,289 1,359 +6 1,365
o/w Bouygues Immobilier 517 -3 514 638 -29 609 591 -19 572 966 +88 1,054
o/w TF1 499 +4 503 538 +2 540 429 +2 431 659 -1 658
Current operating profit (67) -8 (75) 452 -30 422 591 -5 586 444 +29 473
o/w Bouygues Telecom 41 -9 32 121 -18 103 128 0 128 39 +18 57
o/w Bouygues Immobilier 31 0 31 42 -11 31 66 -5 61 84 +11 95
Operating profit (84) -8 (92) 501 -30 471 641 -5 636 475 +29 504
o/w Bouygues Telecom 34 -9 25 176 -18 158 185 0 185 75 +18 93
o/w Bouygues Immobilier 31 0 31 42 -11 31 66 -5 61 84 +11 95
Net profit attributable to the Group (38) -3 (41) 278 -17 261 473 -4 469 372 +21 393
46ANNEX
GLOSSARY
SALES FROM SERVICES COMPRISE:
- Sales billed to customers, which include:
In Mobile:
o For BtoC customers: sales from outgoing call charges (voice, texts and data), connection fees, and value-added services
o For BtoB customers: sales from outgoing call charges (voice, texts and data), connection fees, and value-added services, plus sales from business
services
o Machine-To-Machine (MtoM) sales
o Visitor roaming sales
o Sales generated with Mobile Virtual Network Operators (MVNOs)
In Fixed:
o For BtoC customers: sales from outgoing call charges, fixed broadband services, TV services (including Video on Demand and catch-up TV), and
connection fees and equipment hire
o For BtoB customers: sales from outgoing call charges, fixed broadband services, TV services (including Video on Demand and catch-up TV), and
connection fees and equipment hire, plus sales from business services
o Sales from bulk sales to other fixed line operators
- Sales from incoming Voice and Texts
- Spreading of handset subsidies over the projected life of the customer account, required to comply with IFRS 15
- Capitalization of connection fee sales, which is then spread over the projected life of the customer account
ABPU (AVERAGE BILLING PER USER):
- Sales billed to customers divided by the average number of customers over the period
47You can also read