HTA Market Update AUGUST 2021 - Gardenforum
←
→
Page content transcription
If your browser does not render page correctly, please read the page content below

HTA Market Update AUGUST 2021
Contents
3. Overview: the story this month            13. The UK Economy – inflation
4. Garden centre sales: July                 14. Unemployment
5. Garden centre sales: Calendar year to end 15.   Vehicle fuel prices – petrol & diesel
   of July
                                             16.   Water – river flows
6. Garden centre sales: Detailed July
   breakdown                                 17.   Water – groundwater levels

7. Garden centre sales: July average         18.   Weather
    transaction values                       19. Closing comments
8. Covid habits here to stay
9. Consumer confidence: Financial
10. Progress with vaccine rollout
11. Consumer issues tracker part 1
12. Consumer issues tracker part 2

                                                                                           2
Overview: the story this month
       Overall, national garden centre sales in July were up 3% from July 2020 and up 27% from July 2019.
       Garden/gardening sales were down 13% from July of last year, as other leisure options opened up with
       the easing of lockdown. However, non-gardening/gardening categories were down 3% from July 2019
       indicating that consumers may still be slightly hesitant to visit catering outlets.
       Garden centre sales for the year to end of July were up 43% from the same period in 2020 and up 27%
       in comparison to 2019. However, the increases on last years sales are due to the heavy restrictions placed
       on trading last year during the first lockdown. Sales increase’s from 2019, show the demand for garden
       centres has maintained growth since ‘normal’ times.
       The national Average Transaction Value in July for the garden store was £27.61, down 10% from July
       2020 but up 29% from 2019 suggesting a combination of consumers purchasing in greater quantities but
       potentially also price increases through the supply chain due to scarcity and increased costs. Catering
       ATVs were up 60% on July 2019, however footfall is seemingly still reduced as sales remain down.
       Garden furniture sales increased 8% from July 2020 and 63% from July 2019 which is indicative of the
       increase in GfK’s Major Purchase Index where an increased proportion of consumers believe ‘now is the
       time to buy’ and are more comfortable to be making large purchases and investing in their gardens.
       Consumers still intend to maintain covid-19 hygiene habits such as mask wearing and hand sanitising.
       Moreover, outdoor lovers intend to avoid crowded spaces and spend more time outdoors which could
       benefit garden centres through increased footfall outdoors and increased sales as they invest in their
       outdoor spaces.
       The inflation rate on prices for consumer/household goods and fuel prices have increased for another
       consecutive month which will put a pinch on consumers’ disposable incomes.

    Read on for the detail…

HTA Market Update August 2021 > AUGUST EDITION OVERVIEW                                                             3
Garden centre sales: July
  Nationally, overall garden centre sales in July were 3% up on July 2020, and 27% up on July 2019. Within this,
  garden/gardening categories were down -13% from July 2020 when much other leisure and entertainment were
  unavailable to consumers; but were 35% up on July 2019. Non-garden/gardening categories were 35% up on July
  2020 when catering began to reopen under heavy restrictions, and were 3% down on more typical times of July 2019.

                                Overall
                                                                                       How are these figures calculated?
                                                 Garden / Non-garden /
                                                gardening gardening                    The national sales figures we report each month
                                                                                       come from the HTA Garden Retail Monitor (GRM)
                                                                                       system. We’ve now moved over to a newer GRM
July 2021 vs July 2020
                                                    13%              35%               system where sales data from submitting garden
                                  3%                                                   centres is automatically uploaded to a secure
                                                                                       server via the EPOS system. These garden centres
                                                                                       can then login to the portal to benchmark their
                                                                                       sales against regional and national averages for a
                                                                                       variety of sales metrics. We’re looking to sign up
                                                                                       more garden centres to the system, allowing us to
                                                                                       include more reliable detailed breakdowns of
                                                                                       trends in sales in these Market Update reports.
July 2021 vs July 2019
                                  27%                36%              3%               If you’re interested or for more information visit:
                                                                                       hta.org.uk/grm

   (Figures reported are                                   *note non-garden/gardening
   exclusive of VAT)                                       includes catering which has faced
                                                           restrictions across the UK
                                                                                                               Source: HTA Garden Retail Monitor

HTA Market Update August 2021 > GARDEN CENTRE SALES: JULY                                                                             4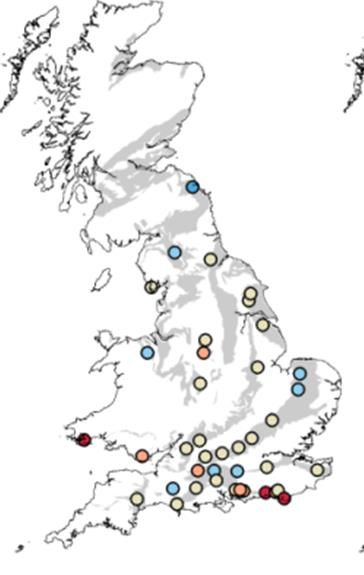
Garden centre sales: calendar year to
        end of July
  Year to end of July comparisons of garden centre sales nationally show 2021 as 43% up on 2020 and 27% up on 2019.
  Within this, garden/gardening sales were 50% up for 1st January – 31st July compared with the same period of 2020 and
  54% up on the first seven months of 2019. Non-garden/gardening category sales finished the year to end of July 21%
  up on 2020 where of course the first national lockdown reduced trading time by around 8 weeks; and 23% down on the
  same period in 2019 which was free of COVID-19 and trading restrictions.
                                  Overall                                               How are these figures calculated?
                                                  Garden / Non-garden /
                                                                                        The national sales figures we report each month
                                                 gardening gardening
                                                                                        come from the HTA Garden Retail Monitor (GRM)
                                                                                        system. We’ve now moved over to a newer GRM
Calendar year to end of                                                                 system where sales data from submitting garden
   July 2021 vs 2020              43%               50%               21%
                                                                                        centres is automatically uploaded to a secure
*note garden centres were
                                                                                        server via the EPOS system. These garden centres
closed until mid-end of May
varying by devolved nation                                                              can then login to the portal to benchmark their
during the first COVID national                                                         sales against regional and national averages for a
lockdown                                                                                variety of sales metrics. We’re looking to sign up
                                                                                        more garden centres to the system, allowing us to
                                                                                        include more reliable detailed breakdowns of
                                                                                        trends in sales in these Market Update reports.
Calendar year to end of                                              23%
   July 2021 vs 2019               27%              54%                                 If you’re interested or for more information visit:
                                                                                        hta.org.uk/grm

   (Figures reported are                                   *note non-garden/gardening
   exclusive of VAT)                                       includes catering which has
                                                           faced restrictions across the UK
                                                                                                                Source: HTA Garden Retail Monitor

HTA Market Update August 2021 > GARDEN CENTRE SALES: JULY                                                                              5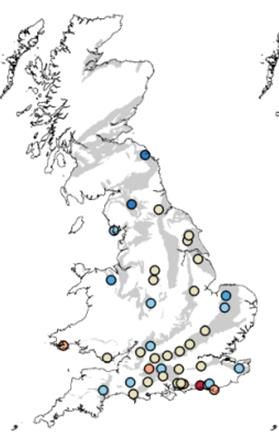
Category               July 2021   July 2021
    Garden centre                                                                 vs 2020     vs 2019

    sales: detailed                                     Bedding plants

                                                  Hardy plants, shrubs & trees
                                                                                   -9%
                                                                                   -21%
                                                                                              +19%
                                                                                              +36%
    July breakdown                                       Houseplants               -20%       +42%
                                                             Seeds                 -29%       +36%
In July, continuing the pattern we saw in June,
garden/gardening sales across the categories                 Bulbs                 -17%       +133%
were down on 2020 which saw exceptional
demand in a hot summer following lockdown;            Plant care products          -23%       +30%
with the exception of garden furniture which
experienced 8% growth on July 2020. Non-           Garden tools & equipment        -2%        +28%
garden/gardening category sales however
                                                       Garden furniture            +8%        +62%
show the reverse pattern, improving on 2020
where sales were restricted/discouraged and             BBQs & heating             -13%       +33%
catering reopened with strict COVID guidelines
in place.                                         Garden features & structures     -20%       +37%
June 2019 comparisons highlight the                   Outdoor containers           -27%       +50%
continuing strong demand for gardening
though, with houseplants up 42%, hardy
                                                         Wild bird care            -9%        +19%
plants up 36%, seeds up 6% and bulbs up           Indoor living & homewares        +1%        +21%
133%.
                                                            Gifting               +12%        +22%
Catering sales remained down on 2019 (-39%),
despite the final easing of restrictions.                    Pets                  +9%         +7%
                                                       Food & farm shop           +16%        +71%
Source: HTA Garden Retail Monitor                          Catering               +284%        -39%

HTA Market Update August 2021 > GARDEN CENTRE SALES JULY BREAKDOWN                                       6
Garden centre sales: July Average
Transaction Values (ATVs)
July’s national Average Transaction Value for the garden store was £27.61, down 10% from July 2020 but up 29% from
July 2019. This suggests that sales growth could be driven by a combination of more items in customer’s baskets and/or
price increases due to increased costs through the supply chain that are ultimately passed on to consumers. Meanwhile,
the national catering ATV was up 30% from July 2020 and up 60% from July 2019, suggesting that customers are
spending more but with overall catering sales down, work may need to be done to attract footfall, and encourage
customers to return. Trend reports have indicated that consumers are keener than before to treat themselves to
something extra, however VAT currently running temporarily at 5% in hospitality as part of the government’s COVID
relief measures may also partly explain the value uplift in ATV’s exclusive of VAT.
(Figures reported are
exclusive of VAT)
Garden store Catering
27.61 (EXC. VAT) 13.74 (EXC. VAT)
JULY 2021 JULY 2021
Vs JULY Vs JULY VS JULY VS JULY
2020 2019 2020 2019
-10% +29% +30% +60%
(£30.73) (£21.40) (£10.61) (£8.60)
Source: HTA Garden Retail Monitor
HTA Market Update August 2021 > GARDEN CENTRE SALES ATV 7Covid-19 Hygiene Habits Here to Stay
Which of the following are you planning to do over the next 12
months?
Spend more time outdoors/in nature 50%
Avoid crowded indoor public places (e.g.
52%
shopping malls/public transport)
Clean my home more often 28%
Wash or sanitise my hands more 48%
Wear face masks in indoor public places 57%
0% 10% 20% 30% 40% 50% 60% 70% 80% 90% 100%
When asked in March, many GB consumers claimed they will stick to their hygiene habits over the next year despite restrictions
lifting. 57% of consumers expect to maintain wearing a mask and 52% plan to avoid crowded spaces. Those who say they love
spending time outdoors over-index on avoiding crowded spaces and are more likely to be aged over 45 and female with an
interest in nature, which closely matches the demographic profile of a typical keen gardener. Choosing to maintain Covid-19
hygiene habits is most likely due to feeling at increased risk during the pandemic. Those aged over 55 are more likely to say
they plan to maintain COVID hygiene habits. Garden centres could appeal to these consumers by maintaining certain hygiene
practices such as providing sanitizer throughout the stores and encouraging people to wear masks indoors whilst emphasising
their outdoor shop spaces, though being careful not to put-off the proportion of consumers who are feeling comfortable to visit
in the absence of laws requiring masks etc.. The outdoor aspect of garden centres could be extra attractive to consumers who
are still covid-19 conscious. Increased footfall for outdoor garden centre spaces and increased sales could be expected as
outdoor lovers may invest in improving their outdoor spaces in their homes during post-lockdown times.
Source: Foresight Factory │ 4801 online respondents aged 16+, GB, 2021 March
HTA Market Update August 2021 > LOCKDOWN HABITS HERE TO STAY 8Consumer confidence: financial
The overall consumer confidence index increased by 2 points since June 2021, as consumer confidence continues to
increase and stabilise to similar levels seen before March 2020. The effective vaccine rollout contributed to ending
lockdown in July 2021 which has helped to restore consumer confidence. However, the confidence levels increasing
may be halted soon as consumer price inflation increases, the furlough scheme comes to an end, and rising Covid-19
infections could potentially dampen consumers confidence. The major purchase index has increased by 7 points Click to view the
since last month with many consumers agreeing that now is the right time to buy which is evident with increased full summary
garden furniture sales. Increased retail and eating-out spend provides evidence that consumers are comfortable to
10
continue spending as lockdown has ended.
Overall
0 index
May-17
Jul-18
Mar-13
May-13
Jul-13
May-15
Jul-15
Jul-16
May-18
Jul-19
May-20
Jul-20
Jan-14
Mar-14
May-14
Jul-14
Jan-15
Mar-15
Jan-16
Mar-16
May-16
Jan-17
Mar-17
Jul-17
Jan-18
Mar-18
Jan-19
Mar-19
May-19
Jan-20
Mar-20
Jan-21
Mar-21
May-21
Jul-21
Sep-19
Sep-13
Nov-13
Sep-14
Nov-14
Sep-15
Nov-15
Sep-16
Nov-16
Sep-17
Nov-17
Sep-18
Nov-18
Nov-19
Sep-20
Nov-20
score:
*
-10
-20 -7
Overall consumer confidence index score (see purple line for trendline)
-30 *this is 20 points higher
than July 2020
Measure Relative score vs. July 2020
-40 Consumers are asked how the financial position of
their household has changed over the last year and
Personal financial situation: is expected to change in the next year, as well as
during last 12 months -1 3 points higher that of the general economy. They’re also asked if
over next 12 months 11 11 points higher they believe ‘now’ is a good time to make major
General economic situation: purchases or to be saving money. The first three
during last 12 months -43 18 points higher measures in the table make up the overall index
over next 12 months -5 36 points higher score. Whilst the Savings Index indicates whether
consumers are looking to save rather than spend
Major Purchase Index 2 28 points higher their money. Relative scores are given as a
comparative to when records began in 1974.
Savings Index 20 1 points higher Source: GfK
HTA Market Update August 2021 > CONSUMER CONFIDENCE: FINANCIAL 9Progress with vaccine rollout
As of 2nd August 2021, 88.7% of the adult population have received their first vaccine and 73% are fully vaccinated.
All over 18s have now been offered the vaccine with the option of making an appointment or going to a walk-in
vaccination site. The government have started offering vaccines to 12-18 year olds who have underlying health
conditions or if they live with high-risk individuals. In addition, the government has decided to offer 16-17 year olds
the vaccine too. These new developments providing the vaccines to younger age groups will further increase the
total people fully vaccinated in the country. High vaccination rates allowed the UK end lockdown restrictions on
19th July 2021.
First and second vaccination doses given in the UK (1st January to 6th June 2021)
50000000 45000000
45000000 First doses Second doses 40000000
40000000 35000000
35000000
30000000
30000000
25000000
25000000
20000000
20000000
15000000
15000000
10000000 10000000
5000000 5000000
0 0
07/03/2021 07/04/2021 07/05/2021 07/06/2021 07/07/2021
Source: GOV.UK
HTA Market Update August 2021 > PROGRESS WITH VACCINE ROLLOUT
10Consumer issues tracker
The most recent Issues Index highlights that consumers concern over the covid-19 virus was steadily decreasing however
concern rose again last month most likely from the increased cases of the Delta variant in the country. Covid-19 is still the
most concerning issue with 56% agreeing. The economy is perceived the second largest issue with 27% of adults
concerned, but concern over the economy has been steadily decreasing since June 2020 most likely due to businesses
being able to trade from lockdown rules easing and consumers feeling more comfortable to spend money. However,
concern over unemployment and poverty is gradually increasing as these issues will take time to recover to pre-
pandemic days.
The Economy, Poverty/Inequality and The Pandemic and NHS/Healthcare
100 Unemployment 100
80 80
60 60
40 40
20 20
0 0
Oct-20
Sep-19
Nov-19
Apr-20
Feb-21
Apr-21
Mar-19
May-19
Jul-19
Jan-20
Jul-20
Dec-20
Jan-19
Jun-21
Sep-19
Apr-20
Feb-21
May-19
Jul-19
Nov-19
Jul-20
Oct-20
Dec-20
Apr-21
Jan-19
Mar-19
Jan-20
Jun-21
Economy Poverty/Inequality Unemployment Pandemic disease NHS/healthcare
+2% +2% +7% +2%
27% -2% 19% vs May
14% vs April 56% 24%
vs May vs May vs May
Ipsos MORI's Issues Index is conducted monthly and provides an overview of the key issues concerning the country. Ipsos MORI interview a representative sample
of 1,004 adults aged 18+ across Great Britain. The participants are not prompted with any answers. Data are weighted to match the profile of the population.
HTA Market Update August 2021 > CONSUMER ISSUES TRACKER 11Consumer issues tracker
As the pandemic moves away from the forefront of consumers minds, their concerns begin to move towards other
issues. Environmental concern has increased to 21% as concern reaches the same levels as pre-pandemic days with
the highest score since February 2020. Consumer concern over education rose to 21% most likely due to concerns
over disruption to education from the pandemic and underfunding. EU exit concern has decreased since December
2020 since a trading deal was made with the EU upon the UK’s exit in January 2021.
Education/schools +6%
21% vs May EU Exit and Immigration
100
100
80
90
60 80
40 70
20 60
0 50
40
30
20
10
Pollution/environment/climate change 0
100 +3%
80
21% vs May
Immigration/immigrants EU Exit
60
40 +7% +1%
13% vs March 23% vs May
20
0
Ipsos MORI's Issues Index is conducted monthly and provides an overview of the key issues concerning the country. Ipsos MORI interview a representative sample
of 1,004 adults aged 18+ across Great Britain. The participants are not prompted with any answers. Data are weighted to match the profile of the population.
HTA Market Update August 2021 > CONSUMER ISSUES TRACKER 12The UK economy
5.0%
4.5%
4.0%
3.5%
3.0%
2.5%
2.0% CPIH
1.5%
inflation:
2.4%
1.0%
0.5%
0.0%
2011 MAR
2011 JUN
2011 SEP
2012 MAR
2012 JUN
2012 SEP
2013 MAR
2013 JUN
2013 SEP
2014 MAR
2014 JUN
2014 SEP
2015 MAR
2015 JUN
2015 SEP
2016 MAR
2016 JUN
2016 SEP
2017 MAR
2017 JUN
2017 SEP
2018 MAR
2018 JUN
2018 SEP
2019 MAR
2019 JUN
2019 SEP
2020 MAR
2020 JUN
2020 SEP
2021 MAR
2021 JUN
2011 DEC
2012 DEC
2013 DEC
2014 DEC
2015 DEC
2016 DEC
2017 DEC
2018 DEC
2019 DEC
2020 DEC
The Consumer Prices Index including owner occupiers’ housing costs (CPIH) 12-month
inflation rate rose by 2.4% in June 2021 compared with June 2020. It also rose 0.3% A leading measure of inflation, the consumer
from the previous month (May). The largest upward contributions to the CPIH 12-month prices index is the rate at which the prices of
inflation rate came from transport again (0.80 percentage points). Other large goods and services bought by households rise
contributors of the rising inflation rate within the last month can be attributed to rising and fall; it is estimated using consumer price
costs of fuel, housing & household goods, housing & household services, recreation & indices. Although otherwise identical to CPI, it
culture as prices for these all dramatically decreased in 2020 but are now increasing represents a more comprehensive measure as
rapidly in 2021. Inflation rates continuing to increase will continue to burden it includes costs associated with owning,
consumers with loans and mortgages as with inflation rate increases so do interest maintaining and living in one’s own home,
rates. Moreover, the increased prices of essentials limits consumers spending power, along with Council Tax. This index is based on
particularly if the rate of inflation continues to outstrip pay growth. a representative sample of 700 goods and
services, reviewed annually.
HTA Market Update August 2021 > THE UK ECONOMY 13Unemployment
The UK unemployment rate currently stands at 4.8% as the unemployment rate improved on a quarterly basis. In June
2021, another 356,000 people joined the payroll but this is still 206 000 below pre-pandemic days (February, 2020). The
number of job vacancies has increased again with 862,000 job vacancies in April to June 2021 as more job
opportunities become available this will decrease the unemployment rate. On a more positive note, regions such as
North East, North West, East Midlands in England and Northern Ireland unemployment rates have recovered and
surpassed pre-pandemic levels. Unemployment is improving since 2020 as businesses begin to increase productivity as
lockdown has ended and life slowly returns to normal.
8.0%
7.0%
6.0%
5.0%
% unemployed
4.0%
3.0%
2.0%
1.0%
0.0%
Unemployment data (aged 16 and over, seasonally adjusted). Source: ONS
HTA Market Update August 2021 > UNEMPLOYMENT 14Vehicle fuel prices
Pence per litre (ppl)
160
150 Unleaded petrol in PPL
Diesel in PPL
140
130
120
Click to view the full
110 summary report and
regional breakdowns
100
90
Jan-17
Jul-20
Mar-18
May-19
Jul-12
Jul-13
Mar-10
May-10
Jul-10
Jan-11
Mar-11
May-11
Jul-11
Jan-12
Mar-12
May-12
Jan-13
Mar-13
May-13
Jan-14
Mar-14
May-14
Jul-14
Jan-15
Mar-15
May-15
Jul-15
Jan-16
Mar-16
May-16
Jul-16
Jul-18
Jul-19
Mar-17
May-17
Jul-17
Jan-18
May-18
Jan-19
Mar-19
Jan-20
Mar-20
May-20
Jan-21
Mar-21
May-21
Sep-14
Nov-15
Sep-10
Nov-10
Sep-11
Nov-11
Sep-12
Nov-12
Sep-13
Nov-13
Nov-14
Sep-15
Sep-16
Nov-16
Sep-17
Nov-17
Sep-18
Nov-18
Sep-19
Nov-19
Sep-20
Nov-20
We also monitor vehicle fuel prices to gauge the situation for consumers and
businesses alike. Figures reported are national averages, measured in price per
litre. For regional breakdowns click or tap here to view the AA’s fuel reports.
Petrol Diesel
Fuel prices have risen for nine consecutive months and they are now at an 8 year
(ppl): high. The world is slowly resuming travel which brings an increased demand for (ppl):
131 oil but the supply is struggling to keep up resulting in motorist’s pockets feeling
the burden. Fuel prices are anticipated to keep increasing as productivity around
the world picks up from over a year of lockdowns. Garden centres may feel the
133
effects through stock and delivery price increases. Moreover, most consumers will
begin to feel the effects of fuel increases as it has a knock-on effect on other
goods prices increasing too. Source: AA
HTA Market Update August 2021 > VEHICLE FUEL PRICES 15Water – River flows
The charts show the expected probabilities of above or below average river flow levels in the coming months.
Essentially, the more yellow, orange or red that appears in a chart, the greater the probability of below normal levels in
the area and an increased probability of water shortages. The HTA will continue to monitor and update you on the
water situation via the website hta.org.uk.
The full reports contain a
much more
comprehensive picture
of the forecast water
situation, including
rainfall required to
overcome below normal
conditions.
For the full
reports
click here
River flows are anticipated to be normal to above normal in the South and South-East during July. However, the rest of the UK are
anticipated to have normal to below normal flows during July. Most parts of Scotland are expected to have below normal flows. River
flows are expected to become normal towards the end of the 3 month period ending in September.
Source: Centre for Ecology and Hydrology
HTA Market Update August 2021 > WATER: RIVER FLOWS 16Water – Groundwater levels
The charts show the expected probabilities of above or below average groundwater levels in the coming months.
Essentially, the more yellow, orange or red that appears in a chart, the greater the probability of below normal levels in
the area and an increased probability of water shortages. The HTA will continue to monitor and update you on the
water situation via the website hta.org.uk.
1 month outlook 3 month outlook The full reports contain a
much more
comprehensive picture
of the forecast water
situation, including
rainfall required to
overcome below normal
conditions.
For the full
reports
click here
Groundwater levels in June were varied with below normal levels in the South and above normal levels in the north. July is expected
to follow a similar groundwater pattern to June. Groundwater levels are anticipated to be normal to above normal during July to
September except for Southern England. South England’s groundwater levels are expected to be normal to below normal during the 3
month outlook.
Source: Centre for Ecology and Hydrology
HTA Market Update August 2021 > WATER: GROUNDWATER LEVELS 17Weather
The UK had a mixture of weather for the first 12 days of the month as some areas had heavy rain whilst other
areas had less rain and more warmth. By mid-month, the weather dried up and some days had 30c
temperatures with sunshine. Despite some areas having a wet month with almost double the rainfall - the UK
only had 93% of the average rainfall in July. This was also the 5th equal warmest July the UK has seen since
1884.
July July July July
The figures reported are
2021 2020 2021 2020 national averages for
the UK. To view the
figures on a regional
192 144 73 96 basis: click or tap here
Hours of to visit the MET Office
sunshine Rainfall (mm)
website and view the
year ordered stats by
month.
July July July July
2021 2020 2021 2020
11 15 17 14
Mean temperature
No. of rain days
(Celsius)
Source: MET Office
HTA Market Update August 2021 > WEATHER 18Closing comments
We hope you enjoyed the format and content of
this Market Update.
If you have any questions or would like to see
something else included, please don’t hesitate to
contact marketinfo@hta.org.uk
19You can also read