The 2021 Fixed Income Outlook - Where to Look, What to Do
←
→
Page content transcription
If your browser does not render page correctly, please read the page content below
Outlook
Fixed Income
                          The 2021 Fixed Income Outlook
February 2021             Where to Look, What to Do
                          Altaf Kassam
                          Head of Investment Strategy and Research, EMEA

                          • Rates will be lower, and yield curves flatter, for longer.
                            Investors must deal with this reality and plan for
                            optimizing their portfolios accordingly.
                          • If you need return, you need to look outside Developed
                            Market Government Bonds. Emerging Market,
                            especially China, and High Yield bonds are the key
                            places to consider.
                          • Credit will be supported by central banks worldwide.
                            We believe that will sustain spread products for some
                            time.

Lower, Flatter Persists   The first point we need to make is that we think the interest rate environment we are now in is
                          going to persist for a while. In the words of the song – ‘Now is Tomorrow’ and investors need
                          to optimize for now. Lower rates and flatter yield curves are no blip.

What’s Wrong with         Developed Market Sovereign Bond yields are likely to remain rangebound around historic lows,
Developed Market          for some time, due to Quantitative Easing (QE). The US Fed, for example, is likely to maintain its
                          policy rate at (or near) zero for the foreseeable future as it seeks to achieve its desired outcomes
Government Bonds?
                          of lower unemployment and higher inflation.

                          In this environment, investors will increasingly need to turn their attention away from government
                          debt to fixed income offerings that provide more substantial yields.
What’s Wrong with The graph below makes clear why it might make sense to underweight these core “risk-free”
Developed Market Developed Market Government Bonds:
Government Bonds?
(Contd.)
5
Figure 1
Global 10Y 4
Govt. Bond
Yields (%) 3
USA 2
Germany
UK 1
Japan
China 0
-1
Jan Jan Jan Jan Jan Jan Jan Jan
2014 2015 2016 2017 2018 2019 2020 2021
Source: State Street Global Advisors, Bloomberg Finance LP. Data as of February 2021.
Generic Bond 1Y 3Y 5Y 7Y 10Y 20Y 30Y
Yields (%)
US Treasuries 0.06 0.18 0.46 0.82 1.17 1.78 1.97
UK Gilts -0.06 0.01 0.08 0.24 0.48 1.01 1.07
JGB -0.13 -0.13 -0.11 -0.06 0.05 0.44 0.65
Germany -0.67 -0.74 -0.69 -0.63 -0.45 -0.21 0.01
Netherlands -0.64 -0.71 -0.66 -0.58 -0.39 -0.09 0.07
France -0.64 -0.68 -0.61 -0.48 -0.23 0.24 0.53
Italy -0.44 -0.29 -0.03 0.18 0.53 1.14 1.44
Ireland -0.61 -0.62 -0.53 -0.40 -0.14 0.10 0.46
China 2.60 2.50 2.73 2.46 2.43 — —
Source: State Street Global Advisors, Bloomberg Finance LP. Data as of February 2021.
Just as we currently see challenging valuations in equities, the same applies to DM
Government Bonds. We have negative real, if not nominal, yields pretty much across the board,
as shown by the growing sea of red in the grid above.
This is also accompanied by higher risk (as yields fall, duration automatically rises for the same
maturity bonds. Sovereigns have also been taking advantage of rock-bottom yields and flat
curves to issue further and further out). In other words, DM Government Bonds are far from
risk-free, and we think the risk they have is very poorly rewarded. They are — as much as
some sectors of the equity market — priced to perfection, and there is similarly no cushion for
any nasty surprise, however remote (for example a spike in supply, or even inflation).
So, investors need to think hard about where to get that additional yield.
The 2021 Fixed Income Outlook Where to Look, What to Do 2So, Where to Go? While we can’t point to real value in the credit space either, what we can say for sure is that
there is a lot of support for corporate bonds from central banks in the major markets, so we at
least don’t see much downside there.
We prefer Investment-Grade Corporate Credit, where the US Fed and European Central Bank
(ECB) buying programs have been effective in compressing spreads.
Ongoing Support for In 2020, proactive central bank efforts, including QE and purchase programs aimed at supporting
Credit credit market liquidity, played a major role in stabilizing and improving the trajectory of fixed
income markets. We believe that these activities will continue to be a substantial factor as we
look forward to 2021.
Support for Corporates And there’s more good news: The Fed was able to get a lot of ‘bang for the buck’ by simply
signalling its willingness to make purchases. Since the March 2020 announcement of the Fed’s
Primary and Secondary Market Corporate Credit Facility programs, spreads have tightened
dramatically, despite the very small volume of actual Fed purchases. This support has worked
more as a signal similar to Draghi’s famous ‘Whatever it takes’, effectively backstopping the
market and bringing down spreads without the need for huge capital outlay. With such big
buyers waiting in the wings we are comfortable maintaining our credit overweight.
Similarly, the ECB launched its QE and started buying credit several years ago. Over that period,
the ECB buying program has suppressed credit spreads in European markets. Investors know
that.
The tidal wave of corporate issuance in 2020 has also served to strengthen balance sheets; this,
combined with the likely support of the Fed in the event of an economic disruption translate to a
favourable outlook for Investment-Grade Credit through 2021.
Investment Grade and Both IG and HY credit are places to go for additional yield – credit is certainly well supported
High Yield Credit Make from a QE perspective – but we have a preference for IG, given that we’re later in the cycle. With
respect to HY, we’re a little more cautious given the potential risk of default.
Sense 400
350
Figure 2
300
Hedging Cost (bps)
250
EUR/USD
200
GBP/USD
150
100
50
0
Feb Feb Feb Feb Feb Feb
2016 2017 2018 2019 2020 2021
Source: State Street Global Advisors, Bloomberg Finance LP. Data as of February 2021.
When we look to credit, one favourable development for euro and sterling investors has been a
drop in the hedging costs from USD back to euros/sterling, as the interest rate differential has
collapsed, meaning that hedging dollar IG credit is attractive again for euro/sterling investors.
There’s a 75bps pickup in yield after hedging costs as can be seen in the chart, while preserving
the benefit of lower volatility from hedged investments alongside the increased sectoral and
regional diversification that international credit can offer.
The 2021 Fixed Income Outlook Where to Look, What to Do 3Need More Income and So, hopefully we’ve convinced you to move out of DM Government Bonds, and into Investment-
Can Take More Risk? Grade Credit, global and hedged back to euros/sterling. But what if you need more income and
can take more risk?
In that case, we think investors should pay attention to EMD. Within the EM complex, we think it
makes sense to consider China.
In our 2021 Global Market Outlook we said that we think the US and China are two important
economies that are going to shape 2021 from a GDP perspective. We also like China because of
its relatively low correlation with other asset classes, both for bonds and equities. So, an exposure
to China debt can offer fixed income investors a bit of diversification.
EM Local Currency Real For clients who can move up in risk, we would point out that EM local-currency real yields remain
Yields Offer Income attractive at current levels, and particularly when compared with US real yields, which from the
beginning of the year have turned quite negative, as you can see in the graph below.
Figure 3 4
Estimated 10-Year 3.49
Real Yields (%) 3
2 1.70
Eurozone
US
1
China
JPM GBI-EM Index
0
-1.04
-1
-1.63
-2
Jan Jan Jan Jan Jan Jan
2016 2017 2018 2019 2020 2021
Source: State Street Global Advisors, Bloomberg Finance LP. Data as of January 2021.
We think a permanent medical solution to the pandemic crisis could see US real yields normalize
and narrow the gap with emerging markets. This would lead to the relative outperformance of EM
bonds with the potential for a further tailwind from currency.
The 2021 Fixed Income Outlook Where to Look, What to Do 4EM Currencies Are Another force that should influence your fixed income decision-making in 2021 is the secular
Undervalued bear market that we expect to take shape for the US dollar. Those expectations were reinforced
by Biden, whose administration is likely to be both more friendly to global trade and more stable,
reducing the risk of a downward-spiralling trade war.
These benefits for global trade will translate into a disadvantage for the dollar, although
pandemic-related uncertainty and high levels of market stress have so far supported relatively
high USD valuations. Those high valuations, paired with very low yields for the currency, are
generating substantial pressure on USD to revert to fair value.
Currency is one of the main contributors of risk in local-currency bonds, and here we see that
many EM currencies seem to be quite cheap. So, we think this is a good time for investors to be
thinking about local-currency EMD and also at EM currencies as they consider their fixed income
allocation.
This potential for a bear market in the US dollar, as well as the possibility that a return to risk
would see EM currencies rally from their current steep undervaluation, together mean we think
local-currency EM debt presents a particularly attractive opportunity: from an investor’s
perspective, EMD offers yield pickup.
Figure 4 30 (%)
EM FX Fair Value vs.
EUR 20
10
0
-6
-10
-20
Jan Jan Jan Jan Jan Jan Jan Jan
2000 2003 2006 2009 2012 2015 2018 2021
Source: State Street Global Advisors, Bloomberg Finance LP. Data as of January 2021.
The 2021 Fixed Income Outlook Where to Look, What to Do 5China: Attractive Yield China real yields remain attractive relative to other major developed markets. Inclusion in major
with Positive Technicals indices translates to strong demand pull.
And within EM Debt we have seen increasing interest from clients for standalone Chinese bond
allocations. Not only are the inflation-adjusted yields far more attractive than those in the US
and eurozone, but there are structural reasons as well for their continued outperformance.
Figure 5 25 US$ Bn
Index Inclusion
Monthly Flows 20
Timeline
15
Barclays Global Agg
JPM GBI-EM GD
FTSE WGBI 10
Actual Foreign Investor
Flows ($Bn) (Rolling 6m)
5
0
Apr Dec Aug Apr Dec Sep
2019 2019 2020 2021 2021 2022
Source: Barclays, Morgan Stanley for Actual Foreign Investor Flows. Data as February 2021.
The past two years have seen a general move toward greater internationalization of the renminbi.
More capital controls are being removed, and generally we’re seeing the entrance of Chinese
bonds into various bond indexes. That trend is only likely to accelerate as time goes by.
Investors’ enthusiasm has also been bolstered by the resolute performance of China bonds
through the crisis, where they showed enviable stability in price and liquidity, especially
compared to their DM counterparts. China’s bond market also exhibits relatively low correlation
compared with other asset classes, with a risk profile that matches developed market bonds.
So Chinese fixed income assets may have much to offer investors over the next year, not just
because of the potential for yield pickup, but also because we see room for appreciation.
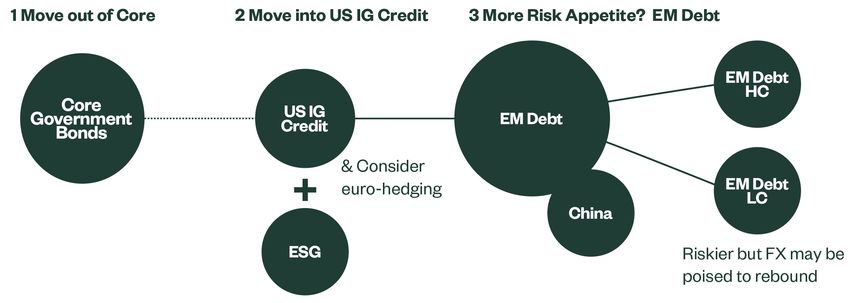
The 2021 Game Plan Clients need to move out of core Government bonds. US IG Credit is a good place to start, with
hedging back to euros now looking attractive.
For those who can move further up in risk, EM Debt has a number of things going for it from a
weaker dollar to a return to risk and structural flows. And Local Currency, we believe has the
added catalyst of FX poised to rebound. Within EM, Chinese bonds are increasingly presenting
characteristics — such as low correlation and attractive real yields — that many investors will
find persuasive.
The 2021 Fixed Income Outlook Where to Look, What to Do 6About State Street Our clients are the world’s governments, institutions and financial advisors. To help them achieve
Global Advisors their financial goals we live our guiding principles each and every day:
• Start with rigour
• Build from breadth
• Invest as stewards
• Invent the future
For four decades, these principles have helped us be the quiet power in a tumultuous investing
world. Helping millions of people secure their financial futures. This takes each of our employees
in 27 offices around the world, and a firm-wide conviction that we can always do it better. As a
result, we are the world’s third-largest asset manager with over US $3.47 trillion* under our care.
* AUM reflects approximately $75.17 billion USD (as of 31 December, 2020), with respect to which State Street Global Advisors
Funds Distributors, LLC (SSGA FD) serves as marketing agent; SSGA FD and State Street Global Advisors are affiliated.
ssga.com Please note that any such statements are not strategies, tax status or investment horizon. You The trademarks and service marks referenced
guarantees of any future performance and should consult your tax and financial advisor. herein are the property of their respective
State Street Global Advisors actual results or developments may differ owners. Third party data providers make no
Worldwide Entities materially from those projected. International government bonds and corporate warranties or representations of any kind
bonds generally have more moderate short- relating to the accuracy, completeness or
For a complete list of SSGA entities, please visit: The targets and estimates are based on certain term price fluctuations than stocks but provide timeliness of the data and have no liability for
https://www.ssga.com/us/en/institutional/ic/ assumptions and there is no guarantee that the potentially lower long-term returns. damages of any kind relating to the use of such
footer/state-street-global-advisors-worldwide- estimates will be achieved. Investing involves data.
entities risk including the risk of loss of principal. The information contained in this
Communication is not a research The whole or any part of this work may not be
Past performance is not a reliable indicator All information is from SSGA unless otherwise recommendation or investment reproduced, copied or transmitted or any of its
of future performance. Index returns are noted and has been obtained from sources research and is classified as a contents disclosed to third parties without
unmanaged and do not reflect the deduction believed to be reliable, but its accuracy is not Marketing Communication in SSGA’s express written consent
of any fees or expenses. guaranteed. There is no representation or accordance with the Markets in
warranty as to the current accuracy, reliability Financial Instruments Directive
Diversification does not ensure a profit or or completeness of, nor liability for, decisions (2014/65/EU or applicable Swiss © 2021 State Street Corporation.
guarantee against loss. based on such information and it should not be regulation. This means that this All Rights Reserved.
relied on as such. marketing communication (a) has 3450341.1.1.GBL.INST
Investing involves risk including the risk of loss not been prepared in accordance Exp. Date: 28/02/2022
of principal. The views expressed in this The information provided does not constitute with legal requirements designed to
material are subject to change based on market investment advice and it should not be relied promote the independence of
and other conditions. This document contains on as such. It does not take into account any investment research (b) is not
certain statements that may be deemed investor’s particular investment objectives, subject to any prohibition on
forward-looking statements. dealing ahead of the dissemination
of investment research.
The 2021 Fixed Income Outlook Where to Look, What to Do 7You can also read