COVID-19 Candidate Sentiment Monitor - JULY 2020 UPDATE Prepared by SEEK's Customer Insights & Strategy Team - Seek Limited

Page created by Cindy Parsons
 
CONTINUE READING
COVID-19 Candidate Sentiment Monitor - JULY 2020 UPDATE Prepared by SEEK's Customer Insights & Strategy Team - Seek Limited
COVID-19
    Candidate Sentiment Monitor

    JULY 2020 UPDATE
    Prepared by SEEK’s Customer Insights & Strategy Team

1
COVID-19 Candidate Sentiment Monitor - JULY 2020 UPDATE Prepared by SEEK's Customer Insights & Strategy Team - Seek Limited
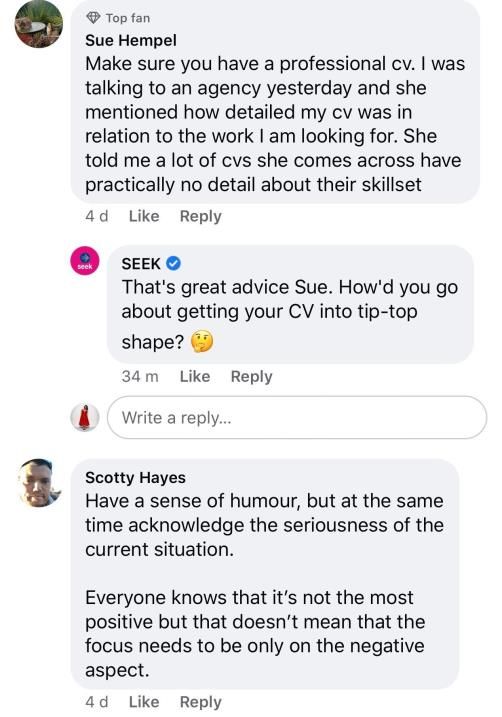
Purpose of SEEK’s COVID-19 Candidate Sentiment Monitor

                                              This report is designed to keep you connected
                                              and informed on the current candidate
                                              sentiment, in light of the COVID-19 pandemic.

                                              Note: The situation and accompanying
                                              data/metrics are changing rapidly and
                                              frequently, so please ensure you are referring
                                              to the latest version of this report
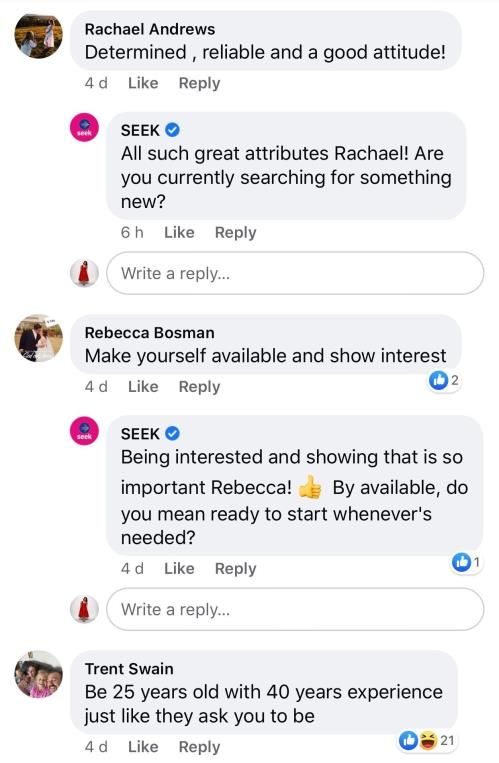
COVID-19 Candidate Sentiment Monitor - JULY 2020 UPDATE Prepared by SEEK's Customer Insights & Strategy Team - Seek Limited
3
   COVID-19 Key events

                                           11th Mar       15th Mar
                                                                                                                                                                  27th Mar             29th Mar
                                           WHO            Outdoor gatherings over   18th Mar           20th Mar
                                                                                                                        23rdMar         25thMar           26th
                                                                                                                                                          Mar     $1.1 billion package Indoor/outdoor
                                           updates        500 banned; all o/seas    Qantas stops all   Borders closed
                                                                                                                        Closure of      Mosaic brands Premier     announced to support gatherings limited
      1st Feb           3rdMar             from an        arrivals must self-       international      to all non-
                        RBA cuts                          isolate for 14 days;      flights, stands    residents and    non-essential   stands down   Investments more mental health, to 2 people with
      China                                epidemic to
                        rate to                           cruise ships barred for   down 20,000        citizens         businesses      6,800 staff   stands down Medicare and         strict exceptions
      travel ban                           a pandemic                                                                                                             domestic violence
                        0.5%                              30 days                   staff                                                             6,800 staff
                                                                                                                                                                  services

                                                          12th Mar                          19th Mar                                          25th Mar                    27th Mar
Jan 30 WHO   1st Mar              5th Mar                                                                         22nd Mar
                                                          $17.6b                            RBA interest                                      Further restrictions        Myer announces
declares     Iran travel ban      Sth Korea                                                                       $66b stimulus
                                                          stimulus                          rate cut 25pts                                    applied. Bans on indoor     10,000 staff
epidemic                          travel ban                                                                      package
                                                          package                           to 0.25%                                          gatherings extended         being stood
             26th April                                                                                           announced
                               21st April       16th April                                                                                    including funerals and      down
             Several social
                                                Crown stands      14th April                      13th April                                  weddings. Travel ban
             distancing        Virgin                                                                                                                                        31st Mar
             restrictions      Australia        down 95% of its Victoria to broaden its testing Boris Johnson tests negative for virus        introduced on Australians      Australian Government partners
             have been         enters into      workforce – over criteria for COVID-19 from today after hospital release and continues        travelling overseas            with private health sector to
                                                11,500            to anybody who has a fever or recovery, and police in Victoria spend a lot
             relaxed in WA     voluntary                                                                                                                                     secure 30,000 hospital beds
                                                employees         acute respiratory symptoms.     of time fielding calls from people “dobbing
             and QLD.          administration                                                                                                                                and 105,000 nurses and staff, to
                                                                                                  in their neighbors”                                                        battle COVID-19

                                                               14th April                           13th April                 6th April
      26th April                                                                                                                                                 4th April
                                   20th April                  The Federal government wants         The Treasury has           Government announces $1.5                                           30th Mar
      Government launches a                                                                                                                                      Prince Charles makes an
                                   Myer announces              people to switch from Netflix to     estimated that             million investment to support                                       $130 billion
      new voluntary app,                                                                                                                                         appearance on TV after
                                   rehiring of 2000 staff to   learning announcing it’s providing   unemployment could         guidance for clinicians to ensure recovering from COVID-19          JobKeeper
      COVIDSafe. There were        cater for online            funding for unemployed people to     rise to 10% in June,       they are given the best possible                                    payment
      over 1 million downloads     shopping demands            upskill/reskill via online short     lowered from 15% due to    advice on managing COVID-19                                         announced
      in the first evening                                     courses in targeted areas of         the $130b economic         patients.
                                                               national demand.                     stimulus package
COVID-19 Candidate Sentiment Monitor - JULY 2020 UPDATE Prepared by SEEK's Customer Insights & Strategy Team - Seek Limited
4
  COVID-19 Key events

                                                                                                                                                  25th May                     28th May
                                                                    12th May                                                                      Students at NSW public       News Corp’s announces closures of
                                                                                                15th May                 24th May                 schools will return to       over 100 print papers with 14 titles
                                   8thMay                           Peter Alexander, Smiggle,
  1st May                                                                                       Federal Government       Victorian Government     classrooms full-time from    to disappear completely. There are
                                   Government announces 3           Portmans to reopen
  NSW social gathering                                                                          announces additional     announces further        May 25 after weeks of remote reports this amounts to over 500 job
                                   step plan to removing            stores nationally after
  restrictions eased                                                                            $48.1mil for mental      easing of restrictions   learning                     losses.
                                   restrictions                     standing down 9000          health plan              on June 1
                                                                    workers

                                                                        14th May                           22nd May                                                          26th May
1st May                                     11th May                    Prime Minister announced that                                                   25th May
                            7thMay                                                                         Target to shut up to 75 stores                                    Victorian schools
                                                                                                                                                        Myer reopening
WA records no new cases     Apple to reopen Victoria experiences        almost 600,000 jobs have been      and convert others to Kmart,                                      begin a staggered
in 24 hours, and students                   first round of              lost, and the unemployment rate                                                 all Australian
                            Australian                                                                     putting up to 1,300 jobs at risk                                  return
return to school for term                   restrictions easing         reached 6.2%                                                                    stores
                            stores
2                                                                                                                                                                         1st June
                                  8th July                                       1st July
                                                                                                                                                                          Queensland, New South Wales,
                                  Metro Melbourne and Mitchell Shire are         Victoria sees a double digit rise in cases      18th June                                Victoria and South Australia all
                                  instructed that they will reenter stage 3      for 14 consecutive days, resulting in stage     Unemployment rate reaches 7.1            entered their next phase of easing
                                  lockdown for at least 6 weeks in               3 restrictions being reintroduced for 10        per cent, its highest level since        restrictions, with each state
                                  response to the increasing number daily        suburbs that are considered hotspots for        2001 after 227,000 jobs lost in          implementing its own rules.
                                  cases of COVID-19                              the virus                                       May

                                                                                                                                                                 3rd June
                                                         4th July                                          22nd June
    13th July                                                                                                                                                    Federal government announces $688
                                                         A further 2 postcodes in VIC                      Qantas will cut at least 6,000 jobs
    Melbourne schools return to online                                                                                                                           million HomeBuilder scheme to
                                                         are reentered into Stage 3                        across all parts of the business as part
    learning and Federal support for free                                                                                                                        support construction sector
                                                         lockdowns. Nine public                            of its long-term response to the
    childcare ends
                                                         housing towers in Melbourne                       coronavirus pandemic and will not
                                                         have been placed into                             resume substantial international travel
                                                         ‘mandatory lockdown’                              until July 2021.
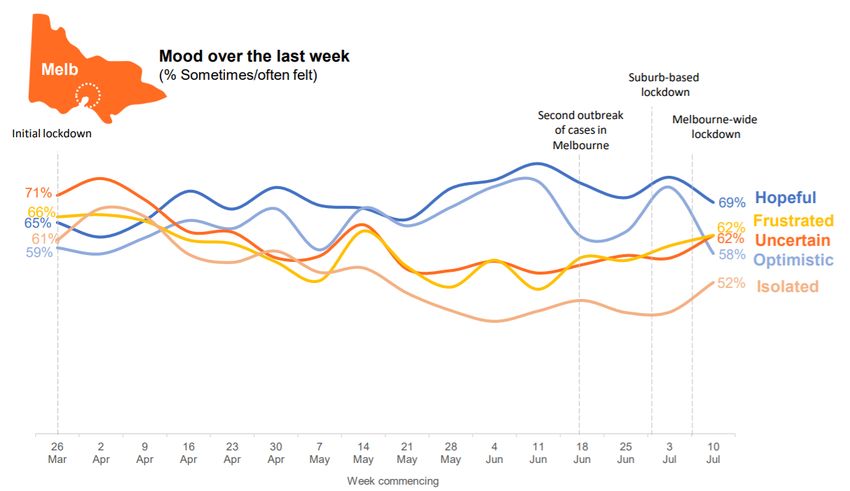
COVID-19 Candidate Sentiment Monitor - JULY 2020 UPDATE Prepared by SEEK's Customer Insights & Strategy Team - Seek Limited
5
   COVID-19 Key events
21st July                                                                           2nd August
Announcement made that from the end of September through                            Melbourne enters into stage
to January, JobKeeper payments will be extended but reduced                         4 lockdown for 6 weeks
                                                                  23rd July
to $1200 a fortnight for full-time workers. People working less                     including an overnight
                                                                  Masks become
than 20 hours a week will have their JobKeeper payment cut to                       curfew. Regional Victoria
                                                                  mandatory in
$750 a fortnight. From Jan 2021, payments will be further                           including Mitchell Shire will
                                                                  Victoria
reduced with a new end date of Mar 2021,                                            move to Stage 3 restrictions.

21st July                                                         29rd July                              4th August
The coronavirus supplement for                                    New South Wales recorded more          Vic Premier Daniel Andrews announced 3
JobSeeker recipients will drop from a                             than 150 COVID-19 cases in two         lists that will apply during Stage 4
current $550 to $250 at the end of                                weeks, a worrying sign the situation   restrictions. These changes, in addition
September, and remain at that rate until                          could spiral out of control.           to the previous restrictions, will mean
the end of the year.                                                                                     around 1 million Victorians are no longer
                                                                                                         moving around the state for work.
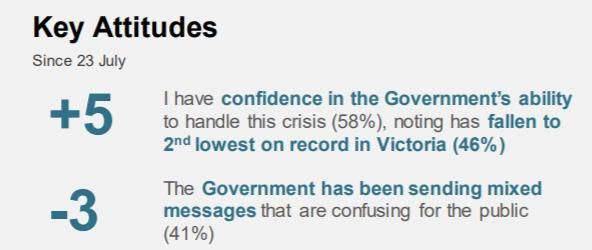
COVID-19 Candidate Sentiment Monitor - JULY 2020 UPDATE Prepared by SEEK's Customer Insights & Strategy Team - Seek Limited
6
Latest stats as at                   11th     August 2020

                          20,254,685
                              confirmed cases
                                                                                             21,397                                             14,957
                                                                                             confirmed cases in                                 confirmed cases
                                  globally
                                                                                                  Australia                                        in Victoria

                                                                                    12,134 total cases recovered

Source: Australian Government Department of Health
https://www.health.gov.au/news/health-alerts/novel-coronavirus-2019-ncov-health-alert/coronavirus-covid-19-current-situation-and-case-numbers
Updated 11th August 2020
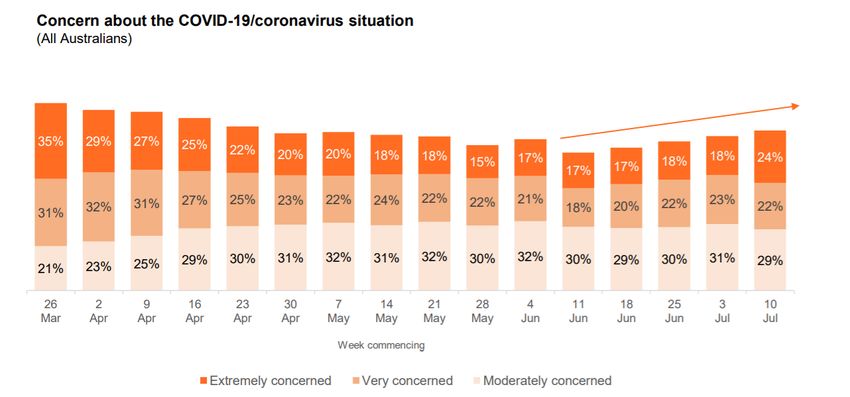
COVID-19 Candidate Sentiment Monitor - JULY 2020 UPDATE Prepared by SEEK's Customer Insights & Strategy Team - Seek Limited
7

SEEK’s COVID-19 Candidate Sentiment Monitor - key findings

     As the second wave of cases increases, we’ve seen a significant drop in
1    candidates feeling ‘in control’ of their working life, especially amongst Victorian
     and NSW workers

     Among active job seekers, confidence in finding a job reached its lowest
2    point of the year (43% in July compared to 60% in Feb).

     More than 1 in 3 candidates are hesitant to change jobs. Candidate
3    availability in key classifications are now below pre-COVID levels - Trades,
     Manufacturing & Transport, Farming, Education and Community Services

4    With job ads in professional services taking the longest to recover,
     competition for many office-based roles remain higher than pre-COVID levels.

     WFH and flexible hours will be more commonly expected. If candidates are
5    given a choice, most would want to work from home for at least one day
     per week, especially amongst those living further away from work.
COVID-19 Candidate Sentiment Monitor - JULY 2020 UPDATE Prepared by SEEK's Customer Insights & Strategy Team - Seek Limited
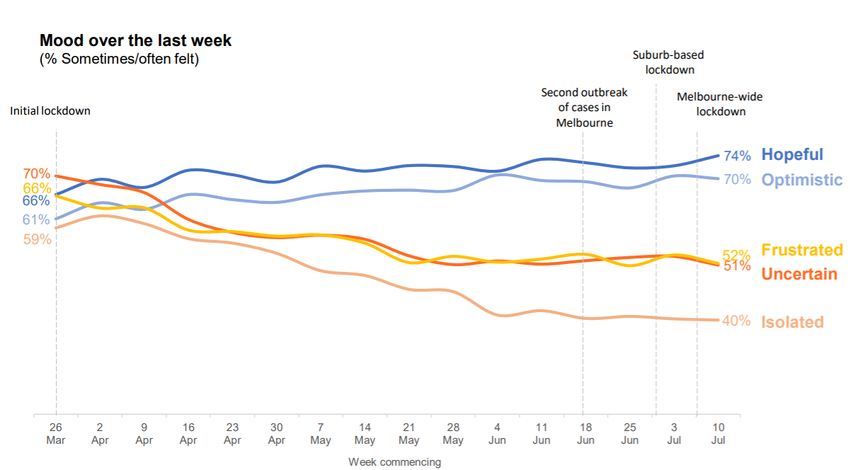
What the external
research is showing
COVID-19 Candidate Sentiment Monitor - JULY 2020 UPDATE Prepared by SEEK's Customer Insights & Strategy Team - Seek Limited
9
  What external research has been released this month….?

  Ongoing tracking of Australian sentiment towards COVID-19. 20 minute online survey from Friday 27th March–31st July, 2020. n=7,700 Australians, bi-weekly pulses
  of n=200 (Data collected Monday and Thursday, weekly)
  Concern for COVID is at a record high in Victoria as the situation continues to worsen. In NSW and QLD, concern is high but relatively stable. Nationally, confidence
  in the government is up but in Victoria confidence is hitting record lows. More Australians now support mandatory face masks, with support highest in Victoria.
  Concerns about job security also see a slight increase.

                                                                                                                   CONCERN ABOUT COVID-19

https://www.covid19brandnavigator.com/sparks
COVID-19 Candidate Sentiment Monitor - JULY 2020 UPDATE Prepared by SEEK's Customer Insights & Strategy Team - Seek Limited
10
What external research has been released this month….?

Weekly tracking of Australian sentiment towards COVID-19. 26th March – 13th July 2020. n< 23,000
At an overall level, the mood of Australians has not been as affected by the events of recent weeks. Following the announcement of a 6-
week lockdown, the mood of metro Melbourne residents resembles the peak of the crisis in March/April. National concern about the COVID-19 situation has been
building gradually over the past month.
What the SEEK
data is revealing
12
   At an overall level, candidates’ optimism with their future employment prospects remains stable. However,
   younger candidates and those from VIC & NSW have seen a decline this month.
                                                                                                                                                                                                           Sig. higher/lower than the average of other groups

                           In general, how do you feel about your future                                                                               Total            18-24             25-34              35-44            45-54               55+
                                   employment/job prospects?
                                                                                                                               % optimistic
   80                                                                                                                          Jul-20
                                                                                                                                                       60%               49%               67%                66%               52%               61%

                                                                                                                               Compared
   75                                                                                                                          Jun-20
                                                                                                                                                         1%              -16%                3%                5%                -5%               15%

   70                                                                                                                                                Total      Males        Females

   65
               62                                                                                                               % optimistic
                                                                                                                                                     60%         65%            53%
                               61                                                                               60              Jul-20
                                                                                59              59
   60                                                          58
                                                                                                                                Compared
                                               56                                                                               Jun-20
                                                                                                                                                      1%           5%           -4%

   55                                                                                                                                                                            *NT
                                                                                                                                                                                 51%
   50
                                                                                                                                                                                                                             QLD
                                                                                                                                                                                                                             60% p1%
   45

   40
                                                                                                                                                     WA
   35                                                                                                                                                63% p15%
                                                                                                                                                                                                                                       NSW
                                                                                                                                                                                                                                       55% 6%
   30
            Jan-20           Feb-20          Mar-20          Apr-20          May-20          Jun-20           Jul-20                                                                         SA*                                  VIC
                                                                                                                                                                                             79% p20%                             57% 5%
                                                    % optimistic (7-10/10)
Sig. higher▲/lowerthan the previous time
period
                                                                                                                                                                                                                               *TAS
                                                                                                                                                                                                                               64%
   QOPT. In general, how do you feel about your future employment/job prospects? Give a 7-10 rating out of 10.
   Base sizes: Jan-20 n=950; Feb-20 n=373 , Mar-20 (5th – 16th, 27th – 29th) n=1122, Apr-20 (30th Mar – 3rd May) n=708, May-20 (4th – 31st May) n=607, June-20 (1st – 28th June) n=582, Jul-20 (29th June – 2nd Aug) n=403

                                                                                                                                                                                                                        *Low sample- interpret with caution
13
   Job security fell among those younger, female and living in Victoria.

                                                                                                                                                                                                           Sig. higher/lower than the average of other groups

                            How secure do you feel your current job is?                                                                                Total            18-24             25-34              35-44            45-54               55+

                                                                                                                               % secure
   80                                                                                                                          Jul-20
                                                                                                                                                       60%               56%               58%                60%               61%               68%

                                                                                                                               Compared
   75                                                                                                                          Jun-20
                                                                                                                                                        -2%              -19%               -4%                5%                -8%               15%

   70                                                                                                                                               Total       Males        Females
               66               65                                               66▲
   65                                                                                            62
                                                                                                                               % secure
                                                                                                                  60           Jul-20
                                                                                                                                                     60%         65%            54%
   60                                                            58
                                                                                                                               Compared
                                                                                                                               Jun-20
                                                                                                                                                      -2%          2%           -7%
   55
                                               56▼
                                                                                                                                                                                             *NT
   50                                                                                                                                                                                        100%

   45                                                                                                                                                                                                                                   QLD
                                                                                                                                                                                                                                        60% 13%
   40

   35                                                                                                                                                            WA
                                                                                                                                                                 72% p5%
   30                                                                                                                                                                                                                                            NSW
             Jan-20          Feb-20          Mar-20           Apr-20          May-20           Jun-20           Jul-20                                                                                                                           60% p2%

                                                                                                                                                                                                         SA*                                 VIC
                                                     % feel secure (7-10/10)                                                                                                                             66% p4%                             55% 2%
                                                                                                                                                                                                                                           *TAS
Sig. higher▲/lowerthan the previous time period
                                                                                                                                                                                                                                           47%
   QSEC. How secure do you feel your current job is? Give a 7-10 rating out of 10
   Base sizes: Jan-20 n=950; Feb-20 n=373 , Mar-20 (5th – 16th, 27th – 29th) n=1122, Apr-20 (30th Mar – 3rd May) n=708, May-20 (4th – 31st May) n=607, June-20 (1st – 28th June) n=582, Jul-20 (29th June – 2nd Aug) n=403

                                                                                                                                                                                                                        *Low sample- interpret with caution
14
   We’ve seen a significant drop in candidates feeling ‘in control’ of their working life, especially amongst
   Victorian and NSW workers.
                                                                                                                                                                                                           Sig. higher/lower than the average of other groups

                           How ‘in control’ of your working life do you feel?                                                                         Total             18-24            25-34              35-44             45-54               55+
   80
                                                                                                                               % in control
                                                                                                                               Jul-20
                                                                                                                                                      51%               29%               53%                51%                54%               64%
   75                                                                                                                          Compared
                                                                                                                               Jun-20
                                                                                                                                                       -12%             -19%               -15%              -17%                -6%               -2%

   70
                               65                                             65▲                                                                  Total       Males        Females
               64
   65                                                                                          63
                                                               60                                                              % in control
                                                                                                                               Jul-20
                                                                                                                                                    51%         50%            51%
   60                                          59
                                                                                                                               Compared
                                                                                                                               Jun-20
                                                                                                                                                    -12%         -16%           -8%
   55
                                                                                                                51▼                                                                      *NT
   50                                                                                                                                                                                    51%

                                                                                                                                                                                                                                       QLD
   45                                                                                                                                                                                                                                  50%  7%

   40

                                                                                                                                                              WA
   35                                                                                                                                                         53% 5%
                                                                                                                                                                                                                                                NSW
   30                                                                                                                                                                                                                                           53% 13%
            Jan-20          Feb-20          Mar-20           Apr-20         May-20           Jun-20          Jul-20
                                                                                                                                                                                                        SA*                                 VIC
                                                    % in control (7-10/10)                                                                                                                              49% 17%                            48% 18%
Sig. higher▲/lowerthan the previous time
period                                                                                                                                                                                                                                   *TAS
                                                                                                                                                                                                                                         56%
   CD1. How ‘in control’ of your working life do you feel? Give a 7-10 rating out of 10
   Base sizes: Jan-20 n=1014; Feb-20 n=406 , Mar-20 (5th – 16th, 27th – 29th) n=1205, Apr-20 n=766, May-20 (4th –31st May) n=626, June-20 (1st – 28th June) n=611, Jul-20 (29th June – 2nd Aug) n=422

                                                                                                                                                                                                                         *Low sample- interpret with caution
15
   Victorians’ feeling of being in control was not impacted as much by the first wave of COVID-19. However,
   they feel significantly less in control during this second wave.
   Candidates in the other states also feel less in control of their working life in recent months

                                                                                 How ‘in control’ of your working life do you feel?

    Victoria                                                                           New South Wales                                                                       Rest of Australia*

                                                                                                                                     72
                                                                                          68         70
                                                            65                                                                                  66
      63                                                                                                                                                                                 64
                 61        62                                                                                                                                                 61                                         63
                                      60         60                                                                       61                                                                                   60                   59
                                                                                                              61                                                                                    55
                                                                                                                                                           53
                                                                                                                                                                                                                                            51

                                                                    48▼

    Jan-20 Feb-20 Mar-20 Apr-20 May-20 Jun-20 Jul-20                                    Jan-20 Feb-20 Mar-20 Apr-20 May-20 Jun-20 Jul-20                                    Jan-20 Feb-20 Mar-20 Apr-20 May-20 Jun-20 Jul-20

                            % in control (7-10/10)                                                               % in control (7-10/10)                                                              % in control (7-10/10)

Sig. higher▲/lowerthan the previous time period                                                                                                                             *Rest of Australia includes QLD, SA, NT, WA & Tas

   CD1. How ‘in control’ of your working life do you feel? Give a 7-10 rating out of 10
   Base sizes Vic: Jan-20 n=253; Feb-20 n=101 , Mar-20 (5th – 16th, 27th – 29th) n=308, Apr-20 (30th Mar – 3rd May) n=202, May-20 (4th – 31st May) n=165, June-20 (1st – 28th June) n=157 Jul-20 (29th June – 2nd Aug) n=115
   Base sizes NSW: Jan-20 n=325; Feb-20 n=131 , Mar-20 (5th – 16th, 27th – 29th) n=378, Apr-20 (30th Mar – 3rd May) n=230, May-20 (4th – 31st May) n=196 June-20 (1st – 28th June) n=199, Jul-20 (29th June – 2nd Aug) n=132
   Base sizes: Rest of Australia Jan-20 n=436 Feb-20 n=174 , Mar-20 (5th – 16th, 27th – 29th) n=519, Apr-20 (30th Mar – 3rd May) n=334 May-20 (4th – 31st May) n=264, June-20 (1st – 28th June) n=255, Jul-20 (29th June – 2nd Aug) n=175
16
   More candidates are feeling overwhelmed and uncertain about their working life.

                                                                        Generally, how does your working life make you feel?
  39%

       ▼
      28%                                                                                                                                                 28%
         27%                                                                                                                                                                 ▲
                                                                                                                                                                            25%
                    23%                                 24%
                                                                                                                                                  22%22%
                           20%        20% 20%                                               19%                                                                     19%
                        18%                                                                                                                                            19%                              18%18%
                                         17%                 ▼
                                                                                                                                                                                              16%             16%
                                                            16%15%              15%             15%16%                                                                                15%
                                                                             14%
                                                                          13%                                 13%13%14%                                                                  13%
                                                                                                                                                                                                                              11%
                                                                                                                                                                                                                    9%              9%        8%
                                                                                                                                                                                                                         7%              7%

  Confident       Encouraged          Prepared           Inspired        Reassured          Energised            Clear                            Uncertain Overwhelmed                Unclear              Bored   Hopeless        Confused
                                                  Positive Sentiment                                                                                                                 Negative Sentiment

                                                                                                    May-20                Jun-20                Jul-20

Sig. higher▲/lowerthan the previous time
period

   CD2 - Generally, how does your working life make you feel?
   Base sizes: Pre-COVID (Jan-20/Feb-20) n=1420, Mar-20 (5th – 16th, 27th – 29th) n=1205, Apr-20 n=766, May-20 (4th –31st May) n=626, June-20 (1st – 28th June) n=611, Jul-20 (29th June – 2nd Aug) n=422
17
Not surprisingly, 2 in 5 candidates in Victoria think their working circumstances are very different from
before, significantly higher than the other states

                                                                                     As a result of COVID-19, your current working situation...
                                                                                                            (July-20)

                                                                             4%                                    2%                6%           1%

                                                                            25%                                   27%                             27%
                                                                                                                                    24%
      Has gone back to 'normal'

      Has not changed                                                                                            29%▼
                                                                            42%                                                     39%
                                                                                                                                                  51%
      Is a little bit different from before

      Is very different from before                                                                              42%▲
                                                                            29%                                                     31%
                                                                                                                                                  21%

                                                                            Jul-20                                 Vic              NSW           Qld

                                                            Sig. higher▲/lowerthan the previous time
                                                            period

COVID-19 - 1 - As a result of COVID-19, your current working situation...
Base sizes: Total n=422, Vic n=115, NSW n=132, Qld n=79
18
More candidates have returned to WFH in July as venues and workplaces closed under the new
restrictions in Vic. 1 in 9 Victorian candidates claimed to have lost their jobs due to COVID.

                                                    As a result of COVID-19, which of the following have you experienced?

                                                                                                                                                                                           Mar-20      Apr-20     May-20         Jun-20     Jul-20

                                                                                                                                                          Negative outcome                  38%        42%         42%           40%        36%

                                                                                                                                                           Positive outcome                  9%        11%         10%           11%         9%

     33% 34%
                                                                                                                          “I have lost my job”
        34%        32%                                                                                                             Jul-20                                                                                                    31%
               28%                                                                                                                11%▲                                                                                                     28%
                                                                                                                                                                                                                                        27%
                                                                                                                          5%                                                                                                      25%25%
                                                                                                                                                 2%

                                  17%17%
                                                                                                                         NSW        VIC      QLD
                              15%        13%
                           13%
                                                 10%                                                                                                     9%
                                                    9% 8%                    9% 8% 9%
                                                            7% 7%       8%                             7%            7% 6%                       7% 7%        7%     7%           7% 6%
                                                                                        5%     6% 6%
                                                                                                            4% 4%            5% 4% 5%                                     5% 6%
                                                                                                                                            4%
                                                                                                                                                                                          2% 2% 2% 1% 2%     1% 1% 2% 1% 2%

     I now work from      I have reduced my I have reduced my I have increased my I have been stood                 I have lost my job    I have taken a pay           I have been      I have secured a     I have secured a      None of these
          home            hours by up to 50% hours by over 50%        hours             down                                                      cut                directed to take      new job in a    new job in the same
                                                                                                                                                                   annual leave or long different industry       industry
                                                                                                                                                                      service leave

                                                                    Mar-20 (27th - 29th Mar)            Apr-20       May-20        Jun-20             Jul-20

COVID-19_2 - As a result of COVID-19, which of the following have you experienced?
Base sizes: Mar-20 (27th – 29th) n=800, Apr-20 (30th Mar – 3rd May) n=766, May-20 (4th –31st May) n=626, June-20 (1st – 28th June) n=611, Jul-20 (29th June – 2nd Aug) n=422
19
Active job seekers are more likely to be young candidates aged 18 – 24 who are in junior level roles. 1 in 4
of them are currently unemployed.

              Active Job Seekers’ profile
            (vs. Total market)

Gender                                               Age                                                Job level                                                      States
    (54%)                (46%)
                                                                                                                                                                                 NT (0%)
                                                                                  ▲
                                                   18 to 24
                                                     (15%)
                                                                           23%                          14    %
                                                                                                                   (18%)                  Senior level                           0%                              QLD (20%)
                                                                                                                                                                                                                 13%
     Male                Female
                                                   25 to 34                      29%                    25    %
                                                                                                                   (33%)                    Mid level
                                                     (24%)

    61    %
                          39     %

                                                   35 to 44                23%                          41    %
                                                                                                                                                                                                                        NSW (31%)
                                                                                                                                          Junior level
                                                     (24%)
                                                                                                                   (33%)
                                                                                                                                                                    (12%) WA                                            34%
                                                                                                        Senior level: CEO, Senior Management,                           15%
Unemployment                                       45 to 54     14%                                    Senior Specialist / employee                                                                             VIC (25%)
                                                     (23%)                                                                                                                       (8%)   SA
   ▲
            are unemployed
                                                                                                        Mid level: Mid Management, Mid Specialist /
                                                                                                        employee                                                                        3%                       33%
  24%                                              55 to 64   10%
                                                      (15%)                                             Junior level: Entry level / graduate, Junior                                                    TAS = 2% (2%)
  (7%)                                                                                                  Specialist/ employee, Junior Management

Industry groups                                                                          Income (Current/latest)                                         Likelihood to consider moving for a job
       (31%)                 (15%)                (29%)         (33%)                     (23%)     (26%)          (25%)          (16%)                   (25%)        (16%)     (27%)       (22%)     (10%)

      37%                                                       39%
                                                                                                                                                                                             31%                   Total likely
                                                                                                                                                                                 27%
                            15%
                                                  19%▼                                   34%▲
                                                                                                     26%            20%
                                                                                                                                   13%
                                                                                                                                                           19%         15%
                                                                                                                                                                                                        8%
                                                                                                                                                                                                                    39%
                                                                                                                                                                                                                     32% total
                                                                                                                                                                                                                    candidates
 White Collar        Healthcare/call         Hospo/retail/    Trades and                          $31,200 -       $52,000 -                               Very        Some-      Neutral     Some-      Very
                    centre/community        education/sport   Resources
20
Passive candidates who are not doing anything to look for jobs skew towards 55-64 years old. They are
also more likely to be from NSW or QLD.

              Passive candidates’ profile
            (vs. Total market)

Gender                                               Age                                                Job level                                                      States
    (54%)                (46%)
                                                                                                                                                                                 NT (0%)
                                                   18 to 24
                                                     (15%)
                                                              8%                                       23    %
                                                                                                                   (18%)                  Senior level                           1%                              QLD (20%)
                                                                                                                                                                                                                 26%
     Male               Female
                                                   25 to 34                20%                          29    %
                                                                                                                   (33%)                    Mid level
                                                     (24%)

    47    %
                         53      %

                                                   35 to 44                  25%                        32    %
                                                                                                                                                                                                                        NSW (31%)
                                                                                                                                          Junior level
                                                     (24%)
                                                                                                                   (33%)
                                                                                                                                                                    (12%) WA                                            30%
                                                                                                        Senior level: CEO, Senior Management,                           11%
Unemployment                                       45 to 54                 24%                         Senior Specialist / employee                                                                             VIC (25%)
                                                     (23%)                                                                                                                       (8%)   SA
                                                                                                                                                                                                                 20%
   ▲
                                                                                                        Mid level: Mid Management, Mid Specialist /
   0%       are unemployed                                                                              employee                                                                        9%
                                                   55 to 64                 22%    ▲
                                                      (15%)                                             Junior level: Entry level / graduate, Junior                                                    TAS = 2% (2%)
  (7%)                                                                                                  Specialist/ employee, Junior Management

Industry groups                                                                          Income (Current/latest)                                         Likelihood to consider moving for a job
       (31%)                (15%)                 (29%)            (33%)                  (23%)     (26%)          (25%)          (16%)                   (25%)        (16%)     (27%)       (22%)     (10%)

                                                                   36%
     28%                                          29%                                                                                                    35%▲                                                      Total likely
                                                                                                                                                                                 27%
                           15%
                                                                                         15%▼
                                                                                                     34%
                                                                                                                    26%
                                                                                                                                   12%
                                                                                                                                                                       18%
                                                                                                                                                                                             12%▼
                                                                                                                                                                                                        7%
                                                                                                                                                                                                                    19%      

                                                                                                                                                                                                                     32% total
                                                                                                                                                                                                                    candidates
 White Collar        Healthcare/call        Hospo/retail/     Trades and                          $31,200 -       $52,000 -                               Very        Some-      Neutral     Some-      Very
                    centre/community       education/sport    Resources
21
Amongst active job seekers, confidence in finding a job reached its lowest point of the year.

                                                                         How confident are you in finding a job?
                                                                            (amongst Active Job Seekers)

                                                62
               60
                                                                                                                                                 58
                                                                                                                                                                                  55
                                                                                52                               51

                                                                                                                                                                                                                   43

             Jan-20                          Feb-20                           Mar-20                          Apr-20                           May-20                          Jun-20                            Jul-20

                                                                                                         % confident (7-10/10)
  Sig. higher▲/lowerthan the previous time
  period
E1C - How confident are you in finding a job? Give a 7-10 rating out of 10
Base sizes Total sample: Jan-20 n=150, Feb-20 n=61 , Mar-20 (5th – 16th, 27th – 29th) n=169, Apr-20 (30th Mar – 3rd May) n=198, May-20 (4th –31st May) n=154, June-20 (1st – 28th June) n=132, Jul-20 (29th June – 2nd Aug) n=107
Base sizes Females: Jan-20/Feb-20 n=92 , Mar-20 (5th – 16th, 27th – 29th) n=77, Apr-20 (30th Mar – 3rd May) n=101 May-20 (4th –31st May) n=70, June-20 (1st – 28th June) n=58, Jul-20 (29th June – 2nd Aug) n=50
Base sizes Males: Jan-20/Feb-20 n=119 , Mar-20 (5th – 16th, 27th – 29th) n=92, Apr-20 (30th Mar – 3rd May) n=97, May-20 (4th –31st May) n=83, June-20 (1st – 28th June) n=74, Jul-20 (29th June – 2nd Aug) n=57
22
   There are still close to 1 in 2 candidates who think there are ‘not enough jobs’ in the market. This
   perception has improved or remained stable in most states over the past month, except for Victoria.
                                                                                                                                                                                                       Sig. higher/lower than the average of other groups

                               Agreement to the statement                                                                                             Total             18-24             25-34         35-44             45-54               55+
                           ‘there are not enough jobs out there’
                                                                                                                               % agree 7-10
                                                                                                                               Jul-20
                                                                                                                                                       48%              46%                51%           39%                53%               53%

                                                                                                                               Compared
                                                                                                                               Jun-20
                                                                                                                                                        -2%               1%                5%           -17%                2%                0%

                                                                                                                                                    Total       Males       Females

                                                                       51                 50                                   % agree 7-
                               49                  49                                                         48               10                   48%          49%           47%
                                                                                                                               Jul-20
            43
                                                                                                                               Compared
                                                                                                                               Jun-20
                                                                                                                                                     -2%          -2%           -2%
                                                                                                                                                                                             *NT
                                                                                                                                                                                             0%

                                                                                                                                                                                                                                    QLD
                                                                                                                                                                                                                                    41% 2%

                                                                                                                                                                 WA
                                                                                                                                                                 47% 14%
                                                                                                                                                                                                                                             NSW
                                                                                                                                                                                                                                             51% 3%

         Feb-20              Mar-20              Apr-20             May-20              Jun-20              Jul-20                                                                                    SA                                 VIC
                                                                                                                                                                                                      35% 1%                            55% p 7%
                                    % agree 'there are not enough jobs out there 7-10
Sig. higher▲/lowerthan the previous time                                                                                                                                                                                             *TAS
period                                                                                                                                                                                                                                57%

   E5. 'There are just not enough jobs out there. Give a 7/9 to 10 rating out of 10
   Base sizes Total sample: Not asked in Jan-20, Feb-20 n=406 , Mar-20 (5th – 16th, 27th – 29th) n=1205, Apr-20 (30th Mar – 3rd May) n=766, May-20 (4th –31st May) n=626, June-20 (1st – 28th June)
   n=611, Jul-20 (29th June – 2nd Aug) n=422
                                                                                                                                                                                                                  *Low sample- interpret with caution
23
Over the last 2 months, we see more professional services workers perceive that there are not enough
jobs in the market.

                                                 Agreement to the statement
                                             ‘there are not enough jobs out there’                                                                                                    (% agree 7-10/10)

                                                                                                                              51                                  50
                                                       49                                 49                                                                                                         48
                   43                                                                                                                                             51                                 50
                                                       47

                                                                                          39                                  40

                   30

                 Feb-20                             Mar-20                              Apr-20                             May-20                              Jun-20                              Jul-20

                                                                              Total candidates                  Professional Services workers*

 *Those who work in Account, Human Resources & Recruitment, Marketing & Communications, Banking & Financial Services, Legal, Science & Technology,
 Consulting & Strategy, Information & Communication Technology and Insurance & Superannuation

E5. 'There are just not enough jobs out there. Give a 7/9 to 10 rating out of 10
Base sizes Total sample: Jan-20 n=1014, Feb-20 n=406 , Mar-20 (5th – 16th, 27th – 29th) n=1205, Apr-20 (30th Mar – 3rd May) n=766, May-20 (4th –31st May) n=626, June-20 (1st – 28th June) n=611, Jul-20 (29th June – 2nd Aug) n=422
Base sizes Professional Services: Jan-20 n=190, Feb-20 n=71 , Mar-20 (5th – 16th, 27th – 29th) n=242, Apr-20 (30th Mar – 3rd May) n=153, May-20 (4th –31st May) n=145, June-20 (1st – 28th June) n=119, Jul-20 (29th June – 2nd Aug) n=85
24
Sentiment about going back to the workplace is led with uncertainty and anxiety.

                                                       Feelings about going back to the workplace (amongst those who are WFH)

                                                          Uncertain                                                          31%

                                                            Anxious                                                      30%

                                                            Hopeful                                                    27%

                                                          Optimistic                                             24%

                                                           Prepared                                              24%

                                                             Excited                                       21%
                                                                                                                               Significantly higher amongst females (31%▲)
                                                            Worried                                       20%

                                                          Confident                                      19%

                                                                 Sad                               15%
                                                                                                                                                   Total       Males         Females

                                                          Energised                          12%                             Positive Sentiment    62%         69%▲          53%▼

                                                          Confused                6%                                         Negative Sentiment    58%         49%▼          71%▲

A10. Which of these following words best describes how you feel about going back to your workplace?
Base: Those who are working from home n=203
25
If candidates are given a choice, most would want to work from home for at least one day per week,
especially amongst those living further away from work.

                 If you had the choice now, how many days would you like to ideally work from home (even once restrictions on COVID-19 are lifted)?
                                                Total         Travel within 30 mins to work (one-way)              Travel more than 30 mins to work (one-way)

                      27%▲                                                    28%

                                                                  23%
                21%                                                     21%
                                                                                                     18%▲                                   18% 18%
                          15%▼                                                             14%                                                           15%
                                                                                                                                                                                      13%
                                                                                                 11%▼                                                                           11%
                                                     9%                                                                         8%▲
                                          7%                                                                                                                                                7%
                                               6%                                                                    5%
                                                                                                                          4%▼

                      None              1 day per week           2 days per week          3 days per week          4 days per week        5 days or more per                  Don’t know/unsure
                                                                                                                                                week

                                                                                      At least one day per week
                                                                                           60%▼ vs 78%▲

A12. If you had the choice now, how many days would you like to ideally work from home (even once restrictions on COVID-19 are lifted)?              Sig. difference at 95%
                                                                                                                                                confidence between groups
Base: Total n=611, those who travel within 30 mins n=337, those who travel for more than 30 minutes n=245
26

      Candidates will be more nervous about changing jobs, especially amongst those
      who have experienced significant changes due to COVID-19
      Office workers are less inclined to change jobs in the near future, whereas more movements will be seen amongst candidates who work in
      sport, hospitality, retail and education

                                    Attitudes toward changing jobs

                                                                                                           Total Disagree                       Total Agree
                                                                                                           (Disagree or strongly disagree)      (Agree or strongly agree)

                                          I will be more nervous about changing jobs                                            21%                       46%

                                                                                                                                                                                 Significantly higher amongst
                                                                                                                                                                                 those whose working situation
                                                                                                                                                                                 is very different from before
                                                                                                                                                                                 due to COVID-19 (54%▲)
                                          I’m less inclined to change jobs in the near                                        25%                    36%
                                          future
                                                                                                                                                                            Significantly higher amongst
                                                                                                                                                                            white collar (49%▲)

                                          I intend to change jobs once COVID-19
                                          restrictions are eased and the market                                        38%                       29%
                                          goes back to normal
                                                                                                                                                                      Significantly higher amongst
                                                                                                                                                                      workers in hospo/retail/education/
                                                                                                                                                                      sport industry (42%▲)
A13. Now imagine all restrictions on COVID-19 have been lifted and everyone has gone back to the workplace. To what extent would you agree or disagree with the
following statements? Base: Total n=611                                                                                                                                     Sig. difference at 95%
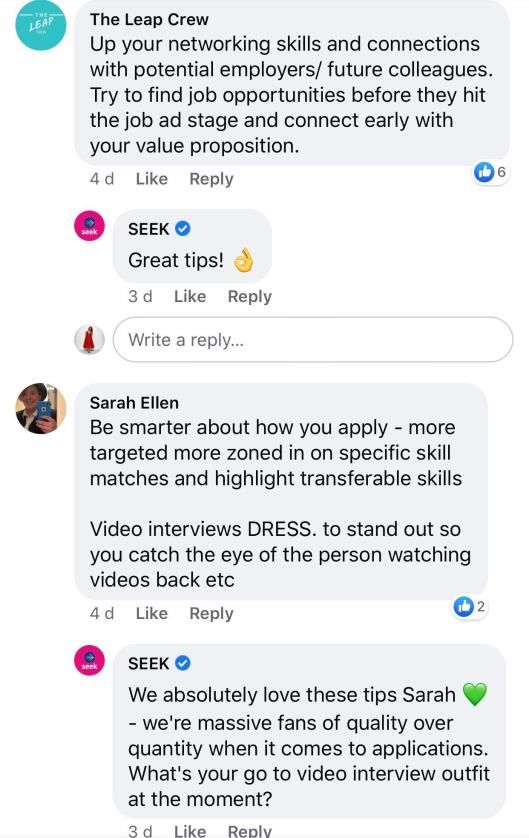
                                                                                                                                                                    confidence between groups
27
Social Activity: Candidates are realising the importance of needing to stand out in a crowd and
have some great ideas on how to do this.
28

Thank you.
You can also read