The Unprecedented Stock Market Reaction to COVID-19 - Scott R. Baker, Nicholas Bloom, Steven J. Davis, Kyle Kost, Marco Sammon, and Tasaneeya ...
←
→
Page content transcription
If your browser does not render page correctly, please read the page content below
WHITE PAPER

The Unprecedented Stock
Market Reaction to COVID-19
Scott R. Baker, Nicholas Bloom, Steven J. Davis, Kyle Kost, Marco Sammon, and Tasaneeya Viratyosin
MARCH 2020

                                                                                   5757 S. University Ave.
                                                                                       Chicago, IL 60637
                                                                                      Main: 773.702.5599
                                                                                        bfi.uchicago.edu
The Unprecedented Stock Market Reaction to COVID-19
Scott R. Baker, Nicholas Bloom, Steven J. Davis, Kyle Kost, Marco Sammon, and Tasaneeya Viratyosin
                                           30 March 2020

Abstract. No previous infectious disease outbreak, including the Spanish Flu, has impacted the
stock market as powerfully as the COVID-19 pandemic. We use text-based methods to develop
this point with respect to large daily stock market moves back to 1900 and with respect to overall
stock market volatility back to 1985. We also argue that policy responses to the COVID-19
pandemic provide the most compelling explanation for its unprecedented stock market impact.

       As the Novel Coronavirus (COVID-19) spread from a regional crisis in China’s Hubei
Province to a global pandemic, equities plummeted and market volatility rocketed upwards
around the world. In the United States, recent volatility levels rival or surpass those last seen in
October 1987 and December 2008 and, before that, in late 1929 and the early 1930s (Figure 1).
Motivated by these observations, we consider the role of COVID-19 developments in recent
stock market behavior and draw comparisons to previous infectious disease outbreaks.

       To quantify the role of news about infectious disease outbreaks, we use automated and
human readings of newspaper articles. Looking back to 1985, we find no other infectious disease
outbreak that had more than a tiny effect on U.S. stock market volatility. Looking back to 1900,
we find not a single instance in which contemporary newspaper accounts attributed a large daily
market move to pandemic-related developments. That includes the Spanish Flu of 1918-20,
which killed an estimated 2.0 percent of the world’s population (Barro, Ursua and Weng, 2020).
In striking contrast, news related to COVID-19 developments is overwhelmingly the dominant
driver of large daily U.S. stock market moves since 24 February 2020.

Characterizing Daily Stock Market Jumps

       In Baker, Bloom, Davis and Sammon (2019), we examine next-day newspaper
explanations for each daily move in the U.S. stock market greater than 2.5 percent, up or down.
By this criterion, there were 1,129 stock market jumps from 2 January 1900 to 24 March 2020.
Jump days account for 3.5% of all trading days and 47% of total squared daily return variation.

                                                                                                       1
To characterize these jumps, we read the lead article about each jump in next-day (or
same-evening) newspapers to classify the journalist’s explanation into one of 16 categories,
which include Macroeconomic News and Outlook, Government Spending, Monetary Policy,
Unknown or No Explanation Offered, and Other – Specify. Our coding guide in Baker, Bloom,
Davis and Sammon (2018) describes the methodology in detail.
Table 1 draws on our classification effort to underscore the unprecedented impact of the
COVID-19 pandemic on the U.S. stock market. In the period before 24 February 2020 –
spanning 120 years and more than 1,100 jumps – contemporary journalistic accounts attributed
not a single daily stock market jump to infectious disease outbreaks or policy responses to such
outbreaks.1 Perhaps surprisingly, even the Spanish Flu fails to register in next-day journalistic
explanations for large daily stock market moves.
Data for the past month tell a dramatically different story. From 24 February to 24 March
2020, there were 22 trading days and 18 market jumps – more than any other period in history
with the same number of trading days. Jump frequency during this period is 23 times the average
pace since 1900. Moreover, next-day newspaper accounts attribute 15 or 16 of the 18 jumps to
news about COVID-19 developments and policy responses to the pandemic.2 In short, no
previous infectious disease episode led to daily stock market swings that even remotely resemble
the response in the past month to COVID-19 developments.
Quantifying the Contribution of COVID-19 to U.S. Stock Market Volatility
As in Baker, Bloom, Davis, and Kost (2019), we use a mechanized approach to quantify
the role of COVID-19 and other infectious diseases in U.S. stock market volatility. In a first step,
BBDK calculate the monthly fraction of articles in 11 major US newspapers that contain (a)
terms related to the economy, (b) terms related to equity markets, and (c) terms related to market
volatility. We multiplicatively rescale this monthly series to match the mean value of the VIX
1 Originally, we did not record whether journalistic accounts attributed specific jumps to policy responses to
infectious disease outbreaks. After the COVID-19 pandemic, we reread lead newspaper articles about stock market
jumps from January 1918 to December 1920. There were 32 jumps during these years, 23 from March 1918 to June
1920. None attributed a jump to policy responses to the Spanish Flu pandemic.
2 The New York Times offered no clear explanation for the downward jump on 20 March, while the Wall Street
Journal attributed it to pandemic-related policy responses. Both papers attributed the upward jump on 4 March to
Elections and Political Transitions (i.e., Biden’s strong showing in primary elections) and the downward jump on 9
March 2020 to Commodity Markets. Both papers attributed all other jumps since 24 February to COVID-19
developments or policy responses thereto.
2since 1985. Figure 2 plots our resulting newspaper-based Equity Market Volatility (EMV)
tracker alongside the VIX itself. As the figure shows, our EMV tracker performs well in the
sense of mirroring the time-series behavior of implied stock market volatility. The same is true
with respect to realized stock market volatility.
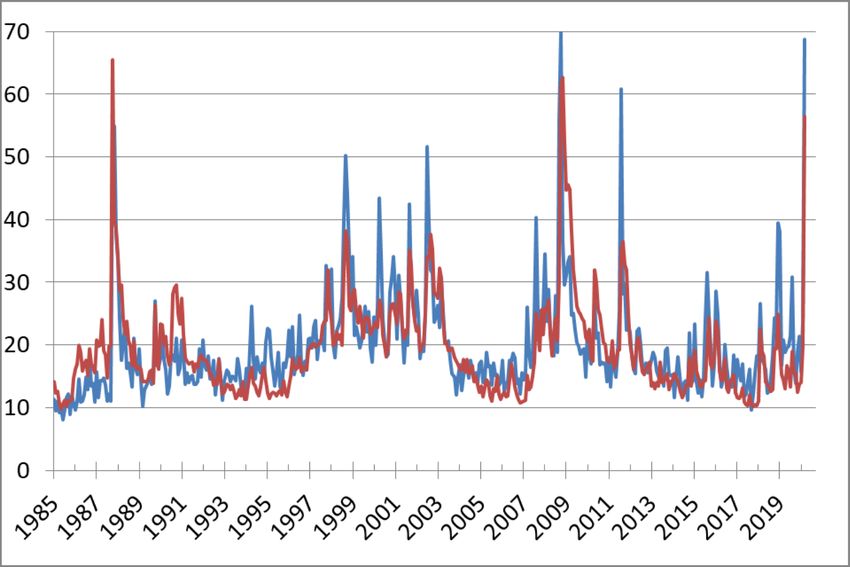
In a second step, we identify the subset of EMV articles that contain one or more terms
related to COVID-19 or other infectious diseases. Specifically, we flag EMV articles that
mention one of the following terms: epidemic, pandemic, virus, flu, disease, coronavirus, MERS,
SARS, Ebola, H5N1, or H1N1. Multiplying the fraction of EMV articles that contain one of
these terms by our EMV tracker yields our Infectious Disease EMV tracker displayed in Figure
3. The inset portion of Figure 3 displays the results of the same quantification exercise at a
weekly frequency.
Figure 3 establishes three points. First, before the COVID-19 pandemic, no infectious
disease outbreak made a sizable contribution to U.S. stock market volatility. The 2003 SARS
epidemic and the 2015 Ebola epidemic led to modest, short-lived spikes in volatility, and the
Bird Flu and Swine Flu epidemics barely registered. Second, the COVID-19 pandemic drove the
tremendous surge in stock market volatility since late February. Recall from Figure 1 that this
surge led to the third highest realized volatility peak since 1900. So, the volatility peak is
extraordinarily high by historical standards (Figure 1), and it’s almost entirely triggered by
COVID-19 developments, including policy responses to the pandemic. Third, the COVID-19
volatility surge took off in the fourth week of February 2020.
Table 2 provides more information about newspaper coverage of various infectious
disease outbreaks since 1985. For each episode, we report the mean value of our Infectious
Disease EMV tracker, the fraction of EMV articles that contains one of our infectious disease
terms (as listed above), and the fraction of articles about Economic Policy Uncertainty (EPU)
that contains one of those terms. Here, we use the EPU index developed by Baker, Bloom and
Davis (2016). The bottom row shows averages for the full period from January 1985 to March
2020.
By these metrics, the early-phase impact of COVID-19 looks similar to the impact of
other infectious disease outbreaks in the past 35 years. In January 2020, for example, the
Infectious Disease EMV tracker is only modestly elevated, and the percent of EMV and EPU
3articles that discuss COVID-19 developments is roughly in line with previous experiences during
the SARS and Ebola epidemics. By February, however, COVID-19 developments began to
dominate newspaper coverage of stock market volatility and figure prominently in newspaper
discussions of economic policy uncertainty. By March, COVID-19 developments receive
attention in more than 90% of all newspaper discussions of market volatility and policy
uncertainty. These data confirm the unprecedented impact of the COVID-19 pandemic.
Why Such a Powerful Stock Market Impact?
Why have COVID-19 developments exerted such powerful effects on the stock market
since late February? Clearly, the current pandemic has grave implications for public health and
for the economy. So, part of the answer surely lies in the severity of the pandemic, the apparent
ease with which COVID-19 spreads, and the non-negligible mortality rate among those who
contract the virus. Still, we think this answer is highly incomplete. Like Barro, Ursua and Weng
(2020), we regard the mortality rates experienced during the Spanish Flu as a worst-case upper
bound on the potential mortality induced by COVID-19. Yet, as Table 1 shows, the Spanish Flu
did not trigger even a small number of daily stock market jumps.
A second potential answer, particularly in comparison to the Spanish Flu, is that
information about pandemics is richer and diffuses much more rapidly now than a century
earlier.3 According to this explanation, the stock market impact of the COVID-19 pandemic is
more temporally concentrated and more likely to trigger daily stock market jumps and high stock
market volatility than Spanish Flu developments a century earlier. Here as well, there may be
something to this explanation, but it is also highly incomplete. As Velde (2020) discusses, the
negative stock market impact of the Spanish Flu was fairly modest even over time spans of
several months. Hence, explanations that stress greater information availability and its more
rapid diffusion do not take us very far in rationalizing the huge stock market drop since 24
February.
A third explanation stresses the interconnectedness of the modern economy: the
commonplace nature of long-distance travel and, in Europe, cross-border commuting; decades of
falling communication costs, falling transport costs and, until recently, falling tariffs; dense,
3As a related point, the first wave of the Spanish Flu occurred during World War I when news about the true extent
of the outbreak was censored (Honigsbaum, 2013).
4geographically expansive supply chains; and the ubiquity of just-in-time inventory systems,
which are highly vulnerable to supply disruptions.4 In addition, the structure of the economy has
shifted over time to services, many of which involve face-to-face interactions. An abrupt uptake
of voluntary and compulsory social distancing practices brings a sharp drop in demand for such
services. Again, there is merit in this explanation, but it also strikes us as insufficient on its own
to explain the stock market reaction.
That brings us to behavioral and policy reactions to the COVID-19 pandemic. As
Baldwin (2020) puts it, “COVID-19 and the containment policies have directly and massively
reduced the flow of labour to businesses. The result has been a sudden and massive reduction in
the output of goods and services.” Voluntary adoption of social distancing practices has also
played a significant role. Current containment efforts are much more extensive and widespread
than similar efforts in the past, including during the Spanish Flu. They also have more potent
effects in the modern economy for reasons sketched above. In our view, the policy response to
the COVID-19 pandemic provides the most compelling explanation for its unprecedented impact
on the stock market. Oddly enough, this somewhat mirrors the impact of COVID-19 in more
severe cases, where an autoimmune response generates a cytokine storm, damaging lung tissue
(Shi et al., 2020)
The healthcare rationale for travel restrictions, social distancing mandates, and other
containment policies is clear. These policies also bring great economic damage. Recent stock
market behavior is an early and visible reflection of the (expected) damage. There is an urgent
need to address the health crisis created by COVID-19 while shifting to less sweeping
containment policies that do not strangle the economy, as argued by Cochrane (2020),
Dewatripont et al. (2020), Ichino et al. (2020) and Monras (2020), among others.
4On supply chains, see Baldwin and Tomiura (2020); on cross-border commuting, see Meninno and Wolf (2020),
on falling trade costs, see Jacks, Meissner and Novy (2011).
5References
Baker, Scott, Nicholas Bloom and Steven J. Davis, 2016. “Measuring Economic Policy
Uncertainty,” Quarterly Journal of Economics, November.
Baker, Scott Baker, Nicholas Bloom, Steven J. Davis and Kyle Kost, 2019. “Policy News and
Equity Market Volatility,” NBER working paper.
Baker, Scott Baker, Nicholas Bloom, Steven J. Davis and Marco Sammon, 2018. Coding Large
Daily Financial Market Moves: Data Construction Guide. Available at
https://stockmarketjumps.com/files/coding_guide_pdf.pdf.
Baker, Scott Baker, Nicholas Bloom, Steven J. Davis and Marco Sammon, 2019. “What Triggers
Stock Market Jumps?” working paper.
Baldwin, Richard, 2020. “The Supply Side Matters: Guns versus Butter, COVID-Style,” VOX
CEPR Policy Portal, 22 March.
Baldwin, Richard and Eiichi Tomiura, 2020. “Thinking Ahead about the Trade Impact of
COVID-19,” in Economics in the Time of COVID-19, edited by Richard Baldwin and
Beatrice Weder di Mauro. CEPR Press.
Barro, Robert J., Jose F. Ursua and Joanna Weng, 2020. “The Coronovirus and the Great
Influenza Pandemic – Lessons from the ‘Spanish Flu’ for the Coronavirus’s Potential
Effects on Mortality and Economic Activity,” CESifo Working Paper No. 8166.
Cochrane, John H., 2020. “Flatten the Coronavirus Curve at a Lower Costs,” Wall Street
Journal, 25 March.
Dewatripont, Mathias, Michel Goldman, Eric Muraille and Jean-Philippe Platteau, 2020.
“Rapidly Identifying Workers Who Are Immune to COVID-19 and Virus-Free Is a
Priority for Restarting the Economy,” VOX CEPR Policy Portal, 23 March.
Honigsbaum, Mark. "Regulating the 1918–19 pandemic: Flu, stoicism and the Northcliffe
press." Medical history 57.2 (2013): 165-185.
Ichino, Andreas, Giacomo Calzolari, Andrea Mattozzi, Aldo Rustichini, Giulio Zanella, and
Massimo Arnelli, 2020. “Transtion Steps to Stop COVID-19 without Killing the World
Economy,” VOX CEPR Policy Portal, 25 March.
Jacks, David S., Christopher M. Meissner and Dennis Novy, 2011. “Trade Booms, Trade Busts,
and Trade Costs,” Journal of International Economics, 83, no. 2 (March).
6Meninno, Raffaella and Guntram Wolff, 2020. “As Coronavirus Spreads, Can the EU Afford to
Close Its Borders?” in Economics in the Time of COVID-19, edited by Richard Baldwin
and Beatrice Weder di Mauro. CEPR Press.
Monras, Joan, 2020. “Some Thoughts on COVID-19 from a Labour Mobility Perspective: From
‘red-zoning’ to ‘green-zoning’,” VOX CEPR Policy Portal, 25 March.
Shi, Yufang, Ying Wang, Changshun Shao et al., 2020. “COVID-19 Infection: The Perspectives
on Immune responses,” Cell Death & Differentiation. https://doi.org/10.1038/s41418-
020-0530-3.
Velde, Francois, 2020. “The Economy and Policy in the Coronavirus Crisis to Date,”
presentation at a panel session for the the Brookings Papers on Economics Activity, 20
March. Available at https://www.brookings.edu/blog/up-front/2020/03/20/the-economy-
and-policy-in-the-coronavirus-crisis-to-date/.
7Figure 1. Realized U.S. Stock Market Volatility,
January 1900 to March 2020
Volatility Last Two Weeks
Black
0.08 Monday
10/1987
0.07 Great Crash Coronavirus
10-11/1929 Great Pandemic
0.06 Global
Depression Financial 3/2020
0.05 3/1933 Crisis
12/2008
0.04
0.03
0.02
0.01
0
2-Jan-00
1-Jan-24
1-Jan-30
1-Jan-60
1-Jan-66
1-Jan-96
1-Jan-02
1-Jan-06
1-Jan-12
1-Jan-18
1-Jan-36
1-Jan-42
1-Jan-48
1-Jan-54
1-Jan-72
1-Jan-78
1-Jan-84
1-Jan-90
1-Jan-08
1-Jan-14
1-Jan-20
Notes: Sample period, 1/1/1900-3/23/2020. From 12/1925-Present, returns are computed using
Yahoo Finance’s ‘adjusted close’ series for the S&P 500 (^GSPC). Before that, returns are from the
Global Financial Data extension of the Dow Jones Index. Volatility last two weeks is the sum of
squared returns over the past 10 trading days. 8Table 1. The Unprecedented Stock
Market Impact of the Coronavirus
Number of Daily U.S. Number Attributed to Number Attributed
Stock Market Jumps Economic Fallout to Policy Responses
Greater than |2.5%| of Pandemics to Pandemics
2 January 1900 to
21 February 2020 1,116 0 0
24 February 2020
to 24 March 2020 18 7.4 8
Note: Tabulated from results in Baker, Bloom, Davis and Sammon (2020), who consider
all daily jumps in the U.S. stock market greater than 2.5%, up or down, since 1900. They
classify the reason for each jump into 16 categories based on human readings of next-
day (or same-evening) accounts in the Wall Street Journal (and New York Times in
2020). Fractional counts arise when newspapers differ in their jump attribution or
human readers differ in their classification of the attribution. Number Attributed to
Economic Fallout of Pandemics includes jumps on 3/12 and 3/16 that a subset of coders
classified as Macroeconomic Outlook. It’s clear from reading these articles that the
journalist regarded the deterioration in the Macroeconomic Outlook as due to the
spread of the coronavirus. 9Figure 2. Newspaper-Based Equity Market Volatility Tracker
and the 30-Day VIX, January 1985 to March 2020
VIX
EMV
Notes: The Equity Market Volatility Tracker reflects the frequency of articles about stock market
volatility in leading U.S. newspapers, as quantified by Baker, Bloom, Davis and Kost (2019). The 30-Day
VIX is constructed as the monthly average of daily closing VIX values collected from Yahoo Finance.10
March 2020 reflects data through March 20 . thFigure 3. Infectious Disease EMV Index, Weekly
and Monthly Data from 1985 to March 2020
Coronavirus
Weekly from Week 1 of December 2019 (COVID-19)
Bird Flu Swine Flu
SARS MERS/Ebola
(H5N1) (H1N1)
Notes: The Infectious Disease EMV Tracker is computed as the overall EMV tracker value multiplied
by the share of EMV Articles that contain one or more of the following terms: epidemic, pandemic,
virus, flu, disease, coronavirus, mers, sars, ebola., H5N1, H1N1. March 2020 data includes through11
March 20th.Table 2. Stock Market Volatility in
Selected Infectious Disease Episodes
Average Values for the Indicated Time Period
Time Period (1) Infectious (2) % of EMV Articles (3) % of EPU Articles
Disease EMV with Infectious with Infectious
Tracker Level Disease Terms Disease Terms
Bird Flu (H5N1) Nov-1997 to Nov- 1.36 4.52 8.00
1998
SARS April-August 2003 1.75 8.10 9.79
Swine Flu (H1N1) March-May 2009 0.99 3.60 4.58
Ebola & MERS Oct-2014 to Jan-2015 2.06 10.62 12.80
Coronavirus December 2019 0.79 3.68 6.42
(Covid-19) January 2020 2.11 13.45 7.43
February 2020 15.54 65.73 32.62
March 2020 60.46 90.81 92.41
Full Period Jan 1985-Mar 2020 0.76 3.37 5.67
Notes: The Infectious Disease term set is {epidemic, pandemic, virus, flu, disease, coronavirus, mers, sars,
ebola, H5N1, H1N1}. We use the following newspapers in the analysis: Wall Street Journal, NY Times,
Chicago Tribune, Washington Post, LA Times, Boston Globe, Miami Herald, USA Today, SF Chronicle, Dallas
Morning News, and Houston Chronicle. We selected periods with relatively high levels of our Infectious
Disease EMV tracker and labelled the time periods based on the prevalence of specific terms (e.g., SARS)
in the EMV articles. Both “Ebola” and “MERS” appear in EMV articles from October 2014 to January 2015,
but references to “Ebola” are much more frequent. March 2020 data includes through March 20th. 12You can also read