The Effect of Temperature Upon Transmission Of COVID-19 : Australia And Egypt Case Study
←
→
Page content transcription
If your browser does not render page correctly, please read the page content below
The Effect of Temperature Upon Transmission
Of COVID-19 : Australia And Egypt Case Study
Adly Anis ( adlyanis@cu.edu.eg )
Research
Keywords: COVID-19, Transmission, Air Temperature, Australia ,Egypt
DOI: https://doi.org/10.21203/rs.3.rs-28360/v1
License: This work is licensed under a Creative Commons Attribution 4.0 International License.
Read Full License
Page 1/17
Abstract
Background: Several previous studies have recognized the effect of air temperature on the survival and
transmission of viruses and germs. The current study investigated the effect of air temperature on the
transmission of coronavirus covid-19 by monthly temperature averages maps analyzing.

Methods: The study demonstrated the relationship between temperature and transmission speed of
Covid-19 virus, It con rmed that the most appropriate average temperature for virus activity and
transmission ranges between 13-24 ° C, by analyzing the maps of monthly temperature averages in Egypt
and Australia.

Results: The study reached, through cartographic analysis, to con rm the relationship between
temperature and increase in the number of con rmed cases of covid-19, This study con rmed that the
most appropriate average temperature for virus activity and transmission ranges between 13-24 ° C, by
analyzing the maps of monthly temperature averages in Egypt and Australia.

Conclusions: Results support that the most appropriate average temperature for the survival transmission
of COVID-19 ranges between 13-24 ° C. Australia and Egypt are models to con rm the relationship
between temperature and COVID-19 activity and spread.

Background:
Several previous studies indicated that there is a relationship between climate and the spread of certain
types of germs, and viruses that cause diseases, and this is especially true for malaria, which only
spreads under certain weather conditions in terms of temperature and humidity. There is no doubt that
there are a large number of diseases, the spread of which is associated with certain seasons. It was also
noticed that the common u increases in cold shows than in hot tropical shows(). Also, Oliver notes that
most of the deaths that occurred in England and Wales due to heart disease and respiratory disease
occurred in the winter months between November and March.()

A severe respiratory disease was recently reported in Wuhan, Hubei province, China. As of 25 January
2020, at least 1,975 cases had been reported since the rst patient was hospitalized on 12 December
2019, Epidemiological investigations have suggested that th e outbreak was associated with a seafood
market in Wuhan. Phylogenetic analysis of the complete viral genome revealed that the virus was most
closely related (89.1% nucleotide similarity) to a group of SARS-like coronaviruses (genus Beta
coronavirus, subgenus Sarbecovirus) that had previously been found in bats in China. The sequences are
almost identical and share 79.6% sequence identity to SARS-CoV. Furthermore, Researchers show that
2019-nCoV is 96% identical at the whole-genome level to a bat coronavirus. This outbreak highlights the
ongoing ability of viral spill-over from animals to cause severe disease in humans.().It appears that most
of the early cases had contact history with the original seafood market.()

                                                 Page 2/17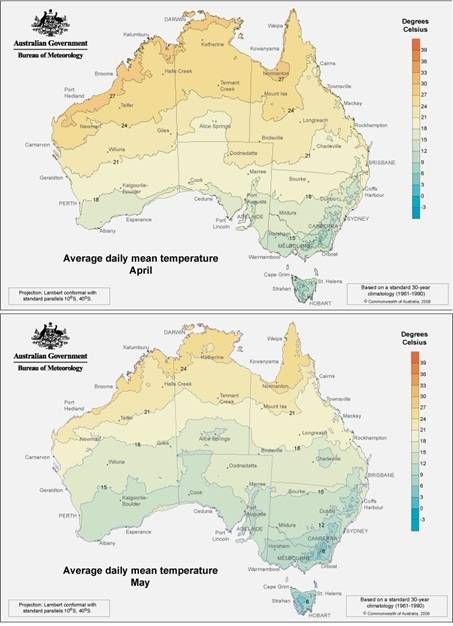
There is a relationship between air humidity and the life of bacteria and viruses. The in uenza virus dies
more quickly in conditions of high humidity accompanied by fast moving air, so the winter months in
which humidity decreases and the speed of air movement decreases are more appropriate for the spread
of respiratory infections(). It was also found that the TB germ, if exposed to sunlight, stops its activity
within one hour. Whereas in the normal light, it remains active between 6–24 hours, and in the dark, it
lives in a state of activity between two and eighteen months, so chest diseases hospitals must be
established in sunny areas. (1)

Compared to the 2002/2003 SARS-CoV and the 2012–2014 MERS-CoV (Middle East Respiratory
Syndrome-related coronavirus), the COVID-19 coronavirus spread strikingly fast. While MERS took about
two and a half years to infect 1000 people, and SARS took roughly 4 months, the novel SARS-CoV-2
reached that gure in just 48 days. On 30 January 2020, the World Health Organization (WHO) declared
that the new SARS-CoV-2 coronavirus outbreak constitutes a Public Health Emergency of International
Concern (PHEIC) (). As of 2 March 2020, more than 89,000 COVID-19 cases have been reported globally,
from all provinces of China and 66 countries globally. Global outbreaks of COVID-19 have posed major
obstacles to public health and the world economy(). As of 30 Mars 2020 720,000 cases had been
reported globally including 177 countries about 34,000 of them died ().An increase of 631,000 cases over
28 days, with an average of about 22550 cases per day.

Multiple countries have con rmed travel-associated cases, including Australia, Cambodia, Canada,
France, Germany, Japan, Nepal, Singapore, South Korea, Taiwan, Thailand, United Arab Emirates, United
States, and Vietnam. Vietnam identi ed the rst human-to-human transmission outside China()..As of 30
Mars 2020 The highest cases were recorded in United States of America, Italy, and china.

(Jin Bu et al) nd that the suitable temperature range for 2019-nCoV survival is (13–24 °C), among which
19 °C lasting about 60 days is conducive to the spread between the vector and humans; the humidity
range is 50%-80%, of which about 75% humidity is conducive to the survival of the coronavirus; the
suitable precipitation range is below 30 mm/ month. The prediction results show that with the approach
of spring, the temperature in north China gradually rises, and the coronavirus spreads to middle and high
latitudes along the temperature line of 13–19 °C ().

"Jingyuan Wang et al" nd that after estimating the serial interval of COVID-19 from 105 pairs of the virus
carrier and the infected, they calculate the daily effective reproductive number, R, for each of all 100
Chinese cities with more than 40 cases. Using the daily R values from January 21 to 23, 2020 as proxies
of non-intervened transmission intensity, they nd, under a linear regression framework for 100 Chinese
cities, high temperature and high relative humidity signi cantly reduce the transmission of COVID-19,
respectively, even after controlling for population density and GDP per capita of cities. One degree Celsius
increase in temperature and one percent increase in relative humidity lower R by 0.0383 and 0.0224,
respectively(7).

Comparison of meteorological conditions of the onset of 2019-nCoV pneumonia in 2019 and SARS
pneumonia in 2003, from October to November 2019 in Wuhan, the mean temperature in Wuhan dropped
                                                   Page 3/17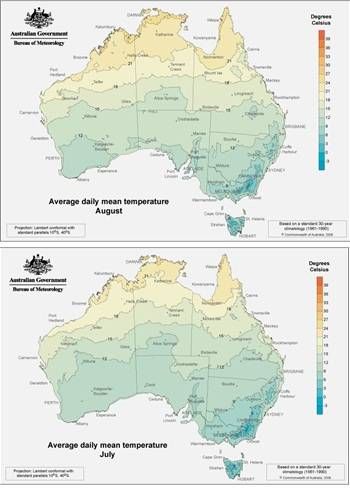
from 18.28 °C to 13.43 °C. Humidity remained between 73.12% and 77.58%, and the rst few cases of the
2019-nCoV pneumonia occurred in early December. The meteorological conditions signi cantly
overlapped with those of SARS onset in Guangzhou. In the winter of 2002, the temperature was between
13.85 °C to 15.85 °C, and humidity kept between 69.05% and 78.91% in Guangzhou. Considering the data
above including 2019-nCoV in Wuhan, SARS coronavirus in Guangzhou and Beijing, we speculate that a
meteorological condition with temperature between 13–19 °C and humidity between 50% and 80% is
suitable for the survival and transmission of the coronavirus. (Jin Bu, et al, 2020) Lower rainfall and
therefore reduced relative humidity provide a good opportunity for the transmission of respiratory
pathogen infections, including coronavirus. ()

Methods:
The paper attempted to test that the most appropriate average temperature for virus activity and
transmission ranges between 13–24 ° C in reality through maps of the monthly temperature averages
during the period from March to November 2020, through study of the case of Australia and Egypt. The
study tried to predict the future of the virus spread during the upcoming seasons through cartographic
methods, Climate maps were obtained from Australia's national weather, climate and water agency, The
Bureau of Meteorology, USGS: Early Warning and Environmental Monitoring Program, and ACC weather.
Con rmed cases numbers were gathered from Australian Government Health Department, and WHO. The
case studies of Egypt and Australia were chosen as two models for different climates, and for
comparison between two countries, one of which is in the northern hemisphere (Egypt), and the other is
located in the southern hemisphere (Australia).

Results:
The study reached, through cartographic analysis, to con rm the relationship between temperature and
increase in the number of con rmed cases in Australia during the month of March, and also the decrease
in the number of cases in Egypt in the same month, The number of con rmed cases was 710 in Egypt vs
4560 in Australia. Excluding the impact of other factors, The study expects that the countries of the
northern hemisphere will turn to more hot seasons, which means low virus activity and weak
transmission. On the contrary, the countries of the southern hemisphere are heading towards less hot
seasons and thus the possibility of more activity of the virus and a greater possibility of transmission
than the northern hemisphere. In both cases, people must adhere to health and social instructions to
prevent the virus transmission from one person to another.

Conclusions
most appropriate average temperature for the survival transmission of COVID-19 ranges between 13–24 °
C. Australia and Egypt are models to con rm the relationship between temperature and COVID-19 activity
and spread. Globally, cities with a mean temperature below 24 °C are all high-risk cities for 2019-nCoV

                                                  Page 4/17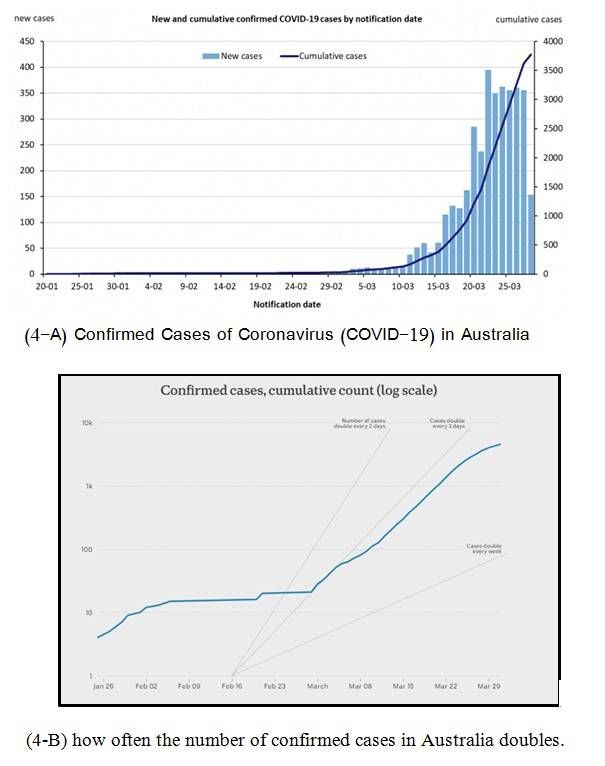
transmission. Especially in the northern spring, and southern autumn and winter. Therefore, countries
should take the necessary precautions to prevent the spread of the epidemic.
The case study of Australia:
The validity of these results has also been demonstrated through the case study of Australia. In Australia,
the rst case appeared in Melbourne on January 19 for a Chinese person coming from Guangzhou, and
the numbers during January and February were very few (the southern summer months) with 9 cases
recorded in January, and only 12 cases in February,
Applying to Australia, we nd that through Figure (1) that shows the average temperature in January, and
February, Figure (2) that shows average daily Mean Temperatures in March, Figure (3) shows the
distribution of Corona cases in Australia in March, Figure (4) shows Con rmed Cases of Coronavirus
(COVID-19) in Australia, And how often the number of con rmed cases in Australia doubles through
March. All these gures show the speed of the virus and its relationship to temperature. Here are the
details:
The Situation During the Summer:
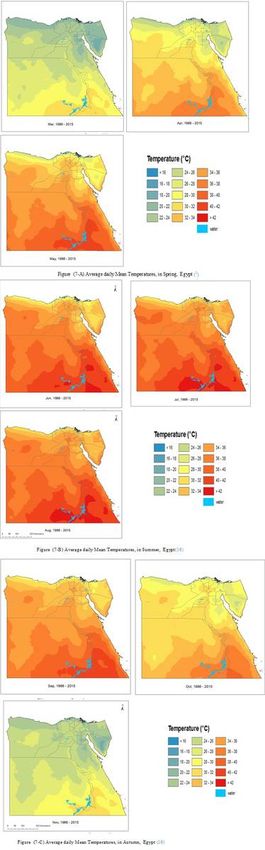
Looking at Figure (1), it is noted that the area which covered by average temperatures 12: 24 ° C in
January (the middle month in the southern summer that runs from December to February) was a small
strip in southern Australia, In this region the city of Melbourne is located, which is the city that had the
rst cases of infection in Australia ,and which located in the temperature range 18:21 ° C.
In February (Fig. 1) the conditions remained the same with a small increase in the area of this southern
strip of the country, which is located in a temperature range less than 24 ° C, but with a noticeable
increase in the area of land which is located in the temperature ranges from 24–27 and from 27–30 ° C.
This was likely to have played a role in slowing the natural spread of the virus.
The situation during the fall:
However, the matter differed a lot in March (Beginning of the southern fall, which extends from the
beginning of March to the end of May), as it is observed from Figures (2) and (3):
All the cities and states where many infections occurred during March occurred in the areas where
the average mean daily temperature Decreased below 24 °C
That areas became represents about a quarter of the Australian lands, and it extended in a form of a
strip from east to west in south of Australia, With exceptions, there were very few areas with average
less than 13 °C.
It includes the cities of Sydney, Melbourne, Brisbane, Adelaide, and Berth, with the exception of
Darwin, which is located in north of Australia. Note that they are millions cities and are the largest
Page 5/17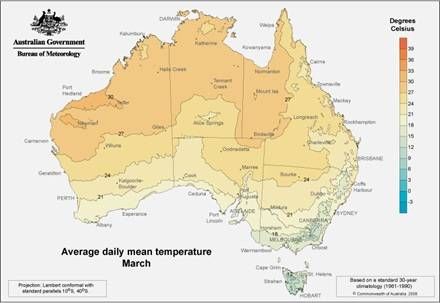
cities in terms of population size in Australia ,except Darwin, This also plays a role in the
    transmission of infection from one person to another.

The situation during the fall:
However, the matter differed a lot in March (Beginning of the southern fall, which extends from the
beginning of March to the end of May), as it is observed from Figures (2) and (3):

    All the cities and states where many infections occurred during March occurred in the areas where
    the average mean daily temperature Decreased below 24 °C
    That areas became represents about a quarter of the Australian lands, and it extended in a form of a
    strip from east to west in south of Australia, With exceptions, there were very few areas with average
    less than 13 °C.
    It includes the cities of Sydney, Melbourne, Brisbane, Adelaide, and Berth, with the exception of
    Darwin, which is located in north of Australia. Note that they are millions cities and are the largest
    cities in terms of population size in Australia ,except Darwin, This also plays a role in the
    transmission of infection from one person to another.

This thermal range (12–24 °C) is covered:
    Most of the lands of New South Wales state, which recorded the highest number of cases of
    infection with coronavirus during March and came rst in terms of the number of con rmed cases
    (2032 cases) ().
    All the lands of the state of Victoria, which came second in terms of the number of con rmed cases
    (917 cases).
    Southeast Queensland, which ranked third (743 cases), and wherever Brisbane is located where a
    large number of cases are recorded.
    About a third of the area of Western Australia, in which the city of Perth is located in the southwest of
    the state, located at the temperature line 21 °C. It came in fourth place (364 cases)
    Half of the area of the state of south Australia, which came in fth place (337 cases)

Note that the northern province, which located completely in a temperature range greater than 24 °C has
recorded the lowest number of con rmed cases (only 16 cases), also we nd that the state of Tasmania,
the island state, most of its lands located in a temperature zone less than 12 °C, has registered 68 cases.

Accordingly, if we exclude the effect of other factors, Australia is a model to con rm the relationship
between temperature and coronavirus activity and spread, In March, it became clear that the areas most
affected and spread by the virus are the regions with an average temperature of 12–24 °C. And the
northern province with the average temperature above 24 °C (in the far north) and the state of Tasmania,
in which the average temperature located below 12 °C in the far south, Both of them scored very few
cases.
                                                  Page 6/17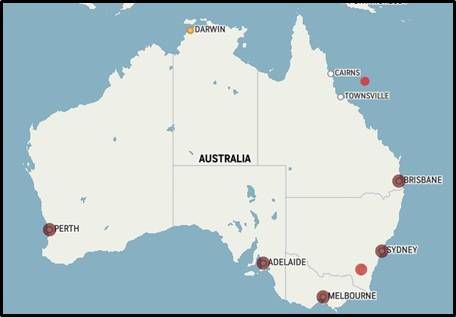
Perhaps a simple presentation of the numbers of infections during March may explain the effect of lower
temperatures during this month on the speed of transmission of the virus, in March there were large
consecutive numbers, as shown in Figure (4-A). The numbers recorded during this month reached to 4087
cases until 3/28/2020. The new cases remained less than 25 cases per day from 1–15 March, then
became within 50 cases per day from 12 to 15 March, from 80 to 150 cases per day from 16 to 19 March,
from 150 to 300 cases in the period 20–22 March, from 300 to 400 cases daily during the period from
March 23–27, then the number jumped to 459 cases on March 28. Figures (4-B) shows that the rate of
multiplication of numbers was almost every 3 days during March.

Australia may face a major crisis during the rest of the autumn months (April and May). As can be seen
from Fig. 5,In April about 75% of Australia’s land will located between 12–24 °C heat lines. While in May
most of Australia's lands will become between 12–24 °C heat lines, with the exception of its northern
fringes, where the average temperature rises above 24 °C, and its southeastern side, where the
temperature will drop below 12 °C, which also means that Coronavirus activity can be disabled in these
areas.

The situation during the winter:
The risk is expected to increase in the southern winter months (June - July - August) in the central and
northern regions, where the average daily temperature ranges between 12–24 ° C, While the temperature
of the south will be less than 12 degrees Celsius, that is, the risk will be relatively less for these areas.

During the months of June and July (Fig. 6), the southern half of Australia cools below 12 °C, while it
ranges from 13–24 in the northern half, whereby it increases the activity of the Coronavirus, In August,
the 12 °C heat line shifts southward, reducing the area of land where the risk of spreading the virus
decreases, And the area of the thermal zone extends from 12 to 21 °C to include all the central and
northern lands, where there is a risk of virus spreading.

Egypt case study:
By comparison between Australia, as a country in the Southern Hemisphere, and Egypt, as a country in
the Northern Hemisphere, there are signi cant climatic differences, as the month of April is the heart of
autumn in Australia while it is the Heart of Spring in Egypt, and the severity of the impact of temperature
on the transmission and activity of Coronavirus is increasing in Australia than in Egypt, where Australia is
heading towards winter and lower temperatures, while Egypt is heading to the transition towards the
summer, which has high rates of heat, and thus the activity and transmission of the virus are expected to
decrease.

The situation in the spring:
From Figure No. (7-A), which shows the mean daily temperature average in Egypt in the spring, it is clear
that:

                                                   Page 7/17
In March, the southern half of Egypt is located in a heat range from 25 to 32 °C, and all of the
governorates of the Delta, Matrouh, the Sinai Peninsula, the northern Red Sea governorate, and the
north of the New Valley Governorate are in a temperature range of 16 to 24 °C. The number of
con rmed cases was 710 vs 4560 in Australia.
In April, most of the Egyptian lands are located in a temperature average of more than 24 °C, except
for most of the Sinai Peninsula and the northern coast of Egypt from Rafah to Salloum. Its
temperature ranges between 20–24 degrees Celsius.
In May, temperatures rise above 26 degrees Celsius in all Egyptian lands, ranging between 26
degrees on the northern coasts, the Red Sea coasts and most of the Sinai lands, but in southern
Egypt the temperature reaches 42 degrees.
From the above, it is clear that the effect of temperature on transmission and activity of COVID-19 in
Egypt was higher in March than April, while the activity and transmission of the virus will be completely
weakened in May, Excluding the impact of other factors. It remains the role of citizens in adhering to
health rules, social separation and sanitary isolation, in order to prevent transmission of the virus from
one person to another.
The situation in the Summer:
From Figure (7-B), which shows the mean daily temperature average in Egypt in the summer, it is clear
that temperatures will be between 28–40 degrees in June and between 30–40 in July and August all over
Egypt.
The situation in the Autumn:
From Figure (7-C), which shows the mean daily temperature average in Egypt in the autumn it is clear that
In September, most of the Egyptian lands will be in a temperature range higher than 28 degrees. In
October, the rate will be between 26 degrees in the far north and 38 degrees in the far south. In November,
the line between Assiut and Hurghada divides Egypt into almost two halves, the northern half will have a
mean temperature of less than 24 degrees, and the northern half will have a temperature above 24
degrees.
Declarations
Ethics approval and consent to participate
Not applicable
Consent for publication
Not applicable
Page 8/17Availability of data and material
The datasets generated and/or analyzed during the current study are available in the (Australian
Government, Health Department), repository (https://www.health.gov.au-3/31/2020), &( Australia's
national weather, climate and water agency, The Bureau of Meteorology) repository
(https://www.health.gov.au-3/31/2020) & (USGS, Early Warning and Environmental Monitoring Program)
repository (https://earlywarning.usgs.gov/fews/product/698).
Competing interests
The author declares that there is no competing interests.
Funding
Not applicable
Authors' contributions
A A designed the study, obtained spatial data, analyze mapping,, statistical analysis, and interpretation of
results, and wrote all drafts of the paper. The author read and approved the nal manuscript.
Acknowledgements
Not applicable
References
1. Fayed .Y, Geography of Climate and Plant, Fifth Edition, Arab Renaissance House, Cairo.1989, 206 .
2. Oliver. J.E., 1981, Climatology: Selected Applications, London,193.
3. Yi Liu1, Qi-Min Wang1, Jiao-Jiao Zheng1, Lin Xu1, Edward C. Holmes1,5 & Yong-Zhen Zhang1, A new
coronavirus associated with human respiratory disease in China, Nature | Vol 579 | 12 March
2020,pp265-284.
4. Zhou,Yang, X., Wang, X. et al. A pneumonia outbreak associated with a new coronavirus of probable
bat origin. Nature 579, 270–273 (2020). Available online at https://doi.org/10.1038/s41586-020-
2012-7
5. Toureh, Abdel Aziz, Environment and Human Health in Medical Geography, The University Youth
Foundation, Alexandria, Egypt,1989,23, 72.
Page 9/176. Maged N Kamel. Boulos, Estella M. Geraghty, Geographical tracking and mapping of coronavirus
disease COVID-19 / severe acute respiratory syndrome coronavirus 2 (SARS-CoV-2) epidemic and
associated events around the world: how 21st century GIS technologies are supporting the global
ght against outbreaks and epidemics, March 2020 International Journal of Health Geographics
19(8),2020.p2.
7. Jingyuan Wang, Ke Tang, Kai Feng and Weifeng Lv, High Temperature and High Humidity Reduce the
Transmission of COVID-19,2020. (https://papers.ssrn.com/sol3/papers.cfm?abstract_id=3551767)
8. Accweather,Confermed Cases of Coronavirus (COVID-19) in Australia, 3/29/2020
https://www.accuweather.com/en/eg/national/covid-19 .
9. Alexandra L. Phelan, SJD, LLM1,; Rebecca Katz, PhD, MPH; Lawrence O. Gostin, JD, The Novel
Coronavirus Originating in Wuhan, China Challenges for Global Health Governance, JAMA.
2020;323(8):709-710. doi:10.1001/jama.2020.1097,
(https://jamanetwork.com/journals/jama/fullarticle/2760500).
10. Jin Bu , Dong-Dong Peng , Hui Xiao , Qian Yue , Yan Han , Yu Lin , Gang Hu, Jing Chen, Analysis of
meteorological conditions and prediction of epidemic trend of 2019-nCoV infection in 2020, medRxiv
2020.02.13.20022715; doi: https://doi.org/10.1101/2020.02.13.20022715.
11. Bi P, Wang J, Hiller JE.(2007) Weather: driving force behind the transmission of severe acute
respiratory syndrome in China? Intern Med J 2007;37(8):550-4. doi: 10.1111/j.1445-
5994.2007.01358.x .
12. Australia's national weather, climate and water agency, The Bureau of Meteorology,
http://www.bom.gov.au.
13. Australian Government , Health Department, https://www.health.gov.au-3/31/2020
14. https://www.accuweather.com/en/eg/national/covid-19
15. ABC,Confermed Cases of Coronavirus (COVID-19) in Australia, https://www.abc.net.au/
16. USGS, Early Warning and Environmental Monitoring Program,
https://earlywarning.usgs.gov/fews/product/698
Figures
Page 10/17Figure 1
Mean Temperatures , January and February 2020,Australia.
Page 11/17Figure 2
Average daily Mean Temperatures, Australia, March.(
Figure 3
Con rmed Cases of Coronavirus (COVID-19) in Australia 3/29/2020.
Page 12/17Figure 4
Con rmed Cases of Coronavirus (COVID-19) and how often the number Doubles in Australia
Page 13/17Figure 5
Average daily Mean Temperatures, Australia, April & May.
Page 14/17Figure 6
Average daily Mean Temperatures, Australia, June, July, and August
Page 15/17Page 16/17
Figure 7

Figure (7-A) Average daily Mean Temperatures, in Spring, Egypt Figure (7-B) Average daily Mean
Temperatures, in Summer, Egypt Figure (7-C) Average daily Mean Temperatures, in Autumn, Egypt

Supplementary Files
This is a list of supplementary les associated with this preprint. Click to download.

    corona nalrefrencepdf.pdf

                                                 Page 17/17
You can also read