Report on the new coronavirus Covid-19 pandemic in Italy
←
→
Page content transcription
If your browser does not render page correctly, please read the page content below
Report on the new coronavirus Covid-19 pandemic
in Italy
Bianca Maria Donida ( donida.bianca-maria@libero.it )
Research
Keywords: Report, coronavirus Covid-19 pandemic, Italy
DOI: https://doi.org/10.21203/rs.3.rs-26419/v1
License: This work is licensed under a Creative Commons Attribution 4.0 International License.
Read Full License
Page 1/17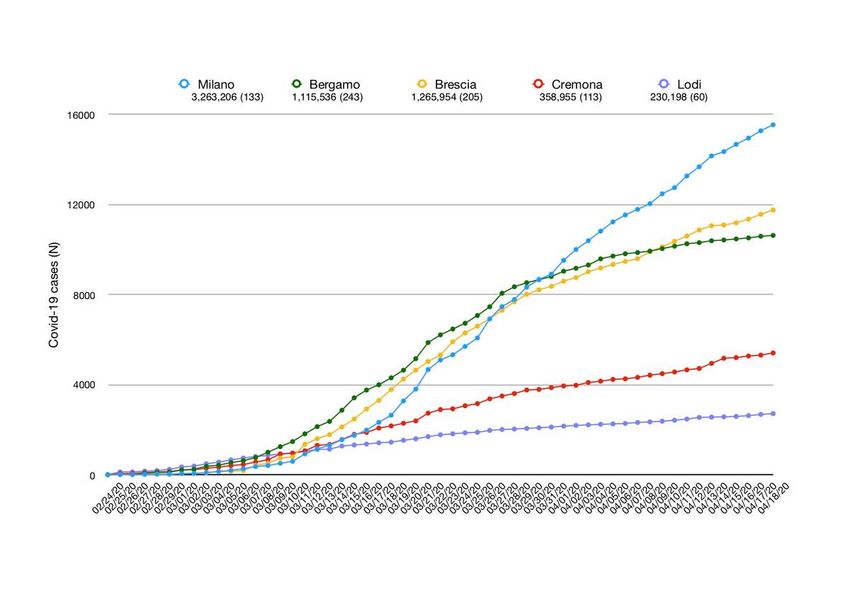
Abstract
Background Sars-CoV-2 is a coronavirus associated with human severe acute respiratory disease named
Covid-19, rst reported in China on December 2019. World Health Organization declared Covid-19 a
pandemic on March 20, 2020. This report aims to outline the Italian outbreak characteristics. Italy, as one
of rst most affected area outside Asian continent, could give experiences to the other countries.

Methods Data on positive cases and Covid-19 patients made available by Italian Health Authorities were
reanalyzed and described.

Results Up to April 18, 2020 Italy recorded 175,925 Sars-CoV-2 positive cases (10.68% among health care
professionals) and 23,227 Covid-19 deaths. Covid-19 patients median age was 62 years. Male/female
ratio was 1.00. Median time between symptoms and diagnosis was 6 days. Between hospitalized
patients, the 10% needed intensive care. Median age at death was 80 years, with differences between
sexes. Apparent lethality rate was 13.2%. At least one concomitant medical condition was present in
96.4% of patients who died.

Discussion The number of Italian positive cases could be higher and the Italian lethality rate could be
lower. The presence of asymptomatic people, known to be a vehicle for Covid-19 also for serious cases,
could made slower the decrease of infection and distance the end of the novel coronavirus epidemic.

Background
Sars-CoV-2 is a coronavirus associated with human severe acute respiratory disease named Covid-19,
 rst reported in Wuhan, Hubei province in China on December 12, 20191. Up to January 20, 2020, 282
con rmed cases of Covid-19 were reported from four countries including China (278 cases), Thailand (2
cases), Japan (1 case) and the Republic of Korea (1 case)2. Up to January 23, 2020, 581 cases were
reported in Thailand, Japan, Hong Kong Special Administrative Region, Taipei Municipality, China, Macau
Special Administrative Region, United States of America and the Republic of Korea. All these Covid-19
patients had travel history to Wuhan2. Up to January 27, 2020 globally 2,798 con rmed cases were
reported for novel coronavirus and for the rst time Covid-19 cases were reported also in the European
region (France rst and then in Germany)2. On January 31, 2020 when globally 9,826 cases of Covid-19
acute respiratory disease were con rmed, the rst two cases were reported in Italy; both had travel history
to Wuhan City2. The rst Italian Covid-19 case due by local transmission, was reported on February 21,
2020, in Codogno, a city belonging to the province of Lodi, at the boundaries between the province of Lodi
and the province of Cremona, in the region of Lombardia, in the North of Italy. In no time the number of
Covid-19 cases increased considerably and Italy was soon the rst most suffering country outside the
Asian continent. Covid-19 cases started to be reported also by other countries worldwide. The World
Health Organization (WHO) on March 11, 2020 declared Covid-19 a pandemic, pointing to the over
118,000 cases of the coronavirus illness in over 110 countries and territories around the world and the
sustained risk of further global spread2. As of March 11, South-East Asia, Europe, America, West Paci c,

                                                 Page 2/17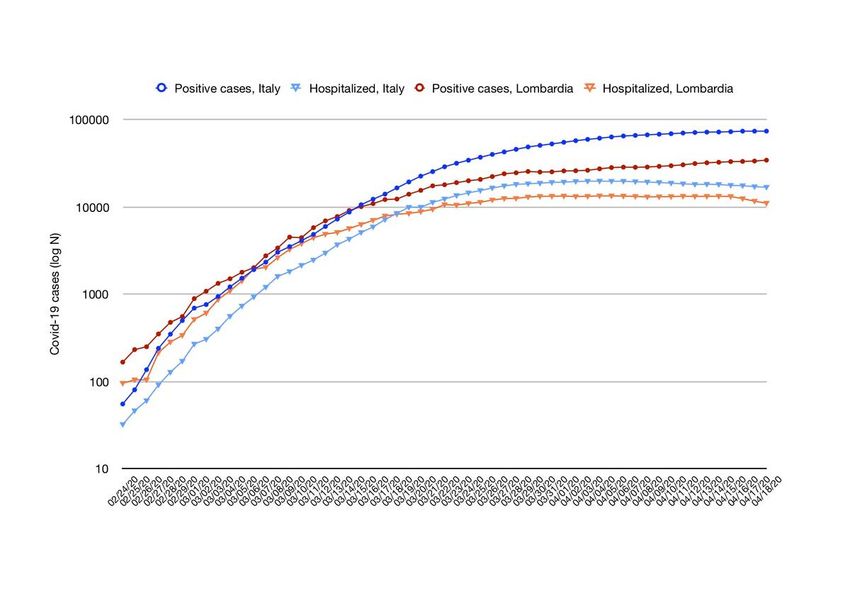
East Mediterranean, and African regions were affected by the spread of Covid-19 epidemic, for a total of
167 countries worldwide2. Up to March 17, 2020 more than two million (2,074,529) Sars-CoV-2 cases and
139,378 Covid-19 deaths were globally reported2. Worldwide level WHO risk assessment was classi ed as
very high2. This report aims to pointed out data and patients characteristics from Italian epidemic. Italy,
as one of the rst most affected regions could give experiences to other countries.
Methods
Data source. Italian data about Covid-19 were made available by Italian Health Authorities “Protezione
Civile” and “Istituto Superiore di Sanità”. In detail, “Protezione Civile” daily updated and made available
online the number of tests made to evaluate the presence of Sars-CoV-2 infection, the number of Covid-19
positive cases, the numbers of hospitalized, intensive care and homecare Covid-19 patients and the
number of Covid-19 deaths by region and overall in Italy3. Daily updated number of positive cases by
provinces was made available as well3. “Istituto Superiore di Sanità” weekly updated and published
online cases and deaths distribution by age and by sex, disease incubation time and descriptive statistics
about patients who died (symptoms, comorbidities, treatment, hospitalization time and complications)4.
Data analysis Cumulative data obtained from previously listed references were reanalyzed and described
in this report. Lethality was calculated as the ratio between deaths and positive cases and cumulative
incidence as the ratio between positive new cases and Italian inhabitants, according to last census5. For
the observation time, crude and age standardized incidence rates were calculated as well5,6. STATA 15
(Texas, USA) was used as statistical analysis software.
Results
Italian Covid-19 cases
Overall the number of Italian Sars-CoV-2 positive cases was increasing but the exponential phase, that
mark out the rst epidemic phase of a virus infection, seemed de nitively distance from data. The grow
factor, based on number of cases and not on virus reproduction number, was lower than 1 since March
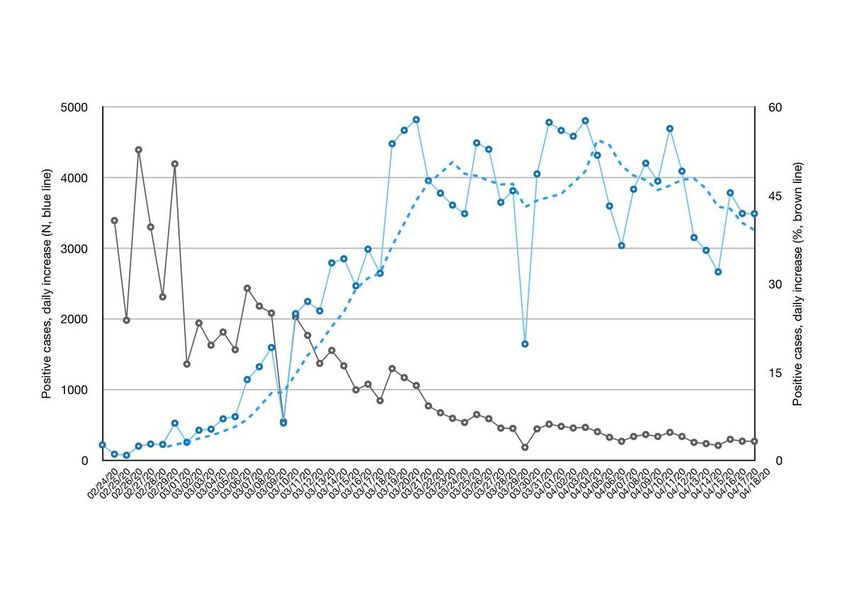
20, 2020. Figure 1 shows the daily increase of new positive Covid-19 cases in Italy. Considering the daily
increase, we should consider both the test’s execution time and the number of swabs daily made. The
number of Sars-CoV-2’s RNA evaluation tests changed in time and increased from 2.07/1000 Italian
inhabitants on March 15 (18.14% positive) to 8.40/1000 on March 31 (13.70% positive) and it was
18.51/1000 on April 15, 2020 (6.10% positive)3,5. It should be considered that available tests’ number was
swabs’ number. Taking into consideration con rmation’s and repeat’s tests, it should be reasonable a
number of people who were tested that was about the 70% of the swabs’ number.
Up to April 18, 2020 according to o cial data, Italy recorded 175,925 Sars-CoV-2 positive cases, 10.68%
among health care professionals3,4. The age and sex distribution of cases is reported in Table 1,
incidence is reported as well. Median age was 62 years (0-100 range)4 and overall male/female ratio was
Page 3/17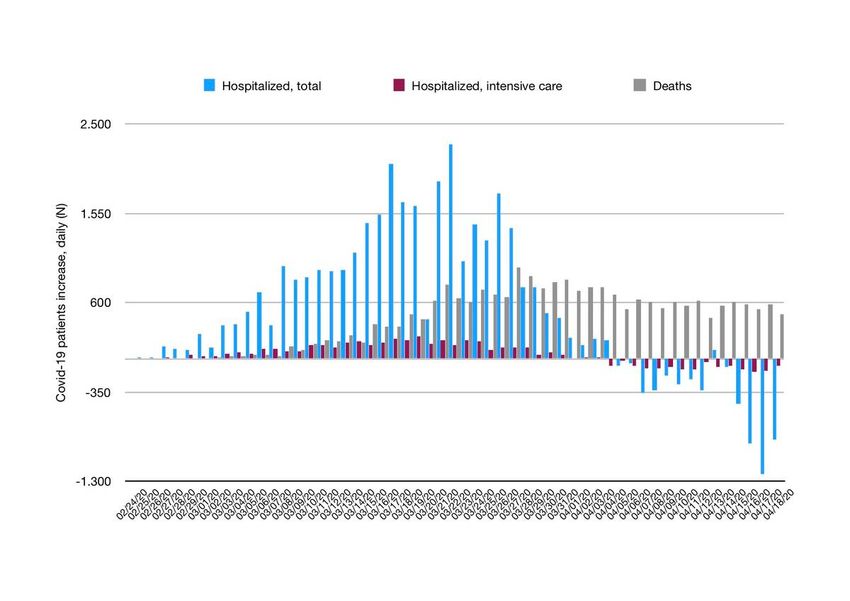
1.00. The different behavior in more aged people was probably due to the higher number of women aged
more than 90s (male female ratio equal to 0.37, according to last census5). Between health care
professional Covid-19 patients, median age at diagnosis was 48 years and male/female ratio was 0.474.

From available literature the estimated mean incubation time of Covid-19 was 5.5 days and symptoms
occurred by 11.5 days in the 97.5% of infected people7. Italy reported a median time between symptoms
and diagnosis equal to 3 days for cases recorded on February 20-29 (1,614 cases analyzed), 5 days for
cases recorded on March 1-10 (9,732 analyzed), 6 days for cases recorded on March 11-20 (27,679
analyzed) and 7 days for cases recorded between March 21 and April 9 (46,236 analyzed)4.

Overall 25.74% of positive cases were hospitalized3. During hospitalization patients were treated by
antibiotics (84%), antivirals (56%) and corticosteroids (35%)4. The 19.6% of patients was concomitant
treated with all of these medications4. On April 18, 2020 the 9.85% of all Covid-19 hospitalized patients
received intensive care3. Detail on hospitalization status and number of patients who needed intensive
care is reported in Figure 2.

Italian Covid-19 deaths

Up to April 18, 2020 according to o cial data, Italy recorded overall 23,227 Covid-19 deaths3. Considering
the daily deaths increase, reported in Figure 2, we should also considered the disease progression time.

The age and sex distribution of patients who died is reported in Table 14, lethality rate is reported as well.
On April 18, 2020 Italian lethality rate was equal to 13.2%, 0.4% among health care professionals3,4.
Overall lethality increased with age, especially in male patients. Median age at death was 80 years (range
0-100; IQR 73-86), with differences between sexes (83 for women and 79 for men)4.

According to data on comorbidities, available for 1,738 patients, at least one concomitant medical
condition (mean 3.3, sd 1.9) was present in 96.4% of patients who died4. In detail, the 3.6% had no one
concomitant pathologies, 14.4% one, 20.7% two and the 61.3% had three or more concomitant
pathologies4. Most representative comorbidities were hypertension (69.7%), type 2 diabetes (32.0%),
ischemic heart disease (27.7%), chronic renal failure (22.0%), atrial brillation (21.9%), chronic obstructive
pulmonary disease (17.8%), history of cancer in the past 5 years (16.2%) and heart failure (15.5%)4.

Between who died, most common symptoms before hospitalization were fever (76.0%), dyspnea (72.0%),
cough (38.0%) diarrhea (6.0%) and hemoptysis (1.0%)4. The 5.9% of patients did not experienced any
symptom at hospital admission4. Median time between presence of symptoms and death was 10 days;
between hospitalization and death 5 days, and was 4 days longer if patient was moved to intensive care
unit4.

                                                   Page 4/17
Most common complications that nally lead to patient’s death were acute respiratory distress syndrome
(96.7%), acute kidney injury (22.9%), superinfection (12.4%) and acute myocardial injury (9.5%)4.
Figure 1. Positive Covid-19 cases, daily increase since February 24, 2020 (up to April 18, 2020)3; as
absolute number (N, continuous blue line, in dotted blue line its 6 days moving average) and as
percentage (%, brown line). As reported by Italian Authorities in their newsletter, data were daily updated
and we should considered a possible delay in data communication by regions due to a such high number
of tests performed a day4. We should also considered the execution time of test needed to evaluate the
presence of virus’s RNA.
Page 5/17Male Patients Female Patients Overall
Ag Po De Le Po De Le Cases, Positive Cu Cr Ag De Le
e sit at th sit at th M/F (N) m ud e at th
iv h ali iv h ali In e St h ali
e (N ty e (N ty c In d (N ty
(N ) (% (N ) (% (% c In ) (%
) ) ) ) ) Ra c )
te Ra
te
0- 59 0 0. 51 1 0. 1.15 1,123 0. 12 1. 1 0.
9 6 00 9 19 02 .0 26 09
3
10 90 0 0. 89 0 0. 1.00 1,804 0. 17 1. 0 0.
- 1 00 7 00 03 .0 88 00
19 6
20 3, 5 0. 4, 2 0. 0.77 7,737 0. 68 8. 7 0.
- 35 15 33 05 12 .0 17 09
29 0 8 5
30 5, 28 0. 6, 12 0. 0.85 11,686 0. 90 12 40 0.
- 34 52 29 19 17 .1 .1 34
39 4 9 0 6
40 9, 13 1. 11 45 0. 0.79 20,519 0. 12 16 17 0.
- 00 3 48 ,4 39 22 1. .9 8 87
49 9 52 09 5
50 14 60 4. 15 15 1. 0.98 29,858 0. 17 23 75 2.
- ,7 6 10 ,0 0 00 32 4. .5 6 53
59 79 15 14 1
60 14 1, 11 9, 50 5. 1.66 24,040 0. 17 20 2, 9.
- ,9 77 .8 02 4 59 33 8. .5 28 50
69 63 6 7 4 72 5 4
70 15 4, 29 10 1, 16 1.54 25,717 0. 23 21 6, 24
- ,5 53 .0 ,0 66 .4 43 5. .1 20 .1
79 77 2 9 97 4 8 26 7 3 2
80 12 4, 40 14 3, 21 0.86 26,706 0. 40 16 8, 30
- ,3 99 .4 ,3 07 .4 75 9. .3 07 .2
89 32 2 8 29 1 3 70 9 0 2
>= 2, 97 39 7, 1, 20 0.34 9,813 1. 69 6. 2, 25
90 47 0 .2 33 48 .2 27 1. 91 45 .0
0 7 3 3 2 07 5 2
Un 49 2 54 0 104 2
k
To 79 13 16 79 6, 8. 1.00 159,107 0. 14 12 1 12
tal ,3 ,0 .4 ,3 93 74 26 3. 8. 9, .5
70 44 3 57 2 78 96 99 7
6
Page 6/17Table 1. Positive cases diagnosed and number of deaths recorded overall, by age and by sex since
February 21, 2020 (up to April 16, 2020); information about sex was missing in 380 cases4. Number of
Italian inhabitants available at last census5 was used to calculate cumulative incidence and crude rate.
Eurostat 2013 standard population6 was used to calculate age standardized rate. Legend: “Unk” is for
unknown, “Cum Inc” is for cumulative incidence, “Crude Inc Rate” is for crude incidence rate; “Age Std Inc
Rate” is for age standardized incidence rate. Both incidence rates are monthly incidence rate for the
observation time period, x100,000); “M” was for male ,“F” female.
Figure 2. Distribution of Covid-19 Italian cases by hospitalization status and exitus since February 24,
2020 (up to April 18, 2020)3. Homecare Covid-19 patients, recovered cases or cases still positive that were
dismissed from hospital are not included in this graph. As reported by Italian Authorities in their
newsletter the number of deaths were deaths occurred in patients who tested positive for Sars-CoV-2’s
RNA, independently from pre-existing diseases4.
Focus on Lombardia, the region where the Italian Covid-19 outbreak began
Italy is organized in 19 regions and 2 autonomous provinces and the most affected Italian area was the
region of Lombardia, in the North of Italy. Up to April 18, 2020 Lombardia recorded 65,381 Covid-19 cases
(37.2% of all cases), and 12,050 related deaths (51.9% of all deaths)3. In this area the districts of
Cremona, Lodi, Bergamo, Brescia and Milano were the most affected cities and according to last o cial
data, their cumulative incidence values were equal to 1,51%, 1.18%, 0.95%, 0.93% and 0.48%
respectively3,5.
Codogno and the around area, for a total of 10 municipalities in the province of Lodi, at the boundary of
the province of Cremona (Codogno, Castiglione d’Adda, Casalpusterlengo, Fombio, Maleo, Somaglia,
Bertonico, Terranova dei Passerini, Castelgerundo and San Fiorano), were quarantined and de ned “red
Page 7/17zone” since February 23, 20208. Up to March 5, 2020 this area reached 5,830 laboratory-con rmed Sars-
CoV-2 cases3. As reported, the quarantine strategy pointed out a valid approach to slowdown the spread
of the infection and no positive new cases were recorded on March 10, 2020 in Codogno, where the
99.94% of inhabitants followed the restriction policies9.
Due to the increase of cases outside this area, Lombardia and all Italy, was quarantined from March 8,
2020 and a strengthening of restriction policies was made on March 20, 20208. Increase of cases across
the most affected cities in Lombardia is reported in Figure 3; Italy compared to Lombardia is reported as
well (Figure 4). The effects of restriction policies should considered also disease incubation time.
Figure 3. Cumulative Sars-CoV-2 cases, by day across the most affected cities in Lombardia since
February 24, 2020 (up to April 18, 2020)3. Milano (blue line), Bergamo (green line), Brescia (yellow line),
Cremona (red line) and Lodi (purple line). Number of inhabitants (number of municipalities) are reported
as well5.
Figure 4. Cumulative Sars-CoV-2 cases, by day in Lombardia and overall in Italy since February 24, 2020
(up to April 18, 2020)3. Positive Sars-CoV-2 cases (dark lines) and hospitalized Covid-19 patients (light
lines) in Italy (without cases recorded in Lombardia, blue lines) and in Lombardia (red lines) on a
semilogarithmic scale. Legend: “Positive cases” includes both hospitalized and homecare Covid-19
patients; “Hospitalized” includes patients admitted to all hospital wards.
Discussion
Sars-CoV-2 is a coronavirus associated with human severe acute respiratory disease named Covid-19,
rst reported in Wuhan, Hubei province in China on December 12, 20191. In Italy the rst local Covid-19
case was identi ed on February 21, 2020 and one month later Italy was the most suffering country
outside Asian continent. In the meantime, Covid-19 cases became to be reported also by other countries
worldwide and the World Health Organization (WHO) declared Covid-19 a pandemic on March 11, 2020
Page 8/17pointing to the over 118,000 cases of the coronavirus illness in over 110 countries and territories around
the world and the sustained risk of further global spread2.
Due to symptomatology and prognosis of Covid-19 disease, the rst Italian concern was the limited
number of intensive care resources: 5,17910 beds were available on March 1, 2020. The Italian society of
Intensive Care (SIAARTI, Società Italiana di Anestesia Analgesia Rianimazione e Terapia Intensiva)
published on March 6, 2020 a list of ethical recommendation and guidelines in order to give criteria for
access to intensive treatments, to follow if needs exceeded resources11. Italy done more and more effort
to ensure the right health care treatments to anyone who needed it. Many public and private fundraisers
grown up to help and make faster the setting up of new intensive care unit and camp hospitals by
voluntary workers. On March 31, 2020 Italy reached 9,12210 (+79.2%) intensive care beds, and more new
hospitals were built to treat Covid-19 patients, in a fast race against time and virus. Second concern in the
ghting with the Italian outbreak was the infection of health care professionals. Medical devices, medical
doctors, nurses and healthcare operators, even retired professionals, arrived in Lombardia from other
Italian areas, even from abroad arrived to help out with the coronavirus crisis. Italian private societies and
Italian University departments worked together to reconvert their equipment to produce personal
protective devices and ventilators according to standards for medical use.
From o cial data3, the apparent Covid-19 lethality rate seemed to be higher than in other most affected
countries, as China for example. This was probably due to two main consideration: the high rate of old
people in Italy and the Italian recommendations to evaluate a positive case. About rst consideration,
data could be analyzed using standardized rates, but a longer observation time and shared guidelines
among countries should be needed to take advantage from a such type of epidemiological indicator in a
scenario of virus infection. About second observation, according to the decree of February 25, 2020
(updated on April 3, 202012) in Italy the presence of viral RNA was evaluated in very suspected Covid-19,
symptomatic ILI (In uenza-Like Illness) and SARI (Severe Acute Respiratory Infections) cases13, not
considering the asymptomatic cases. This observation was important for the estimation of the number of
Sars-CoV-2 positive subjects and so for the lethality attributed to Covid-19 in Italy. The epidemiological
study, unique in Italy, set up in Vo’ Euganeo, the city that recorded the rst Covid-19 case in Veneto (the
most affected Italian region, after Lombardia and Emilia Romagna); showed the presence of
asymptomatic people. All inhabitants of Vo’ Euganeo at the beginning of Covid-19 epidemic, between
February 29 and March 5, 2020, were test for the presence of Sars-CoV-2’s RNA. Seventy/2,778 subjects
were positive, 14/70 subjects were hospitalized and 1/14 died14. We would have seen for Vo’ Euganeo, as
positive people 14 symptomatic cases and considering the one death that occurred in Vo’ Euganeo, the
rst Covid-19 death that occurred in Italy; as lethality rate 1/14 (7.1%) rather than the rate 1/70 (1.4%). It
could be reasonable that the number of Italian positive cases could be higher and the Italian lethality rate
could be lower. On the other hand, some deaths could been not considered, especially among old people
who died at home or at elderly residences without the awareness of their Sars-CoV-2 status, as locally
reported. Overall Italy counts 3,420 elderly residences (19.8% in Lombardia)15. On April 14, 1,082/3,420
elderly residences answered the survey conducted by Italian health authority “Isituto Superiore di
Page 9/17Sanità”15. According to the survey’s report, between February 1 and April 14, 6,773 deaths occurred (49.7%
between March 16 and March 31, 45.0% in Lombardia): 364/6,773 were o cially positive Covid-19
deaths and 2,360/6,773 were people who died because of u like symptoms15. In the month of March
(March 1-28, 2020) in Lombardia, Italian Health Authorities recorded 5,944 Covid-19 deaths3
(underestimation was possible considering a plausible delay in deaths recording) and Italian Institute of
Statistics (ISTAT), recorded for the same region (Lombardia) and period (March 1-28, 2020) 16,250 (all
causes) deaths against a mean of past March (2015-2019) equal to 5,698.2 (sd 195.3) that is for
Cremona +372.5% compared to (all causes) deaths recorded on March in past years (2015-2019 mean),
Lodi +371.7%, Bergamo +576.4%, Brescia +268.4% and Milano +88.3%16. Considering previous months
since January 1, 2020 and according to ISTAT mortality data (all causes deaths) released on April 17, in
Lombardia the weekly deaths increase was over than 20% same week in previous years (mean 2015-
2019) since the 3rd week of February only in the province of Lodi (+23.0%)16. In the last week of February
(all causes) deaths increase was higher than 20% in Lodi again (+117.1%), Bergamo (+30.6%) and
Cremona (+22.1%)16. In last week of February there was an increase of (all causes) deaths also for other
two provinces in Lombardia, Pavia (+38.8%), and Como (+38.1%)16. Overestimating deaths (hypothesis
of deaths increase entirely due to Covid-19), and considering 2.3% as a more plausible value of lethality1;
in Lombardia the number of positive people could be higher than o cial data, reaching in the most
affected cities a cumulative incidence value about 20%, even greater for a lesser lethality rate. We should
however considered that available data are temporary data and available knowledge on Covid-19 is
temporary knowledge. Globally, on April 18, 2020 Sars-CoV-2 is a relatively new coronavirus and Covid-19
is a relatively new disease. Data should be reanalyzed when new knowledge will be available, before
delineate a strong hypothesis about more reasonable number of positives Sars-CoV-2 cases and Covid-19
deaths and evaluate differences between countries.
Conclusion
Since the Covid-19 outbreak began, Italy made many efforts: quarantine and national restrictive policies,
new healthcare professionals hiring and fast building of new camp hospitals and intensive care units; in
a fast race against time and virus. Even if slower, the increase of Covid-19 did not stop and restriction
policies, that prevented both much further deaths and the spread of infection in Central and South Italy;
could be not su cient. Asymptomatic subjects, people without information about their positive status
and without symptoms, could be themselves unaware vehicles for Covid-19, also for serious cases17.
They could made slower the decrease of infection and distance the end of the novel coronavirus
epidemic. Italy really never stopped and two months later the detection of the rst local Covid-19 case, the
Italian government was planning the economic recovery. Many new kits to make faster the evaluation of
the presence of virus's RNA in the blood, or make possible the evaluation of immunoglobulins against
Sars-CoV-2 or digital tools for contact tracing were or are under validation; and the e ciently organization
of district medicine to plan a “Phase 2 of epidemic” that will have to be safe and clever to restart the
economy without restart the epidemic. In the meantime new hopes arose from experimental trials with
Page 10/17past and new drugs18, in a worldwide war against a such challenging submicroscopic nonliving molecule
named Sars-CoV-2.
Abbreviations
Covid-19 CoronaVirus Disease 19
ILI In uenza-Like Illness
IQR InterQuartile Range
ISTAT “Istituto Nazionale di Statistica”
N Number
RNA RiboNucleic Acid
SIAARTI “Società Italiana di Anestesia Analgesia Rianimazione e Terapia Intensiva”
SARI Severe Acute Respiratory Infections
Sars-CoV-2 Severe acute respiratory syndrome CoronaVirus 2
sd Standard Deviation
WHO World Health Organization
Declarations
Ethics approval and consent to participate
Not applicable
Availability of data and material
Data described in this report were published by Italian Health Authorities and they are full available
following the references.
Competing interests
The author declare that she has no competing interests.
Page 11/17Funding
Not applicable
Authors' contributions
BMD is the only author.
Acknowledgements
Not applicable
References
1. The Novel Coronavirus Pneumonia Emergency Response Epidemiology Team. Novel Coronavirus
Pneumonia Emergency Response Epidemiology Team. Vital surveillances: the epidemiological
characteristics of an outbreak of 2019 novel coronavirus diseases (COVID-19). China CDC Wkly.
2020;2(8):113-122. http://weekly.chinacdc.cn/en/article/id/e53946e2-c6c4-41e9-9a9b-
fea8db1a8f51.
2. World Health Organization. Coronavirus disease (COVID-2019) situation reports.
https://www.who.int/emergencies/diseases/novel-coronavirus-2019/situation-reports. Accessed
April 18, 2020.
3. Protezione Civile Italiana. http://www.protezionecivile.gov.it. Accessed April 18, 2020.
4. Istituto Superiore Sanità I. Task force COVID-19 del Dipartimento Malattie Infettive e Servizio di
Informatica, Istituto Superiore di Sanità. Epidemia COVID-19, Aggiornamento nazionale: 16 Aprile
2020. https://www.epicentro.iss.it. Accessed April 18, 2020.
5. ISTAT. Popolazione residente al 1° gennaio. http://dati.istat.it/Index.aspx?
DataSetCode=DCIS_POPRES1. Accessed April 18, 2020.
6. Revision of the European Standard Population.; 2013.
https://ec.europa.eu/eurostat/documents/3859598/5926869/KS-RA-13-028-EN.PDF/e713fa79-
1add-44e8-b23d-5e8fa09b3f8f.
7. Stephen AL, Al E. The Incubation Period of Coronavirus Disease 2019 (COVID-19) From Publicly
Reported Con rmed Cases: Estimation and Application. Ann Intern Med. 2020;10.
doi:https://doi.org/10.7326/M20-0504
8. Governo Italiano Presidenza del Consiglio dei Ministri.
http://www.governo.it/it/approfondimento/coronavirus/13968. Accessed April 18, 2020.
Page 12/179. Qui a Codogno zero nuovi contagi perché il 100 per 100 dei cittadini ha rispettato le regole.
http://www.today.it/attualita/coronavirus-codogno-zero-contagi.html. Accessed April 18, 2020.
10. www.corriere.it. Coronavirus in Italia: i tagli al Servizio sanitario nazionale, chi li ha fatti e perché.
https://www.corriere.it/dataroom-milena-gabanelli/covid-19-tagli-servizio-sanitario-nazionale-chi-li-
ha-fatti-perche/b18749f6-736d-11ea-bc49-338bb9c7b205-va.shtml. Accessed April 18, 2020.
11. SIAARTI. Emergenza COVID-19: Ecco Le Raccomandazioni Di Etica Clinica Della SIAARTI.
http://www.siaarti.it/News/comunicato raccomandazioni di etica clinica siaarti.aspx.
12. Italian Ministry of Health. Pandemia di COVID-19 – Aggiornamento delle indicazioni sui test
diagnostici e sui criteri da adottare nella determinazione delle priorità. Aggiornamento delle
indicazioni relative alla diagnosi di laboratorio.
http://www.trovanorme.salute.gov.it/norme/renderNormsanPdf?
anno=2020&codLeg=73799&parte=1 &serie=null. Accessed April 18, 2020.
13. Decree. Italian Ministry of Health. http://www.trovanorme.salute.gov.it/norme/renderNormsanPdf?
anno=2020&codLeg=73368&parte=1 &serie=null. Accessed April 18, 2020.
14. Regione Veneto. Coronavirus Regione Veneto Azienda Zero.
https://it.scribd.com/document/450608044/Coronavirus-Regione-Veneto-Azienda-Zero-
pdf#download.
15. Istituto Superiore di Sanità. Survey Nazionale Sul Contagio COVID-19 Nelle Strutture Residenziali e
Sociosanitarie. https://www.epicentro.iss.it/coronavirus/pdf/sars-cov-2-survey-rsa-rapporto-3.pdf.
16. ISTAT. DATI DI MORTALITÀ. https://www.istat.it/it/archivio/240401. Accessed April 18, 2020.
17. Yang H, Duan G. Analysis on the epidemic factors for the Corona Virus Disease. Zhonghua Yu Fang
Yi Xue Za Zhi. 2020;54(E021). doi:10.3760/cma.j.cn112150-20200227-00196
18. AIFA. Experimental Trials Covid-19. https://www.aifa.gov.it/sperimentazioni-cliniche-covid-19?
fbclid=IwAR0M9GyKck4NywNFXI3XDzVGHbnxiQww9PaXf9xx3UQy9bdUk-IMvoxGwsM. Accessed
April 18, 2020.
Figures
Page 13/17Figure 1
Positive Covid-19 cases, daily increase since February 24, 2020 (up to April 18, 2020)3; as absolute
number (N, continuous blue line, in dotted blue line its 6 days moving average) and as percentage (%,
brown line). As reported by Italian Authorities in their newsletter, data were daily updated and we should
considered a possible delay in data communication by regions due to a such high number of tests
performed a day4. We should also considered the execution time of test needed to evaluate the presence
of virus’s RNA.
Page 14/17Figure 2
Distribution of Covid-19 Italian cases by hospitalization status and exitus since February 24, 2020 (up to
April 18, 2020)3. Homecare Covid-19 patients, recovered cases or cases still positive that were dismissed
from hospital are not included in this graph. As reported by Italian Authorities in their newsletter the
number of deaths were deaths occurred in patients who tested positive for Sars-CoV-2’s RNA,
independently from pre-existing diseases4.
Page 15/17Figure 3
Cumulative Sars-CoV-2 cases, by day across the most affected cities in Lombardia since February 24,
2020 (up to April 18, 2020)3. Milano (blue line), Bergamo (green line), Brescia (yellow line), Cremona (red
line) and Lodi (purple line). Number of inhabitants (number of municipalities) are reported as well5.
Page 16/17Figure 4
Cumulative Sars-CoV-2 cases, by day in Lombardia and overall in Italy since February 24, 2020 (up to
April 18, 2020)3. Positive Sars-CoV-2 cases (dark lines) and hospitalized Covid-19 patients (light lines) in
Italy (without cases recorded in Lombardia, blue lines) and in Lombardia (red lines) on a semilogarithmic
scale. Legend: “Positive cases” includes both hospitalized and homecare Covid-19 patients;
“Hospitalized” includes patients admitted to all hospital wards.
Page 17/17You can also read