Estimation of exponential growth rate and basic reproduction number of the coronavirus disease 2019 (COVID-19) in Africa - Infectious Diseases of ...
←
→
Page content transcription
If your browser does not render page correctly, please read the page content below
Musa et al. Infectious Diseases of Poverty        (2020) 9:96
https://doi.org/10.1186/s40249-020-00718-y

 RESEARCH ARTICLE                                                                                                                                  Open Access

Estimation of exponential growth rate and
basic reproduction number of the
coronavirus disease 2019 (COVID-19) in
Africa
Salihu S. Musa1,2, Shi Zhao3,4, Maggie H. Wang3,4, Abdurrazaq G. Habib5, Umar T. Mustapha6 and Daihai He1*

  Abstract
  Background: Since the first case of coronavirus disease 2019 (COVID-19) in Africa was detected on February 14,
  2020, the cumulative confirmations reached 15 207 including 831 deaths by April 13, 2020. Africa has been
  described as one of the most vulnerable region with the COVID-19 infection during the initial phase of the
  outbreak, due to the fact that Africa is a great commercial partner of China and some other EU and American
  countries. Which result in large volume of travels by traders to the region more frequently and causing African
  countries face even bigger health threat during the COVID-19 pandemic. Furthermore, the fact that the control and
  management of COVID-19 pandemic rely heavily on a country’s health care system, and on average Africa has poor
  health care system which make it more vulnerable indicating a need for timely intervention to curtail the spread. In
  this paper, we estimate the exponential growth rate and basic reproduction number (R0) of COVID-19 in Africa to
  show the potential of the virus to spread, and reveal the importance of sustaining stringent health measures to
  control the disease in Africa.
  Methods: We analyzed the initial phase of the epidemic of COVID-19 in Africa between 1 March and 13 April 2020,
  by using the simple exponential growth model. We examined the publicly available materials published by the
  WHO situation report to show the potential of COVID-19 to spread without sustaining strict health measures. The
  Poisson likelihood framework is adopted for data fitting and parameter estimation. We modelled the distribution of
  COVID-19 generation interval (GI) as Gamma distributions with a mean of 4.7 days and standard deviation of 2.9
  days estimated from previous work, and compute the basic reproduction number.
  Results: We estimated the exponential growth rate as 0.22 per day (95% CI: 0.20–0.24), and the basic reproduction
  number, R0, as 2.37 (95% CI: 2.22–2.51) based on the assumption that the exponential growth starting from 1 March
  2020. With an R0 at 2.37, we quantified the instantaneous transmissibility of the outbreak by the time-varying
  effective reproductive number to show the potential of COVID-19 to spread across African region.
  Conclusions: The initial growth of COVID-19 cases in Africa was rapid and showed large variations across countries.
  Our estimates should be useful in preparedness planning against further spread of the COVID-19 epidemic in Africa.
  Keywords: COVID-19, Reproduction number, Pandemic, Statistical modelling

* Correspondence: daihai.he@polyu.edu.hk
1
 Department of Applied Mathematics, Hong Kong Polytechnic University,
Hong Kong, China
Full list of author information is available at the end of the article

                                       © The Author(s). 2020 Open Access This article is licensed under a Creative Commons Attribution 4.0 International License,
                                       which permits use, sharing, adaptation, distribution and reproduction in any medium or format, as long as you give
                                       appropriate credit to the original author(s) and the source, provide a link to the Creative Commons licence, and indicate if
                                       changes were made. The images or other third party material in this article are included in the article's Creative Commons
                                       licence, unless indicated otherwise in a credit line to the material. If material is not included in the article's Creative Commons
                                       licence and your intended use is not permitted by statutory regulation or exceeds the permitted use, you will need to obtain
                                       permission directly from the copyright holder. To view a copy of this licence, visit http://creativecommons.org/licenses/by/4.0/.
                                       The Creative Commons Public Domain Dedication waiver (http://creativecommons.org/publicdomain/zero/1.0/) applies to the
                                       data made available in this article, unless otherwise stated in a credit line to the data.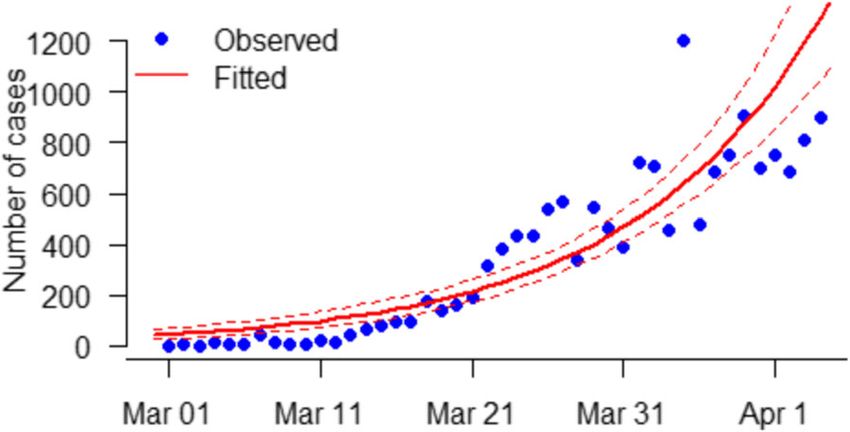
Musa et al. Infectious Diseases of Poverty   (2020) 9:96                                                       Page 2 of 6

Introduction                                                  the basic reproduction number, exponential growth rate
Since early 2020, an outbreak of coronavirus disease          and serial interval [7–11], many of which have shown
2019 (COVID-19), now a pandemic [1–3], caused by the          the R0 ranges from 2.0 to 4.0, and initial under-
severe acute respiratory syndrome coronavirus 2 (SARS-        reporting/under-detection during the early phases of the
CoV-2) [1] has hit the world severely. Many countries         outbreak in Wuhan, China.
are facing a rapid increasing trend of confirmed cases.         The aim of this study is to estimate the exponential
The case-fatality-rate varies wildly from country to          growth rate and the basic reproduction number of the
country. As of 13 April 2020, about 2 million people          COVID-19 at the early stage of the pandemic in Africa,
have been infected with COVID-19 with over 117 000            which should be valuable in informing the official and
death globally (out of which about 90% of the death           public in the preparedness against COVID-19 spread,
cases were from United State and Europe) [1, 4].              forecasting the trend, and highlighting the importance of
   Africa reported its first case of COVID-19 in Egypt on     sustaining strict measures in order to curtail the
14 February 2020 [3, 4]. As of 13 April 2020, a total of      spread of the virus.
15 207 infected cases were reported throughout Africa,
with 831 deaths, giving an overall case fatality rate (CFR)   Methods
of 5.47%, among them only 3 cases reported in February        We obtained the daily number of COVID-19 cases time
2020 [4].                                                     series data in Africa from World Health Organization
   The African region has been described as one of the        (WHO) from 1 March to 19 March 2020 (https://www.
most vulnerable with the COVID-19 infection [3] in the        who.int/emergencies/diseases/novel-coronavirus-2019/
initial phase, due to the fact that Africa is important       situation-reports/) [4]. Although there were three con-
commercial partner of China and as a result, large vol-       firmed cases throughout Africa from 14 February to 29
ume of business people travel to the region. Since the        February 2020, we did not include them as there were
epicenter is now in Europe and Ameria, due to the close       no additional case reported until 1 March 2020. In this
tie between Africa and countries, African countries face      work, we considered the situation from 1 March 2020 as
even bigger threat.                                           the number of cases and death started a steady increas-
   Several control measures have currently been taken by      ing trend.
most of the African countries to prevent/reduce the              Referring to recent studies [7, 8], we model the epi-
spread of COVID-19, especially against case importation       demic curve by employing the exponential growth pro-
from the COVID-19 epicenters. Some of the measures            posed by Ma et al. (2020) [8]. The Poisson likelihood
includes travel ban to and from the most COVID-19 hit         framework is adopted for data fitting and parameter esti-
countries, school closures, temporary ban of gatherings       mation. The intrinsic growth rate (γ) was estimated, and
[3, 5, 6]. Nevertheless, the ability to curtail or reduce     the basic reproduction number R0 computed via R0 = 1/
and control the local transmission after case importation     G(−γ) with 100% susceptibility for COVID-19 presumed
depends largely on how African governments are ser-           [12]. The function G(∙) represents the Laplace transform
iously sustaining the current recommended measures.           and the moment generating function of the probability
Due to the fragile health care system, insufficient health    distribution, for the generation interval (GI, the time be-
workers, lack of water, and sanitizers for maintaining hy-    tween the timing of infections of two successive cases)
giene in the region. African countries need to find their     of the COVID-19 [7, 8, 12]. Note that since GI is not ob-
optimal strategies to stop the spread of COVID-19 in its      servable, we follow conventional approach to use serial
region.                                                       interval (timing between symptom onset of two succes-
   Numerous epidemiological studies have been con-            sive cases) as a proxy of GI. Since the transmission chain
ducted to understand the transmission dynamics of             of COVID-19 in Africa is yet to be fully uncovered, we
COVID-19, which is quantified in two key parameters,          adopted the SI estimated in Zhao et al. [13]. We mod-
the basic reproduction number (the expected number of         elled the distribution of COVID-19 GI as Gamma distri-
secondary cases that may be caused by a typical primary       butions with a mean of 4.7 days and standard deviation
case during his/her infectious period in a wholly suscep-     (SD) of 2.9 days previously estimated by Zhao et al. [11].
tible population, R0) and the serial interval (time delay        Additionally, we quantified the instantaneous trans-
between the symptom onset of a primary case and his/          missibility of the outbreak by the time-varying effective
her secondary case, SI). High reproductive number and         reproductive number. We adopted previous study by
short serial interval imply rapid growth. In the initial      Zhao et al. [13] to estimate the effective reproductive
phase, the epidemic (number of new cases over time)           number following the SI technic. By employing the re-
typically exhibited exponential growth. The basic             newal equation methods as described by [13], we showed
reproduction number is a function of the exponential          the effective reproductive number of some African coun-
growth rate and the serial interval. Studies conducted on     tries with reported data for at least 20 days after
Musa et al. Infectious Diseases of Poverty (2020) 9:96 Page 3 of 6
accuracy of the SI of COVID-19 estimated previously
based on cases from Hong Kong, China [11]. We esti-
mated the basic reproduction number R0 to be 2.37
(95% CI: 2.22–2.51), which is also depending on the esti-
mates of the SI during the early epidemics. Our basic
reproduction numb R0 estimates is significantly larger
than 1 and broadly consistent with recent studies [7,
14–18]. We suggested that the current COVID-19 out-
breaks in Africa could increase rapidly if the measures
were not strictly sustained, which includes temporary
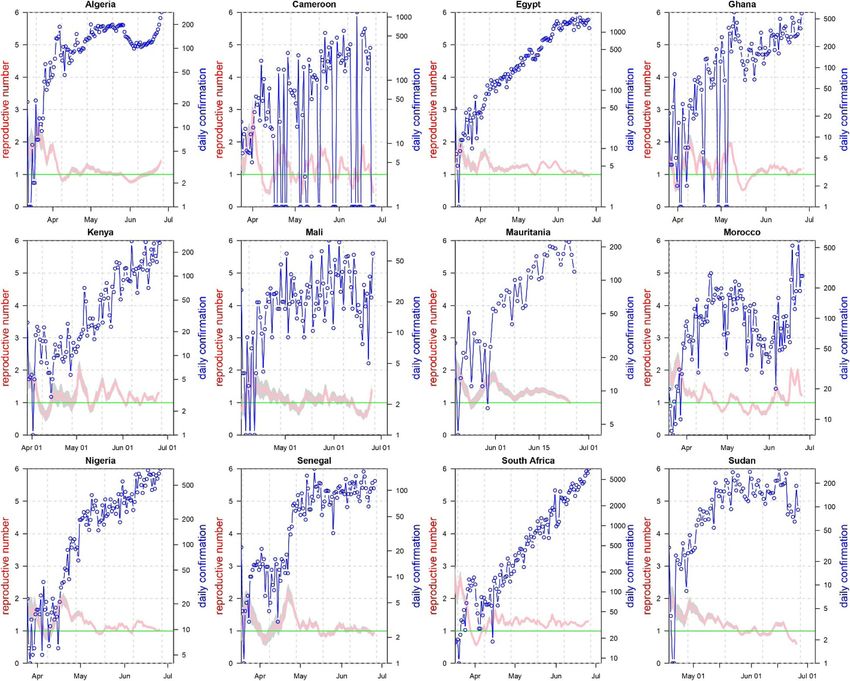
Fig. 1 The observed (dots) and fitted (curves) daily number of bans of international travels, avoiding large gatherings,
COVID-19 cases time series in Africa. The blue dots are observations, practicing social distancing and so on.
and the curves are fitting results. The red bold curve represents the We reported that the mean R0 of COVID-19 in Africa
mean fitting result, and the red dashed curves are the 95%
confidence intervals. Multiple R-squared is 0.76
is likely to be 2.37 which could vary from 2.22 to 2.51
and is consistent with the previous estimates [7, 15, 19,
20]. Denote the infection attack rate (final size of in-
exceeding 20 cumulative cases in order to show the po- fected) as z, then z = 1-exp(−R0z), one may solve z given
tential of COVID-19 to spread across the region. R0 [21] to show this equation is true when the homoge-
All case reporting data for each country (dates and cu- neous mixing assumption holds. Brauer [22] showed that
mulative numbers of cases) were analyzed and presented the actual infection attack rate could be low due to pub-
graphically using the R statistical software (version 3.6.3, lic behavior change and heterogeneity in mixing, for in-
released February 2020, available at https://www.r-pro- stance in the Ebola outbreak, the actual infection attack
ject.org/). rate was much smaller than the theoretical estimates in
ideal situation. With an R0 at 2.37, the theoretical infec-
Results and discussion tion attack rate will be as large as 87%, namely 87% of
The exponential growth fitting results are depicted in Africa will be infected. However, we need to point out
Fig. 1. The fitting results matched the observed daily that the classical final size overestimated the infection
number of cases, which implies that the early outbreak attack rate in the influenza pandemic 1918 and influenza
data in Africa were largely following the exponential pandemic 2009. These two influenza pandemics had R0
growth rate estimated at 0.22 per day (95% CI: 0.20– around 2 and 1.5, respectively. The observed infection
0.24), which is slightly larger than previous estimates [7, attack rate was round 20% in England and Wales, and
9, 14]. Our analysis and estimation of R0 rely on the 10% in Hong Kong, China. Theoretically, the infection
Fig. 2 The reported cumulative death confirmations of COVID-19 in top 12 African countries. The horizontal axis is the days since the cumulative
exceeded 20 in a countryMusa et al. Infectious Diseases of Poverty (2020) 9:96 Page 4 of 6 attack rate could be 80 and 58%, respectively. The case- changing patterns of time-varying reproductive number fatality-rate (CFR) of 1918 was around 2% [23], and thus (Rt) based on the daily confirmations of COVID-19 cases the situation of panic and governmental action was simi- time series in Africa. We used the R package 'EpiEstim' lar to COVID-19 pandemic. While the CFR of 2009 in- to calculate the instantaneous effective reproductive fluenza pandemic was relatively low, there was virtually number of 12 African countries in order to show the po- little-scale or insufficient control. For these two exam- tential of COVID-19 to spread across the region [24]. ples, the expected infection attack rate could be close to After an initial rapid growth in COVID-19 confirmed the 1918, namely 25%. Thus, there is a need to be pre- cases driven by imported cases in the whole Africa, the pared and strict action needs to be taken. reported cases showed steady pattern (with decreased re- We examined the publicly available materials pub- productive number) in many Africa countries which lished by the WHO (WHO, 2020a) to show the potential could be due to the limited diagonostic testing. of COVID-19 to spread without sustaining strict health We suggested that the likely factors responsible for the measures (Fig. 2). We observed the daily confirmations rapid increase in the number of confirmed cases in these of the COVID-19 death cases in 12 African countries countries is presumably linked with proportion of popu- that reported data for at least 20 days after exceeding 20 lation in Africa doing international trade with foreign cumulative cases. Thus, we fitted the cumulative confir- countries (e.g., China, Germany, Italy and US), also the mations of 12 African countries starting from the date level of vulnerability of African countries as described by when cumulative exceeded 20. In Fig. 3, we showed the Gilbert et al. [3], i.e., countries with the highest Fig. 3 The reported cases (blue cicle line) and the time-varying reproductive number (the three solid lines are the median and 95% CI) for the 12 African countries with top number of COVID-19 deaths. CI: Confidence interval
Musa et al. Infectious Diseases of Poverty           (2020) 9:96                                                                                            Page 5 of 6

importation risk (such as Egypt, Algeria, and South Af-                            2.    World Health Organization. WHO director-general’s remarks at the media
rica) followed by countries at moderate risk (such as                                    briefing on COVID-19 – 11 March 2020. 2020. https://www.who.int/dg/
                                                                                         speeches/detail/who-director-general-s-opening-remarks-at-the-media-
Nigeria, Ethiopia, Sudan, Angola, Tanzania, Ghana, and                                   briefing-on-covid-19%2D%2D-11-march-2020. Accessed 28 April, 2020.
Kenya) and then others. This further shows that Africa                             3.    Gilbert M, Pullano G, Pinotti F, Valdano E, Poletto C, et al. Preparedness and
is one of the most vulnerable region for the COVID-19                                    vulnerability of African countries against importations of COVID-19: a
                                                                                         modelling study. Lancet. 2020;395:871–7. https://doi.org/10.1016/S0140-
pandemic, indicating that there is a need of taking more                                 6736(20)30411-6.
serious control measures based on the recommendation                               4.    World Health Organization. Coronavirus disease (COVID-19) situation reports.
of WHO and other heath related bodies to curtail the                                     2020. https://www.who.int/emergencies/diseases/novel-coronavirus-2019/
                                                                                         situation-reports/. Assessed 10 April, 2020.
spread of COVID-19 in Africa.                                                      5.    World Health Organization. Regional Office for Africa. WHO ramps up
                                                                                         preparedness for novel coronavirus in the African region. 2020. https://
Conclusions                                                                              www.afro.who.int/news/who-ramps-preparedness-novel-oronavirus-
                                                                                         africanregion. Accessed 16 March, 2020.
We estimated the exponential growth rate at 0.22 per                               6.    Nigeria Center for Disease Control. Coronavirus disease (COVID-19) situation
day. We estimated the mean R0 of COVID-19 in Africa                                      reports. 2020. https://ncdc.gov.ng/. Assessed 5 April , 2020.
at 2.37 with a constant testing effort assumed. We                                 7.    Zhao S, Lin Q, Ran J, Musa SS, Yan G, Wang W, et al. Preliminary estimation
                                                                                         of the basic reproduction number of novel coronavirus (2019-nCoV) in
highlighted the importance of sustaining strict health                                   China, from 2019 to 2020: a data-driven analysis in the early phase of the
measures in order to contain the virus within a shortest                                 outbreak. Int J Infect Dis. 2020;92:214–7. https://doi.org/10.1016/j.ijid.2020.01.
possible time.                                                                           050.
                                                                                   8.    Ma J. Estimating epidemic exponential growth rate and basic reproduction
Abbreviations                                                                            number. Infect Dis Model. 2020;5:129–41. https://doi.org/10.1016/j.idm.2019.
R0: Basic reproduction number; CI: Confidence interval; CFR: Case fatality rate;         12.009.
γ: Intrinsic growth rate; G(∙): Moment generating function of the probability      9.    Nishiura H, Linton NM, Akhmetzhanov AR. Serial interval of novel
distribution; GI: Generation interval; SD: Standard deviation                            coronavirus (COVID-19) infections. Int J Infect Dis. 2020. https://doi.org/10.
                                                                                         1016/j.ijid.2020.02.060.
                                                                                   10.   Du Z, Xu X, Wu Y, Wang L, Cowling BJ, et al. The serial interval of COVID-19
Acknowledgements
                                                                                         from publicly reported confirmed cases. medRxiv. 2020. https://doi.org/10.
No
                                                                                         1101/2020.02.19.20025452.
                                                                                   11.   Zhao S, Gao D, Wu Y, Zuang Z, Chong M, et al. Estimating the serial interval
Authors’ contributions
                                                                                         of novel coronavirus disease (COVID-19): A statistical analysis using the
SSM and SZ conceived the study. SSM, SZ and DH conducted the research
                                                                                         public data in Hong Kong from January 16 to February 15, 2020. medRxiv.
and wrote the draft. MHW, AGH and UTM critically revised the manuscript,
                                                                                         2020. https://doi.org/10.1101/2020.02.21.20026559.
and all authors approved the submission.
                                                                                   12.   Wallinga J, Lipsitch M. How generation intervals shape the relationship
                                                                                         between growth rates and reproductive numbers. Proc R Soc B Biol Sci.
Funding                                                                                  2007;274(1609):599–604.
DH was supported by General Research Fund (Grant Number 15205119) of               13.   Zhao S, Lefei L, He D, Qin J. Public awareness, news promptness and the
the Research Grants Council (RGC) of Hong Kong, China and Alibaba (China)                measles outbreak in Hong Kong from march to April, 2019. Infect Dis Ther.
Co. Ltd. Collaborative Research project (P0031768).                                      2020;0(0):1–7. https://doi.org/10.1080/23744235.2020.1717598.
                                                                                   14.   Li Q, Guan X, Wu P, Wang X, Zhou L, et al. Early transmission dynamics in
Availability of data and materials                                                       Wuhan, China, of novel coronavirus-infected pneumonia. New Engl J Med.
All data used are from public domains.                                                   2020. https://doi.org/10.1056/NEJMoa2001316.
                                                                                   15.   World Health Organization. Laboratory testing for 2019 novel coronavirus
Ethics approval and consent to participate                                               (COVID-19) in suspected human cases. 2020. https://www.who.int/health-
Not applicable.                                                                          topics/coronavirus/laboratory-diagnostics-fornovel-coronavirus. Accessed 13
                                                                                         April, 2020.
Consent for publication                                                            16.   Wu JT, Leung K, Leung GM. Nowcasting and forecasting the potential
Not applicable.                                                                          domestic and international spread of the 2019-nCoV outbreak originating in
                                                                                         Wuhan, China: a modelling study. Lancet. 2020. https://doi.org/10.1016/
Competing interests                                                                      S0140-6736(20)30260-9.
DH was supported by Alibaba (China) Co. Ltd. Collaborative Research project.       17.   Zhao S, Musa SS, Lin Q, Ran J, Yang G, Wang W, et al. Estimating the
Other authors declared no conflict of interest.                                          unreported number of novel coronavirus (2019-nCoV) cases in China in the
                                                                                         first half of January 2020: a data driven modelling analysis of the early
Author details                                                                           outbreak. J Clin Med. 2020;9:388. https://doi.org/10.3390/jcm9020388.
1
 Department of Applied Mathematics, Hong Kong Polytechnic University,              18.   Riou J, Althaus CL. Pattern of early human-to-human transmission of Wuhan
Hong Kong, China. 2Department of Mathematics, Kano University of Science                 2019 novel coronavirus (2019-nCoV), December 2019 to January 2020.
and Technology, Wudil, Nigeria. 3JC School of Public Health and Primary                  Eurosurveillance. 2020;25(4). https://doi.org/10.2807/1560-7917.ES.2020.25.4.
Care, Chinese University of Hong Kong, Hong Kong, China. 4Shenzhen                       2000058.
Research Institute of Chinese University of Hong Kong, Shenzhen, China.            19.   Imai N, Dorigatti I, Cori A, Riley S, Ferguson NM. Estimating the potential
5
 Collage of Health Sciences, Bayero Unuversity, Kano, Nigeria. 6Department               total number of novel coronavirus (2019-nCoV) cases in Wuhan City. China:
of Mathematics, Federal University Dutse, Dutse, Nigeria.                                Preprint published by the Imperial College London; 2020. https://www.
                                                                                         imperial.ac.uk/mrc-global-infectious-disease-analysis/news–wuhan-
Received: 1 April 2020 Accepted: 8 July 2020                                             coronavirus/.
                                                                                   20.   Read JM, Bridgen JR, Cummings DA, Ho A, Jewell CP. Novel coronavirus
                                                                                         2019-nCoV: early estimation of epidemiological parameters and epidemic
References                                                                               predictions. medRxiv. 2020; 2020.2001.2023.20018549. https://doi.org/10.
1. World Health Organization. Coronavirus disease (COVID-19) pandemic. 2020.             1101/2020.01.23.20018549.
    https://www.who.int/emergencies/diseases/novel-coronavirus-2019.               21.   Ma J, Earn DJ. Generality of the final size formula for an epidemic of a
    Assessed 28 April, 2020.                                                             newly invading infectious disease. Bull Math Biol. 2006;68(3):679–702.
Musa et al. Infectious Diseases of Poverty (2020) 9:96 Page 6 of 6
22. Brauer F. The final size of a serious epidemic. Bull Math Biol. 2019;81(3):
869–77.
23. Paulo AC, Correia-Neves M, Domingos T, Murta AG, Pedrosa J. Influenza
infectious dose may explain the high mortality of the second and third
wave of 1918–1919 influenza pandemic. PLoS One. 2010;5(7):e11655.
https://doi.org/10.1371/journal.pone.0011655.
24. Cori A, Ferguson NM, Fraser C, Cauchemez S. A new framework and
software to estimate time-varying reproduction numbers during epidemics.
Amer j epid. 2013;178(9):1505–12.You can also read