CHESTNUT COVER AUTOMATIC CLASSIFICATION THROUGH LIDAR AND SENTINEL-2 MULTI-TEMPORAL DATA
←
→
Page content transcription
If your browser does not render page correctly, please read the page content below
ISPRS Annals of the Photogrammetry, Remote Sensing and Spatial Information Sciences, Volume V-3-2020, 2020
                                               XXIV ISPRS Congress (2020 edition)

        CHESTNUT COVER AUTOMATIC CLASSIFICATION THROUGH LIDAR AND
                     SENTINEL-2 MULTI-TEMPORAL DATA

                                                  L. Alonso 1, J. Armesto 1*, J. Picos 1
  1
      Forestry Engineering School, University of Vigo, A Xunqueira campus, Pontevedra, 36005, Spain –(laura.alonso.martinez, julia,
                                                            jpicos)@uvigo.es

                                                      Commission III, WG III/10

KEY WORDS: Sentinel 2, multi-temporal analysis, chestnut cover, LiDAR, forest, remote sensing

ABSTRACT:

Chestnut (Castanea sativa Mill.) managed forests in Galicia (Northwestern Spain) have important cultural, economic and ecosystem
values. However, due to rural exodus chestnut stands are being degraded. In order to take restoration and conservation measures
knowledge of these forests' location, expanse and stage is needed. The available Spanish official cartography is based on
photointerpretation which is inaccurate in terms of chestnut forest location and classification. However, remote sensing has recently
been proven to be an effective tool for this purpose. Sentinel 2 multi-temporal classification is recently acquiring importance as a
method to classify tree species. This project intends to detect chestnut forests using LiDAR and Sentinel 2 multi-temporal data and to
compare these results with those obtained using the official cartography. It also intends to assess how the use of different
phenological stages could improve classification results. The results obtained provide an overall accuracy of 76% when a three-
month combination is used: (March, July and September) leaf-off stage, flowering and leaf-on stage. Overlapping of the current map
and the official cartography lead to an accuracy and precision increase; highlighting the utility of the presented methodology to
acquire knowledge about chestnut forests location.

                      1. INTRODUCTION                                  polygons where the type of forest, along with its principal and
                                                                       secondary species composition are indicated. Chestnut forest
Information about forest resource distribution remains essential       pure stands are classified as a “castañar” type of forest.
for policy makers and land management. European chestnut               However, when mapping chestnut forest stands, the method and
(Castanea sativa Mill.) covers more than 2.5 million ha in             resolution used can become a problem leading to surface
Europe of which 98.3 % are managed forests used for wood or            overestimation or underestimation. This compromises decision
fruit production purposes (Conedera et al., 2004). Since the first     making when it comes to chestnut production or conservation
half of the last century, a decreased importance of this species       measures.
as a staple food and a progressive depopulation of rural areas
has caused the abandonment of chestnut agriculture (Zlatanov et        Nowadays, tree species distribution can be acquired using
al., 2013), an abandonment which has been accelerated due to           remote sensing techniques. Medium spatial resolution satellites
pathogens (Baser and Bozoglu, 2020) and invasive species               (especially Landsat 8 and Sentinel 2) are the most cost-efficient
(Battisti et al., 2014). However, in recent decades chestnut tree      tool and the current trend in tree-species-classification-related
management has once again become viable and shows great                studies (Fassnacht et al., 2016). Of the open-data satellites,
potential as a source of income thanks to research in biological       Sentinel 2 is the one which obtains images with the highest
control and genetics (Acquadro et al., 2019; Trapiello et al.,         spatial resolution (10 m to 20 m) and the highest spectral
2017). Galician chestnut forests (Northwestern Spain) have             resolution (up to 13 bands). Three of the 13 bands are red edge
been managed for chestnut production for centuries (Fernández          bands, which are not available from satellites like Landsat, and
et al., 1998). The result is forests with important ecological,        have been shown to be important in tree species classification
ecosystem and cultural values. In recent years, rural                  (Immitzer et al., 2016). The free availability and the high revisit
abandonment has led to stand degradation and to a loss of              time (5 days) of these satellites, which allow for the acquisition
knowledge of their distribution. However these stands still have       of multiple images corresponding to different vegetation stages
the potential to become an important source of income for rural        at the same area, has recently led to the incorporation of multi-
areas and to keep providing ecosystem, recreational and cultural       temporal analysis to vegetation classification related studies
services (Roces-Díaz et al., 2018). In order to recover the            (Fassnacht et al., 2016). These analyses are especially suitable
ecosystem, knowledge of its current expanse and stage is               for boreal and temperate climates where changes in plant
needed. The current official source of forest location,                phenology throughout the year can help to discriminate between
distribution, expanse and classification in Spain is the Spanish       different species.
Forest Map (MFE). The Spanish cartographic official source
(MFE) is elaborated through photointerpretation and field work         In addition to satellite images, LiDAR sensors play an
on a 1:25000 scale (Miteco, 2014). It consists of a set of             important role in land cover classification as well. Thanks to

* Corresponding author

           This contribution has been peer-reviewed. The double-blind peer-review was conducted on the basis of the full paper.
                       https://doi.org/10.5194/isprs-annals-V-3-2020-425-2020 | © Authors 2020. CC BY 4.0 License.                    425
ISPRS Annals of the Photogrammetry, Remote Sensing and Spatial Information Sciences, Volume V-3-2020, 2020
                                             XXIV ISPRS Congress (2020 edition)

their ability to estimate vegetation height they are a tool that     images were selected in order to perform the study. Images
efficiently discriminates classes with spectral similitudes (Sothe   corresponding to the 2A product were used (European Space
et al., 2018). Recently available LiDAR data on National             Agency (ESA), 2015).
Geographic databases have led to the incorporation of this
technology in vegetation studies (Barrett et al., 2016).                             Central                            Spatial
                                                                        Band         wavelength     Bandwidth (nm)      resolutio
This study aims to classify areas covered by chestnut forests and                    (nm)                               n (m)
to analyze the potential of using multi-temporal information for          Band 1         443                20              60
this purpose. It also intends to provide a tool which can be used         Band 2         490                65              10
to improve the accuracy of the official cartography based on              Band 3         560                35              10
open-access data. Therefore, comparisons between the official             Band 4         665                30              10
maps and the results obtained from this study will be performed.          Band 5         705                15              20
                                                                          Band 6         740                15              20
                                                                          Band 7         783                20              20
                       2. MAIN BODY                                       Band 8         842               115              10
                                                                         Band 8A        865                 20              20
The study area is in Galicia (Northwestern Spain). Although               Band 9         945                20              60
knowledge of chestnut location and expanse is relevant in the            Band 10        1375                30              60
whole Galician region, a small study area was selected to                Band 11        1610                90              20
develop the method and study its potential. The selected area            Band 12        2190               180              20
was the municipality of Folgoso do Courel, due to its
abundance of chestnut managed forests. The municipality                Table 1. Specifications of Sentinel 2 bands provided by ESA
covers an area of 193 km2 and is a mountainous area with small,                  (European Space Agency (ESA), 2015)
steep valleys with different aspects. (See Figure 1)
                                                                     Images covering different phenological stages of the vegetation
                                                                     were used. Initially images from every season and every month
                                                                     were evaluated in order to optimize the multi-temporal analysis.
                                                                     However several months were finally discarded due to the
                                                                     presence of too much clouds, snow and shadows. The selected
                                                                     images for the analysis dated from March, May, July and
                                                                     September. The specific dates were: 26/03/2019, 05/05/2019,
                                                                     19/07/2019 and 12/09/2019. Bands with 20 m and 10 m of
                                                                     spatial resolution were selected from all of the images obtained.
                                                                     Resampling on 10 m bands was performed in order to have a
                                                                     common resolution of 20 m across all bands.
  Figure 1. Study area. Background image hillshade and slope
obtained from the Spanish Cartographical Institute (IGN, 2019).      LiDAR data were obtained from the Spanish Geographical
                                                                     Information System (IGN). Data is freely available. LiDAR
The area is covered fundamentally by temperate mixed forest          point clouds were acquired in 2016 using an airborne laser
including 237 different species of dicotyleoneous plants             scanner (ALS). The sensor was a LEICA ALS80 which allowed
(Quercus pyrenaica, Betula alba, Quercus suber, Quercus              for a nominal point density of 0.5 points/m2. Georeferecing was
robur, Fagus sylvatica, Alnus glutinosa, Corylus avellana, Ilex      executed on the ETRS89 georeference system with a Root
acquifolium, Juglans regia, Prunus avium, Salix sp., Fraxinus        Mean Square Error (RMSE) of 0.3 m in the horizontal
sp.,...).The region's climate has a mediterranean influence,         directions and 0.2 m in the vertical directions (Miteco, 2019).
therefore species such as Quercus ilex can be found as well.
However, Castanea sativa pure stands, due to management,
cover an important part of the area. There are plantations of        2.2 Methodology
coniferous trees as well, mainly of: Pinus pinaster, Pinus
radiata and Pinus sylvestris. (Xunta de Galicia/USC, 2005.)          The present study methodology is based on an image
                                                                     classification process. However, as the study area has other land
Chestnut phenology in the study area is not homogeneous due          covers besides forest, a study area filtering step was performed
to differences in height and aspect. These variations are            using LiDAR data. Only areas with a height tall enough to be a
increased due to the presence of different chestnut cultivars        forest were selected. The selected height threshold was 10 m,
(Pereira-Lorenzo et al., 2001). However, as a general guideline      based on analyses of the heights of chestnut areas. This step was
senescence occurs in November (assessed through field work),         performed using a calculated CHM (Canopy height model). To
sprouting from mid to late May according to local forest             obtain the CHM, ground points were identified on the LiDAR
technicians and blooming from mid-June to late July                  point cloud and for the rest of the points the height above the
(Fernández-López et al., 2013).                                      ground was computed. This allowed for the generation of a
                                                                     normalized point cloud from which the CHM was created.
2.1 Data acquisition and analysis                                    CHM resolution was selected accordingly to match one of the
                                                                     Sentinel images (20 m). Pixels with a height value below 10 m
Sentinel 2 is one of the ESA's (European Space Agency)               were erased from the study area.
satellites constellations equipped with a multispectral camera. It
samples 13 spectral bands, which range from a 10 m to a 60 m         Different Sentinel 2 band combinations were created and
spatial resolution. The temporal resolution is up to 5 days.         visually analyzed to assess differences between seasons. Figure
Table 1 shows the Spectral bands specifications. Sentinel 2          2 shows the combination of bands 11/8A/4 for the selected

         This contribution has been peer-reviewed. The double-blind peer-review was conducted on the basis of the full paper.
                     https://doi.org/10.5194/isprs-annals-V-3-2020-425-2020 | © Authors 2020. CC BY 4.0 License.                    426
ISPRS Annals of the Photogrammetry, Remote Sensing and Spatial Information Sciences, Volume V-3-2020, 2020
XXIV ISPRS Congress (2020 edition)
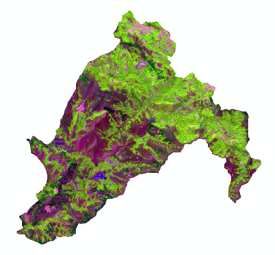
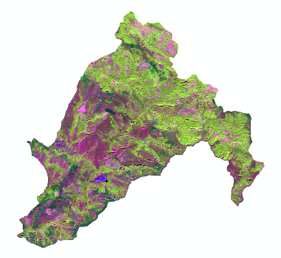
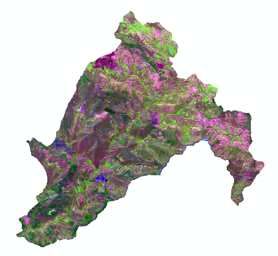
months where it is possible to see the variations in radiometry Castanea sativa Quercus pyrenaica
over the course of the seasons, especially between March-May
and July-September.
(a) (b)
Mixed forest Quercus ilex
(c) (d)
Pinus sp.
Figure 2. Sentinel band combination (11/8A/4) for images Figure 3. Sentinel 2 bands combination 11/8A/4 for March
obtained in different months in the Municipality of Folgoso do images.
Courel. (a) March (b) May (c) July (d) September
Random forest models were applied to the whole study area. A
A multi-temporal classification approach was chosen as it has cross-validation was performed in order to explore multi-
been shown that there is a potential for differences in temporal results and to select the most efficient model. For this
radiometry due to phenology. The algorithm employed was purpose, 100 random points were selected within the study area.
Breiman’s Random Forest (Breiman, 2001). The Random Random points ground truth was obtained from
Forest is an algorithm that is extensively and successfully photointerpretation of the PNOA image (PNOA, 2019).
employed in other multi-temporal vegetation-classification-
related studies such as (Hościło and Lewandowska, 2019) and Once the most accurate model was selected, results were cross-
(Persson et al., 2018a). To carry out the multi-temporal study referenced with the official cartography of the study area in
several models based on the different month combinations were order to assess the differences.
created. In order to acquire information about the relevance of
including several months in the classification, four models were 2.3 Results and discussion
also created using just one month for contrast.
Cross-validation of the results acquired by random forest
The Random forest algorithm was provided for training areas. modelling reveals differences between the results obtained
There were two classes of training areas: chestnut and others. when using different months as predictive variables. These
Others included the rest of forested areas present in the study results are presented in Table 3. A higher overall accuracy
area area such as other broadleaf forests and coniferous forests. (76%) was obtained when using a combination of three months
Training areas were created through field work. Random to create the model. The effectiveness of Sentinel 2 time series
transects were created on the road-accessible parts of the study has been noted previously in multiple projects (Grabska et al.,
area in order to look for pure stands that would be suitable 2019; Hościło and Lewandowska, 2019; Persson et al., 2018).
training areas. Care was taken to ensure the transects covered Previously mentioned studies classified forest stands according
different aspects, heights and slopes. Training area locations to all of the species present in an area using multi-temporal
were marked with a GPS with centimeter accuracy (GEOMAX images and they obtained accuracies close to 85% when using
Zenith15). Finally, a set of 73 polygons were marked: 48 the best month combinations. Accuracies obtained in this case
corresponding to other tree covers (Pine sp., Quercus ilex, study are lower (around 10%). However, it was difficult to find
Quercus pyrenaica, Betula alba, Alnus glutinosa,…) and 25 pure stands of other broadleaves in order to have enough
corresponding to chestnut forests (Castanea sativa). Bands training areas. Future studies should focus on increasing field
combinations on different months were created to asses work efforts for this purpose.
differences on radiometric answer between species and months.
Figure 3 is an example of this step results. There it is possible to Comparing cases where higher and lower Overall Accuracies
see band combination 11/8A/4 result on different forests for were obtained, differences accounted for less than a 10%.
March image. Colorations result allow to see that there are Larger differences exist in Users and Producers Accuracy.
differences between species radiometric behaviour. Several of the models do not allow an excess of 50% for these
values, which could result in a random prediction of a class.
Single month models for July and September periods are the
least accurate. However, these months combined with March
(Model 5) provide the best result. According to results, March
This contribution has been peer-reviewed. The double-blind peer-review was conducted on the basis of the full paper.
https://doi.org/10.5194/isprs-annals-V-3-2020-425-2020 | © Authors 2020. CC BY 4.0 License. 427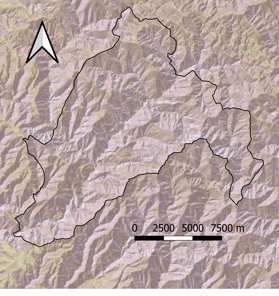
ISPRS Annals of the Photogrammetry, Remote Sensing and Spatial Information Sciences, Volume V-3-2020, 2020
                                             XXIV ISPRS Congress (2020 edition)

and May are important months for the prediction of chestnut          shows an example of an area that is not covered by trees that is
presence, revealing the importance of including images from          included in the MFE chestnut polygons. Figure 6 shows an
senescence periods. Persson et al. (Persson et al., 2018) also       example of other tree covers that are included in the MFE
note the importance of the leaf-off period, however they             chestnut polygons. Figure 7 shows an example of an area
attribute it to images from early senesce which couldn't be          classified as a chestnut area by Model 5 but that is not included
included in this study due to cloud and shadow problems. They        in the MFE chestnut polygons.
confirm that adding leaf-on periods helps to improve these
results as well. However, in order to perform a better
interpretation of the results it would be necessary to obtain
phenology information about the rest of the broadleaves present
in the study area.

ID     Months            OA      UA        UA      PA        PA
                         (%)     (%)       (%)     (%)       (%)
                                 other     cast    other     cast
1      MA+MR+J+S         75      79        60      87        53
2      MA+MR+J           70      75        50      70        67
3      MA+ MR+S          74      79        58      86        46
4      MA+ J+ S          76      78        65      90        43        Figure 5. Model 5 classification results overlapped with the
5      MR+ J+ S          76      83        59      81        63         MFE. The figure shows how the MFE polygons cover non-
6      MA+ MR            74      78        59      87        43        forested areas. Red lines represent the MFE polygons. Pink-
7      MA+J              71      76        52      85        50         colored areas are areas classified as chestnut while green-
8      MA+ S             72      76        55      88        67       colored areas are classified as others. PNOA Reference image
9      MR+ J             74      83        55      78        63                                (PNOA, 2016)
10     MR+ S             73      84        54      75        67
11     J+S               71      84        51      73        67
12     MA                75      75        72      95        26
13     MR                74      84        56      77        67
14     J                 68      82        47      70        63
15     S                 67      81        46      69        63

Table 3. Random forest models performance. MR (March), MA
 (May), J (July), S (September), OA (Overall Accuracy), UA
  (Users Accuracy), PA (Producers Accuracy), cast (chestnut            Figure 6. Left: Model 5 classification results overlapped with
                   class), other (other class).                          the MFE. Right: Field work picture. The figure shows an
                                                                      example of forest areas wrongly classified as chestnut forest by
Model 5 revealed that chestnut cover in the Municipality of           the MFE. Red lines represent the MFE polygons. Pink-colored
Folgoso do Courel amounts to 2,677 ha. Figure 4 shows the             areas are areas classified as chestnut while green-colored areas
results obtained.                                                     are classified as others. PNOA Reference image (PNOA, 2016)

                                                                       Figure 7. Left: Model 5 classification results overlapped with
                                                                         the MFE. Right: Field work picture. The figure shows an
  Figure 4. Chestnut mapping results obtained with Model 5.              example of chestnut forest areas not included in the MFE
Background image: DTM (Digital Terrain Model) 5 m obtained             chestnut polygons. Pink-colored areas are areas classified as
    from the Spanish Cartographical Institute (IGN, 2019).              chestnut while green-colored areas are classified as others.
                                                                                  PNOA Reference image (PNOA, 2016).
The MFE chestnut area estimation greatly differs from the
results presented in this study. The MFE polygons of chestnut        The comparisons performed suggest that the present
pure stands cover an area of 3,208 ha. When overlapped, the          methodology based on remote sensing techniques can improve
MFE and Model 5 only match on 42% of the area (1,359 ha).            the Spanish official cartography. The potential of remote
The remaining 58% (916 ha) are classified as other tree species.     sensing to improve the currently-available information about
On the other hand, there are 402 ha of chestnut according to the     Spanish forests has been claimed before by (Gómez et al.,
MFE that are in fact not covered by forest. According to Model       2019), therefore the present is a case study which supports this
5, 1,318 ha of chestnut forest are not currently classified by the   statement. The methodology appears to be replicable in other
official cartography. The results of these comparisons were          study areas, however the presence of different tree species could
evaluated through field work and photointerpretation. Figure 5       affect the results.

         This contribution has been peer-reviewed. The double-blind peer-review was conducted on the basis of the full paper.
                     https://doi.org/10.5194/isprs-annals-V-3-2020-425-2020 | © Authors 2020. CC BY 4.0 License.                  428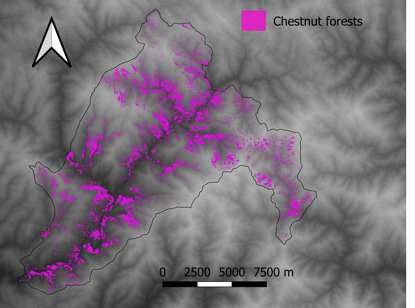
ISPRS Annals of the Photogrammetry, Remote Sensing and Spatial Information Sciences, Volume V-3-2020, 2020
                                             XXIV ISPRS Congress (2020 edition)

                     3. CONCLUSIONS                                  European Space Agency (ESA), 2015. Sentinel-2 user
                                                                     handbook. ESA
Sentinel 2 multi-temporal analysis through random forest
algorithms linked with LiDAR data has been shown to be an            Fassnacht, F.E., Latifi, H., Stereńczak, K., Modzelewska, A.,
efficient tool for performing chestnut forest cartography. The       Lefsky, M., Waser, L.T., Straub, C., Ghosh, A., 2016. Review
main advantages of the proposed methodology are the use of           of studies on tree species classification from remotely sensed
open-access data and the use of an automatic process. However,       data.      Remote      Sens.      Environ.     186,     64–87.
in some situations dependence on training areas could be an          https://doi.org/10.1016/j.rse.2016.08.013
issue.
The inclusion of months with different phenological stages            Fernández de Ana-Magán, F.J., Verde Figueiras, M.C.,
helps to increase mapping accuracy, as previous studies have         Rodríguez Fernández, A., 1998. O souto un ecosistema en
indicated. However, the acquisition of data for the wide range       perigo. Xunta de Galicia.
of months needed to carry out a complete analysis of the
potential of multi-temporal approach for the detection of            Fernández-López, J., Furones-Pérez, M., Fernández-Cruz, J.,
chestnut plantations was hindered by the presence of shadows         Míguez-Soto, B., 2013. Variedades para os soutos novos.
due to the topography and climatic conditions of the study area.     Xunta de Galicia.
Further studies should try to record a wide range of months.
Additionally, they should focus on links between the results         Gómez, C., Alejandro, P., Hermosilla, T., Montes, F., Pascual,
obtained and the different species phenology in order to draw        C., Ruiz, L.A., Álvarez-Taboada, F., Tanase, M., Valbuena, R.,
conclusions about which are the most critical phenological           2019. Remote sensing for the Spanish forests in the 21st
stages to include.                                                   century: a review of advances, needs, and opportunities. For.
On the other hand, chestnut forests in the municipality of           Syst. Vol 28, No 1. https://doi.org/10.5424/fs/2019281-14221
Folgoso do Courel were detected and more accurately estimated
using new methodologies than by using the official cartography       Grabska, E., Hostert, P., Pflugmacher, D., Ostapowicz, K.,
sources, showing that new methods are available that could           2019. Forest stand species mapping using the sentinel-2 time
improve the official cartography. At the same time, a ready-to-      series. Remote Sens. 11. https://doi.org/10.3390/rs11101197
use product was obtained which can be used as a decision-
making tool when it comes to chestnut forest management.             Hościło, A., Lewandowska, A., 2019. Mapping forest type and
                                                                     tree species on a regional scale using multi-temporal sentinel-2
                 ACKNOWLEDGEMENTS                                    data. Remote Sens. 11. https://doi.org/10.3390/rs11080954
This project was funded by the Galician Government, Regional         IGN (Instituto Geográfico Nacional), Gobierno de España,
Ministry of Rural Areas.                                             2019. http://www.ign.es/web/ign/portal/ide-area-nodo-ide-ign
                                                                     (Accessed on 29/01/2020)
                       REFERENCES
                                                                     Immitzer, M., Vuolo, F., Atzberger, C., 2016. First experience
Acquadro, A., Torello Marinoni, D., Sartor, C., Dini, F.,            with Sentinel-2 data for crop and tree species classifications in
Macchio, M., Botta, R., 2019. Transcriptome characterization         central          Europe        Remote           Sens.          8.
and expression profiling in chestnut cultivars resistant or          https://doi.org/10.3390/rs8030166
susceptible to the gall wasp Dryocosmus kuriphilus. Mol.
Genet.             Genomics          295,         107–120.           Miteco, 2014. Mapa Forestal de España a escala 1:25.000
https://doi.org/10.1007/s00438-019-01607-2                           (MFE25).                  https://www.mapa.gob.es/es/desarrollo-
                                                                     rural/temas/politica-forestal/inventario-cartografia/mapa-
Barrett, F., McRoberts, R.E., Tomppo, E., Cienciala, E., Waser,      forestal-espana/mfe_25.aspx. (Accessed on 29/01/2020)
L.T., 2016. A questionnaire-based review of the operational use
of remotely sensed data by national forest inventories. Remote       Pereira-Lorenzo, S., Ramos-Cabre, A.M., Díaz-Hernández, B.,
Sens. Environ. https://doi.org/10.1016/j.rse.2015.08.029             Ascasíbar-Errasti, J., Sau, F., Ciordia-Ara, M., 2001. Spanish
                                                                     chestnut      cultivars.    Hort.     Sci.    36,    344–347.
Baser, U., Bozoglu, M., 2020. Chestnut blight and technical          https://doi.org/10.21273/hortsci.36.2.344
efficiency in chestnut production: Case study of Aydin
Province,      Turkey.      Sci.    Hortic.   263, 109048.           Persson, M., Lindberg, E., Reese, H., 2018a. Tree species
https://doi.org/10.1016/j.scienta.2019.109048                        classification with multi-temporal Sentinel-2 data. Remote Sens.
                                                                     10. https://doi.org/10.3390/rs10111794
Battisti, A., Benvegnù, I., Colombari, F., Haack, R.A., 2014.
Invasion by the chestnut gall wasp in Italy causes significant       PNOA, 2016. Plan Nacional de observación del territorio,
yield loss in Castanea sativa nut production. Agric. For.            Gobierno de España. https://pnoa.ign.es/presentacion (Accessed
Entomol. 16, 75–79. https://doi.org/10.1111/afe.12036                on 31/01/2020)
Breiman, L., 2001. Random Forest. Mach. Learn. 45, 5–32.             USC/Xunta de Galicia, 2005. PORN (Proyecto de ordenación
https://doi.org/10.1017/CBO9781107415324.004                         de los recursos naturales) Espacio Natural protegido Os Ancares
                                                                     - O courel. Xunta de Galicia
Conedera, M., Manetti, M., Giudici, F., Amorini, E., 2004.
Distribution and economic potential of the Sweet chestnut            Roces-Díaz, J. V., Díaz-Varela, E.R., Barrio-Anta, M., Álvarez-
(Castanea sativa Mill.) in Europe. Ecol. Mediterr. 30, 179–193.      Álvarez, P., 2018. Sweet chestnut agroforestry systems in north-
                                                                     western Spain: Classification, spatial distribution and an

         This contribution has been peer-reviewed. The double-blind peer-review was conducted on the basis of the full paper.
                     https://doi.org/10.5194/isprs-annals-V-3-2020-425-2020 | © Authors 2020. CC BY 4.0 License.                  429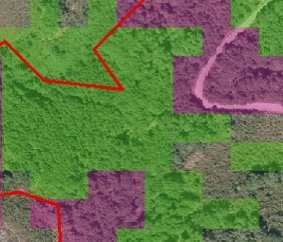
ISPRS Annals of the Photogrammetry, Remote Sensing and Spatial Information Sciences, Volume V-3-2020, 2020
                                             XXIV ISPRS Congress (2020 edition)

ecosystem services assessment. For.          Syst.   27,   1–14.
https://doi.org/10.5424/fs/2018271-11973

Trapiello, E., Rigling, D., González, A.J., 2017. Occurrence of
hypovirus-infected Cryphonectria parasitica isolates in northern
Spain: an encouraging situation for biological control of
chestnut blight in Asturian forests. Eur. J. Plant Pathol. 149,
503–514. https://doi.org/10.1007/s10658-017-1199-4//

Zlatanov, T., Schleppi, P., Velichkov, I., Hinkov, G.,
Georgieva, M., Eggertsson, O., Zlatanova, M., Vacik, H., 2013.
Structural diversity of abandoned chestnut (Castanea sativa
Mill.) dominated forests: Implications for forest management.
For.         Ecol.          Manage.          291,       326–335.
https://doi.org/https://doi.org/10.1016/j.foreco.2012.11.015

         This contribution has been peer-reviewed. The double-blind peer-review was conducted on the basis of the full paper.
                     https://doi.org/10.5194/isprs-annals-V-3-2020-425-2020 | © Authors 2020. CC BY 4.0 License.                430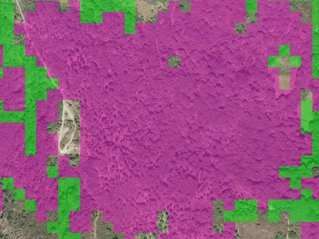
You can also read