The rise of Victoria Victoria's population boom and changing urban landscape 1971 to 2036 - HubSpot
←
→
Page content transcription
If your browser does not render page correctly, please read the page content below
The rise
of Victoria
Victoria’s population
boom and changing
urban landscape
1971 to 2036
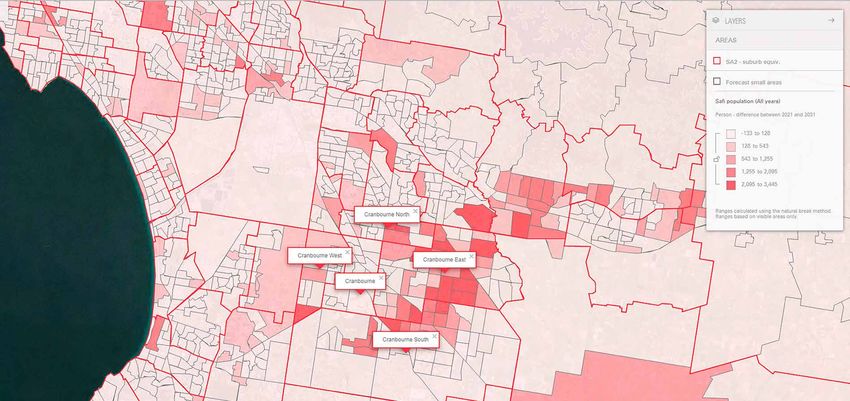
Table of contents
       Table of Tables ... 3
       Reimagining Victoria ... 4

     PART I
02
 2
       The fastest growth in 40 years ... 5
       1971 - 2001: the declining years ... 8
       2001 - 2011: changing fortunes ... 10
       Increases in net overseas migration ... 11
       Reversal of net interstate migration fortunes ... 14

     PART II
       Key growth regions ... 16
       Melbourne: growing up, not out ... 18
       In high definition ... 20
       The challenges of demography ... 24

                                        10 Easey Street, PO Box 1689 Collingwood, Victoria 3066 australia
                                        p +61 3 9417 2205 | e info@id.com.au | w id.com.au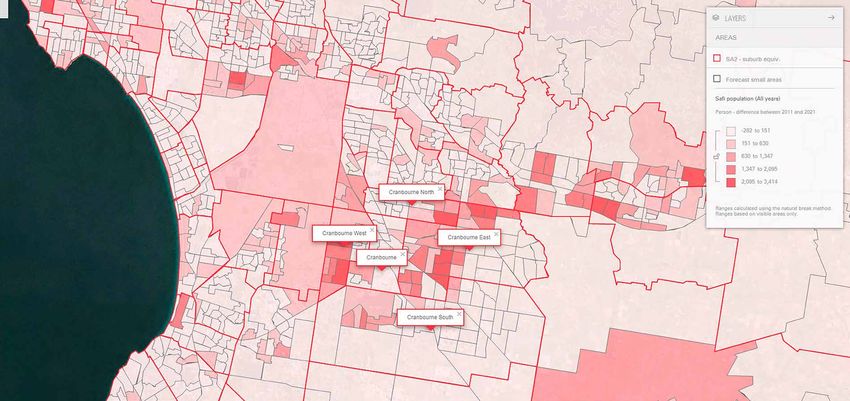
Table of tables
    Chart 1: Population growth rate, Victoria, 1972-2014 ... 5
    Chart 2: Population growth by age, Victoria 2001-2011 ... 6
    Chart 3: Population growth by age, Victoria 2011-2031 ... 6
    Chart 4: Age structure comparison, selected states and countries, 2035 ... 7
3   Chart 5: Population by year age group, Victoria, 1971-2001 ... 8
    Chart 6: Population change by five year age group, Victoria, 1971-2001 ... 9
    Chart 7: Fertility rates and number of births, Victoria, 1971-2014 ... 10
    Chart 8: Net overseas migration, Victoria, 1976-2014 ... 11
    Chart 9: Share of net overseas migration, Major States, 1976-2014 ... 12
    Chart 10: Net overseas migration by age, Victoria, 2006-2011 ... 13
    Chart 11: Net interstate migration, Victoria, 1976-2013 ... 14
    Chart 12: Net interstate migration, Victoria from and to other States, 2004-2014 ... 14
    Chart 13: Net interstate migration by age, Victoria, 2006-2011 ... 15
    Chart 14: Key Western and Northern LGAs, 1991-2041 ... 16
    Chart 15: Key Eastern and Southern LGAs, 1991-2041 ... 17
    Chart 16: Key Inner and Middle LGAs, 1991-2041 ... 17
    Chart 17: Population growth & building approvals, Victoria, 1991-2015 ... 18
    Chart 18: Dwelling growth, established versus greenfield, Melbourne, 1991-2036 ... 18
    Chart 19: Cranbourne area | Forecast population change, 2011-2021 ... 20
    Chart 20: Cranbourne area | Forecast population change, 2021-2031 ... 21
    Chart 21: Population by five year age group, Cranbourne West SA2, 2011-2031 ... 22
    Chart 22: Population change by age, Cranbourne West SA2, 2011-2031 ... 22
    Chart 23: Southbank-Port Melbourne area | Forecast population change, 2011-2021 ... 23
    Chart 24: Southbank-Port Melbourne area | Forecast population change, 2021-2031 ... 24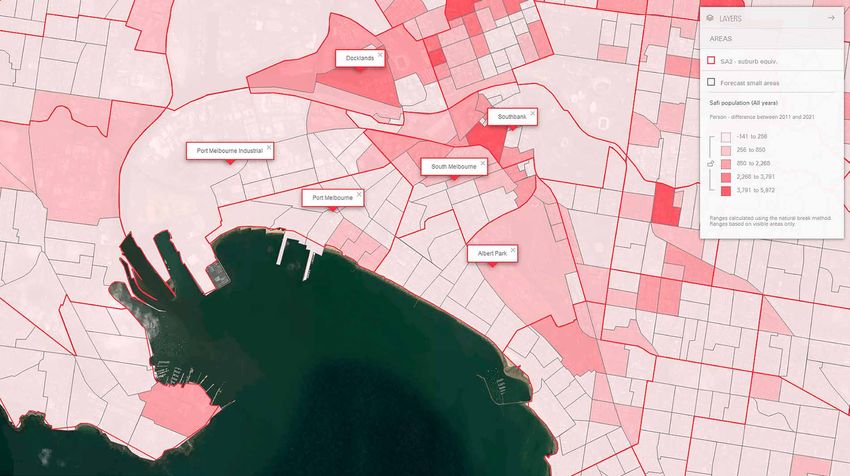
Reimagining Victoria

    The revitalisation of Victoria’s population
    and urban landscape
    The Victorian population is booming. We have to go back to the period that immediately
    followed World War II – that famous moment in history that gave us the baby-boomers
    – to find anything of similar magnitude. Importantly, this growth is being held up by
    younger cohorts, bringing balance to Victoria’s population profile as the baby boomers
    enter retirement in the years ahead.

    The rejuvenation of Victoria’s population is in part being driven by Australia-wide trends,
    such as a recent surge in fertility rates, and a sustained increase in overseas immigration.
    However, there are also factors specific to Victoria – such as a reversal of interstate
    migration flows in Victoria’s favour.

    In turn these dynamics are reshaping the regional balance of Victoria and Melbourne’s
    urban landscape. For the first time in Melbourne’s history, housing development in
4
    existing areas now outweighs developments in greenfield areas and we forecast that
    it will continue to do so.

    This paper outlines the emergence of these trends, and explores their consequences.
    We present analysis from each level of .id’s forecast – from state-wide to intra-suburban
    data. As the analysis shows, data becomes more powerful the more refined and detailed
    it is, and the more useful it is then to the planning and decision-making processes.

    This is where .id’s Small Area Forecasts (SAFi) methodology comes into its own,
    as a powerful way to develop high-definition, granular pictures of population growth
    across Victoria. Some of these SAFi results are also presented here for interest.

    The paper is divided into two parts:
    PART I – New currents in Victorian population growth
    This section places the current boom in Victoria’s population in historical context,
    and outlines the key drivers of growth – fertility, immigration, and inter-state migration.

    PART II – Locating Victoria’s high growth regions
    In this section we refine our focus to explore how growth will be distributed across the
    Victorian state. The shift to urban infill development in Melbourne is given particular attention.

                                               10 Easey Street, PO Box 1689 Collingwood, Victoria 3066 australia
                                               p +61 3 9417 2205 | e info@id.com.au | w id.com.au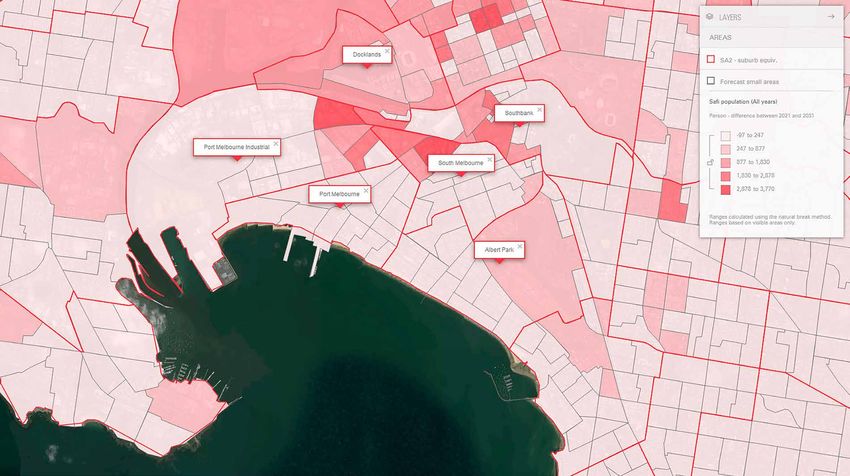
Part I: new current in Victorian
     population growth

     The fastest growth in 40 years
     The Victorian population is booming.
     Population growth is currently tracking at just under 2 percent per annum – one of the
     fastest growth rates in the past 40 years (Chart 1). Strong growth rates recorded in the
     early 1970s and late mid to late 1980s were somewhat comparable, but less enduring.

     Population growth has remained at or above 1.5 percent per annum for 9 years in a row
     now, heralding the most prolonged population boom in Victoria since the strong period
     of growth that followed World War II – the period that gave Australia its baby boomers.

     Chart 1: Population growth rate, Victoria, 1972-2014
5                 2.5%

                                                                                  Victoria

                                                                                  Australia
                  2.0%
    GROWTH RATE

           1.5%
        e
        ta
         r
         h
         t
         w
         o
         r
         G 1.0%

                  0.5%

                  0.0%

                                                             Year
                                                             YEAR
     Source: ABS, Australian Demographic Statistics

                                                      10 Easey Street, PO Box 1689 Collingwood, Victoria 3066 australia
                                                      p +61 3 9417 2205 | e info@id.com.au | w id.com.au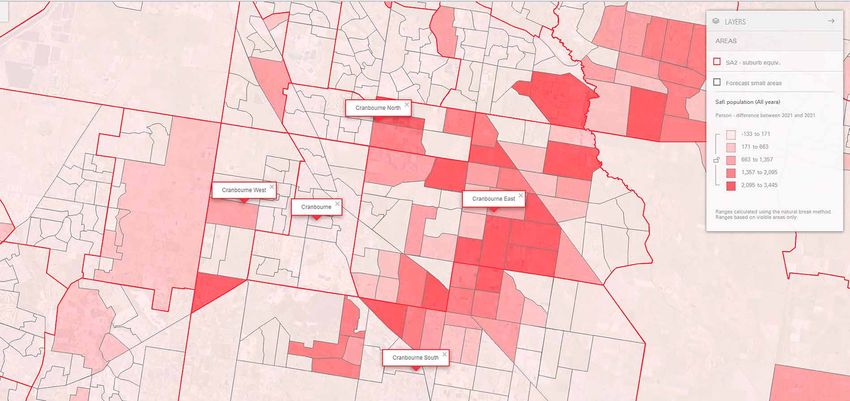
Importantly, a large share of this growth has been driven by an influx of children
     and young adults over the past ten years (Chart 2).

     Chart 2: Population growth by age, Victoria 2001-2011
                 100,000

                  90,000

                  80,000

                  70,000
    PERSONS

                  60,000
       Persons

                  50,000

                  40,000

                  30,000

                  20,000

                  10,000                                                   Source: ABS, Australian
                      0                                                    Demographic Statistics

                                    Age group
                                  AGE GROUP

     The resurgence of younger cohorts helps balance out the baby-boomer bulge in our
6    population projections (Chart 3). There is still strong growth in the baby-boomer cohort
     out to 2031, but this is now tempered by two further population spikes moving through
     the profile – young and mature families aged 30-49 years, and children.

     Chart 3: Population growth by age, Victoria 2011-2031
                 160,000

                 140,000

                 120,000

                 100,000
    PERSONS
       Persons

                  80,000

                  60,000

                  40,000

                                                                           Source: .id, .id Small
                  20,000
                                                                           Area Forecast information
                       0                                                   (SAFi), 2015

                                    Age group
                                  AGE GROUP

     In a world where population ageing and greying societies are an almost universal
     challenge, this leaves Victoria relatively well-placed. Chart 4 compares Victoria’s
     situation with Australia more broadly, as well as with Canada and Japan.

                                                10 Easey Street, PO Box 1689 Collingwood, Victoria 3066 australia
                                                p +61 3 9417 2205 | e info@id.com.au | w id.com.au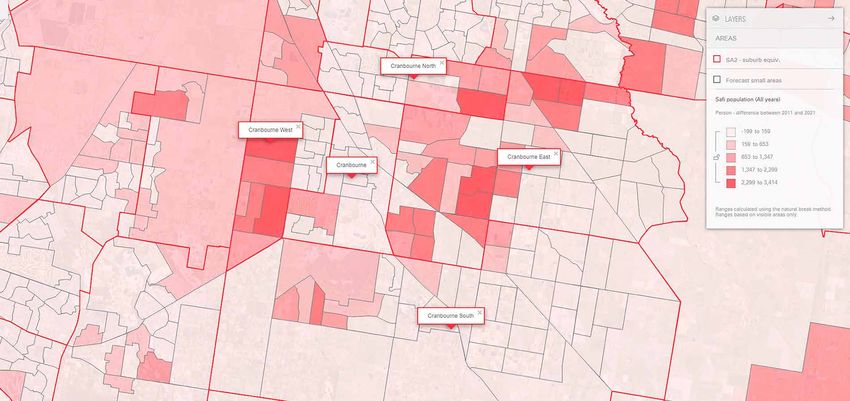
Chart 4: Age structure comparison, selected states and countries, 2035
                   9.0%
                                                                                                           Victoria
                   8.0%
                                                                                                           Australia

                   7.0%                                                                                    Canada

                                                                                                           Japan
                   6.0%
    s
    n
         PERSONS

    o
    sr             5.0%
     e
     P
                   4.0%

                   3.0%

                   2.0%

                   1.0%

                   0.0%

                                                               Age GROUP
                                                              AGE  group
7
          Source: .id, .id Small Area Forecast information (SAFi), 2015; UN Population Division,
          World Population Prospects: The 2012 Revision: Medium Fertility Series

          Japan’s situation is particularly tense. Low fertility rates (well below replacement
          for the past 25 years) have combined with superior diet, health care and longevity
          to create a starkly unbalanced demographic profile in the years ahead.

          Australia seems on track to avoid that fate, at least in the next twenty to forty years.
          This may come as a relief to some, though there are still many challenges ahead.
          But the truth of it is that current population projections paint a much rosier picture
          than the ones being presented just a few years ago.

                                                          10 Easey Street, PO Box 1689 Collingwood, Victoria 3066 australia
                                                          p +61 3 9417 2205 | e info@id.com.au | w id.com.au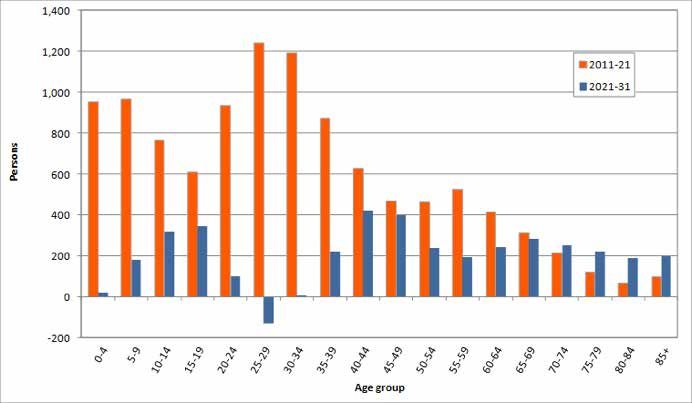
1971 - 2001: the declining years
     In the latter decades of the 20th Century, Australia’s demographic challenges seemed
     more stark. Victoria in particular was characterised as a ‘mature state’, with an exodus
     of younger people exacerbating a steadily ageing population.

     Chart 5 follows Victoria’s population through the period of 1971-2001. At the start of this
     period (represented by the blue bars), the Victorian population was weighted towards
     the younger generations, following high rates of post-war migration, high birth rates
     and a lower life expectancy.

     Chart 5: Population by five year age group, Victoria, 1971-2001
                 400,000
                                                                                                       1971
                 350,000                                                                               1981
                                                                                                       1991
                                                                                                       2001
                 300,000

                 250,000
8
       Persons
    PERSONS

                 200,000

                 150,000

                 100,000

                  50,000

                      0

                                                            AgeGROUP
                                                           AGE group

     Source: ABS, Australian Demographic Statistics

     However, moving through the orange, light grey and black bars, we can see the baby
     boomers (who were in their mid-twenties in 1971) moving through the population profile,
     and the population becoming centred around a higher average age. This was largely due
     to further falls in fertility rates during the 1970s and the arrival of overseas migrants.

                                                      10 Easey Street, PO Box 1689 Collingwood, Victoria 3066 australia
                                                      p +61 3 9417 2205 | e info@id.com.au | w id.com.au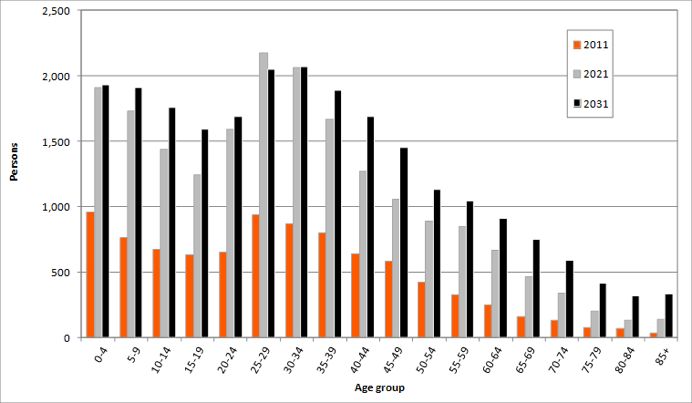
Between 1971 and 2001, the number of children in Victoria actually fell, on the back
     of falling fertility (Chart 6). At the same time, increasing life expectancy drove growth
     in older cohorts.

     Chart 6: Population change by five year age group, Victoria, 1971-2001
                  200,000

                  150,000

                  100,000
        Persons
    PERSONS

                   50,000

                        0

                   -50,000

9
                  -100,000

                                                             Age GROUP
                                                            AGE  group
     Source: ABS, Australian Demographic Statistics

     This population profile was cause for growing concern. However in the first decade of
     the new millennium, Victoria’s fortunes began to change. Across Australia, improvements
     in fertility and overseas migration rejuvenated younger cohorts in the population profile,
     while in Victoria in particular, interstate migration flows reversed, and started being a net
     contributor to growth.

                                                      10 Easey Street, PO Box 1689 Collingwood, Victoria 3066 australia
                                                      p +61 3 9417 2205 | e info@id.com.au | w id.com.au
2001 - 2011: changing fortunes
Rising Fertility
There was a sustained slow decline in fertility in the years leading up to 2000 (Chart 7),
and there was a clear expectation around the turn of the century that the fertility rate in
Australia and Victoria would continue to decline (the dotted line). However, the fertility
rate actually jumped back up to about 1.9 children per woman.
Chart 7: Fertility rates and number of births, Victoria, 1976-2014
90,000 2.50
Births
80,000 Fertility Rate
'Assumed trend'
2.00
70,000
CHILDREN
OFchildren
60,000
1.50
number of
50,000
BIRTHS
Births
AverageNUMBER
10
40,000
1.00
AVERAGE
30,000
20,000
0.50
10,000
0 0.00
Year
YEAR
Source: ABS, Australian Historical Population Statistics, 2008 ABS, Australian Demographic Statistics
As a result, the number of children born each year in Victoria has increased to a level
between 10,000 and 15,000 children over and above the averages of the 1980s and
1990s. Effectively, in just 8 years, Victoria has added more than an extra 100,000
children to the population, over and above the “business as usual” scenario.
For a fuller analysis of Australian fertility trends, see our recent ebook:
Three Growth Markets in Australia. DOWNLOAD HERE
10 Easey Street, PO Box 1689 Collingwood, Victoria 3066 australia
p +61 3 9417 2205 | e info@id.com.au | w id.com.auIncreases in net overseas migration
There was also a pick-up in net overseas migration in the first decade of the
new millennium across Australia, and Victoria was one of the main beneficiaries.
Chart 8: Net overseas migration, Victoria, 1976-2014
90,000 40.0%
Net overseas migration Share of Australia
80,000 35.0%
70,000
30.0%
migration
MIGRATION
of Australia
AUSTRALIA
60,000
25.0%
Net overseas
50,000
NET OVERSEAS
Share
20.0%
SHARE OF
40,000
15.0%
30,000
10.0%
20,000
11 5.0%
10,000
0 0.0%
YEARYear
ENDING
endingJUNE
June 30
Source: ABS, Australian Demographic Statistics
Through the thirty-year period between 1976 and 2006, overseas migration to Victoria
has ebbed and flowed broadly in line with the economic cycle (Chart 8). There were
periods of very low migration coinciding with the recessions of the late 1970s, mid 1980s
and early 1990s. Even at its peak, migration never exceeded 40,000 persons a year.
However, net overseas migration increased strongly in 2006, and has held consistently
above 40,000 people for the better part of a decade, peaking around 80,000 people in 2009.
This story played out across most of the mainland states. The Global Financial Crisis
had made Australia an extremely attractive place to relocate. Australia had a range of
identified labour shortages in a number of industries, which were easily filled by skilled
overseas migrants. Superior prospects at home compared to abroad also encouraged
many Australian’s to repatriate. Victoria also became a major tertiary education exporter
through this period.
10 Easey Street, PO Box 1689 Collingwood, Victoria 3066 australia
p +61 3 9417 2205 | e info@id.com.au | w id.com.auWe expect overseas migration to moderate somewhat as the influence of the mining
booms fades and the global economy continues to recover. However, it does appear
that there has been a step shift in migration levels, and we expect net overseas
migration to continue to drive strong population growth in Victoria.
Interestingly, Victoria has maintained its share of overseas migration even during the
mining boom. The mining boom saw spikes in migration to Queensland, and then
Western Australia. However, this was mostly at the expense of New South Wales
(Chart 9).
Chart 9: Share of net overseas migration, Major States, 1976-2014
60%
VIC
MIGRATION
50% NSW
QLD
migration
WA
40%
SA
OVERSEAS
net overseas
30%
12
of NET
20%
ShareOF
SHARE
10%
0%
YEAR ENDING
Year JUNE
ending June 3030
Source: ABS, Australian Demographic Statistics
10 Easey Street, PO Box 1689 Collingwood, Victoria 3066 australia
p +61 3 9417 2205 | e info@id.com.au | w id.com.auOne of the important aspects of overseas migration to Victoria is the fact that
the overwhelming proportion immigrants are young (Chart 10). There is a strong
concentration of young adults (18-24 years) much of which is associated with tertiary
education opportunities in Melbourne. Other young adults and family age groups
are drawn to Melbourne by its impressive employment prospects and cosmopolitan,
international lifestyle.
Chart 10: Net overseas migration by age, Victoria, 2006-2011
80,000
70,000
60,000
50,000
Persons
PERSONS
40,000
30,000
13 20,000
10,000
0
AgeGROUP
AGE group
Source: .id Small Area Forecast information (SAFi), 2015 (historical population reconciliation)
10 Easey Street, PO Box 1689 Collingwood, Victoria 3066 australia
p +61 3 9417 2205 | e info@id.com.au | w id.com.auReversal of net interstate migration fortunes
Until very late in the last century, Victoria consistently lost population to other states.
Following a peak outflow of close to 30,000 in 1994, Victoria has since steadily stemmed
and stabilised population outflows, and has even become a net recipient of population
in recent years (Chart 11).
Chart 11: Net interstate migration, Victoria, 1976-2013
15,000
10,000
5,000
OFofPERSONS
0
persons
-5,000
Number
-10,000
NUMBER
-15,000
-20,000
-25,000
Source: ABS, Australian
-30,000 Demographic Statistics
14 1976 1981 1986 1991 1996 2001 2006 2011
Year
YEAR
This largely reflects Victoria’s changing relationship with Queensland, which has
traditionally been the main destination for population exports. In recent years though
Queensland has actually become a source of population inflows (Chart 12).
Chart 12: Net interstate migration, Victoria from and to other States, 2004-2014
6,000
4,000
MIGRATION
2,000
Net interstate migration
0
NET INTERSTATE
-2,000
NSW
Qld
-4,000
SA
WA
-6,000 Tas
NT
ACT
Source: ABS, Australian
-8,000 Demographic Statistics
Year ending June 30
YEAR ENDING JUNE 30
10 Easey Street, PO Box 1689 Collingwood, Victoria 3066 australia
p +61 3 9417 2205 | e info@id.com.au | w id.com.auVictoria has also tended to export population to Western Australia, with losses increasing
significantly during the peak of the mining boom, 2011-2013. However, this trend has
also reversed in recent years. Since gains from New South Wales, South Australia and
Tasmania have been quite consistent over the last decade, Victoria has now become
a beneficiary of population inflows.
Net interstate migration also has an interesting age dimension. If we consider the period
2006-2011 (Chart 13), we can see that Victoria gained a significant number of young
adults (15-29 years) as well as elderly persons (70+ years). The young people are most
likely people attracted to the education, employment and entertainment opportunities
offered by Melbourne, whereas the older people may be relocating for family reasons
(following children or going back to their former home). It also probably reflects the fact
that the major centres along the Murray River (excluding Albury) are all on the Victorian
side (such as Corryong, Yarrawonga, Cobram, Echuca, Robinvale, Swan Hill and Mildura).
Chart 13: Net interstate migration by age, Victoria, 2006-2011
4,000
3,000
15 2,000
1,000
PERSONS
Persons
0
-1,000
-2,000
-3,000
Source: ABS, Australian
-4,000
Demographic Statistics
Age group
AGE GROUP
By contrast, people in the family age groups constitute the major losses from Victoria,
many of whom would be going for employment or lifestyle reasons. However, since the
period doesn’t cover the flow reversals associated with the end of the mining boom, this
trend may also be reversed in the next Census count.
The main conclusion to draw from all of this is that Victoria’s attractiveness, relative
to other states, is strong.
10 Easey Street, PO Box 1689 Collingwood, Victoria 3066 australia
p +61 3 9417 2205 | e info@id.com.au | w id.com.auPart II: locating Victoria’s
high-growth regions
It is one thing to understand the broader state-wide trends in population growth, but
this must be forged with an understanding of how growth will be distributed to specific
regions and localities to be truly useful.
At .id we combine a ‘top down’ with a ‘bottom up’ approach to develop high-definition
pictures of where growth is actually occurring. With this foundation we can explore how
Victoria and Melbourne are likely to change in the years ahead.
Key growth regions
The first stage in drilling down is to consider the Local Government Area (LGA) level.
In the key north and western LGAs, there is substantial growth forecast (Chart 14).
While Brimbank was the largest LGA in 2011, it will be dwarfed by Wyndham, Melton,
Whittlesea and Hume by 2041. More growth is expected in Melton in the next ten years
16 as more land supply is brought on.
Chart 14: Key Western and Northern LGAs, 1991-2041
450,000
400,000 Wyndham
Melton
350,000 Hume
Whittlesea
300,000 Brimbank
Population
POPULATION
250,000
200,000
150,000
100,000
50,000
0
Year as
YEAR AS at AT
JuneJUNE
30 30
Source: .id, .id Small Area Forecast information (SAFi), 2015; ABS, Regional Population Growth
10 Easey Street, PO Box 1689 Collingwood, Victoria 3066 australia
p +61 3 9417 2205 | e info@id.com.au | w id.com.auIn the east and the south (Chart 15), Casey is set to become as large as Newcastle with the
population topping more than 500,000 by 2041. Cardinia is also set to grow substantially
but from a lower base. Monash and Greater Dandenong are expected to have moderate
growth, while Frankston is likely to have minimal population growth.
Chart 15: Key Eastern and Southern LGAs, 1991-2041
500,000
450,000 Casey
Cardinia
400,000
Frankston
350,000
Monash
POPULATION
Population
300,000 Greater Dandenong
250,000
200,000
150,000
Source: .id, .id Small
100,000
Area Forecast information
50,000 (SAFi), 2015; ABS, Regional
0 Population Growth
Year as at June 30
AGE GROUP
17
In the inner and middle areas, Melbourne is set to grow substantially based on a large
expansion of apartment buildings in the CBD, Southbank and Carlton. In addition, a range
of residential precincts have been identified including E-Gate and Fishermans Bend (mainly
in Port Phillip LGA). Bayside is likely to be one of the most stable population areas in the
middle suburbs, however more development areas have been identified in the last few
years, boosting population growth in the future.
Chart 16: Key Inner and Middle LGAs, 1991-2041
350,000
Melbourne
300,000
Port Phillip
Moreland
250,000
Bayside
POPULATION
Population
Maribyrnong
200,000
150,000
100,000
Source: .id, .id Small
Area Forecast information
50,000
(SAFi), 2015; ABS, Regional
0
Population Growth
YEAR
YearAS
as at AT JUNE 30
June 30
10 Easey Street, PO Box 1689 Collingwood, Victoria 3066 australia
p +61 3 9417 2205 | e info@id.com.au | w id.com.auMelbourne: growing up, not out
If we narrow our focus, we can see that the rejuvenation of Victoria’s demographic future
is mirrored in (is perhaps even driving) a recasting of Melbourne’s urban landscape.
For some time there has been a mismatch between population growth and dwelling
growth in Melbourne (Chart 17), reflecting tougher credit conditions, land-release
bottlenecks on the fringes, and potential labour constraints imposed by the exodus of
workers with construction skills to the mining states. The GFC also drove a downturn in
housing activity in Australia, and there has been limited ‘catch up’ over the past 5-7 years.
Chart 17: Population growth & building approvals, Victoria, 1991-2015
140,000
Population change
120,000
Building approvals
100,000
Number
NUMBER
80,000
60,000
Source: ABS, Australian
18 40,000
Demographic Statistics 2014;
20,000 ABS, Building Approvals
Australia. Note: 2015 data
0 based on 5 months of data
Year ending June 30
YEAR AS AT JUNE 30
This housing shortage seems to have been focused in established areas - greenfield
development actually grew quite strongly in the first decade of the new millennium (Chart 18).
Chart 18: Dwelling growth, established versus greenfield, Melbourne, 1991-2036
120,000
Established areas
100,000 Greenfield
GROWTH
80,000
Dwelling growth
60,000
DWELLING
40,000
20,000
Source: ABS, Census; id, .id
Small Area Forecast information
0 (SAFi), 2015
1991-96 1996-01 2001-06 2006-11 2011-16 2016-21 2021-26 2026-31 2031-36
Period PERIOD
10 Easey Street, PO Box 1689 Collingwood, Victoria 3066 australia
p +61 3 9417 2205 | e info@id.com.au | w id.com.auHowever, in future, there is likely to be much more focus on development in established
areas. In part it is demand driven – by a growing inflow of younger people, who place
greater value of living in the inner city, and are more disposed to lifestyles in higher-density
environments. Education and employment opportunities are also perceived to greater in
the inner and middle suburbs. However, it also partly reflects supply side policies aimed
at promoting urban consolidation.
As a result, the period from 2011 to 2016 will be the first in Melbourne’s history in which
established areas outpace greenfield areas for residential development.
High-rise development in inner-Melbourne accounts for a large share of this growth, but
the inner city growth pattern extends broadly from the CBD to the middle ring suburbs
in areas like Maribyrnong and Moreland and Stonnington.
In fact, .id expects growth in all LGAs throughout metropolitan Melbourne – even in places
like Boorondara, which are traditionally lower growth areas. This is driven by high-density
unit development in the CBD, the intensification of existing residential areas, and changes
in land use such as old industrial areas converted to flats and new mixed-use precincts.
19
10 Easey Street, PO Box 1689 Collingwood, Victoria 3066 australia
p +61 3 9417 2205 | e info@id.com.au | w id.com.auIn high-definition…
While it’s not possible to consider the impact on every Victorian suburb in this paper,
.id’s Small Area Forecast methodology allows us to drill down to look at the results
in even greater detail.
Here we consider the Cranbourne area in Southeast Melbourne. A breakdown into
SA1 and sub-SA1 based geography shows how granular the forecasts are, and just
as importantly, how detailed the assumptions are that are driving the forecast results.
At .id, we endeavour to understand what is driving change in each of these areas.
Chart 19: Cranbourne area | Forecast population change, 2011-2021
20
Source: .id Small Area Forecast information (SAFi), 2015
10 Easey Street, PO Box 1689 Collingwood, Victoria 3066 australia
p +61 3 9417 2205 | e info@id.com.au | w id.com.auCranbourne is a good example of a place that has experienced significant residential growth
over the past 30 years. It is poised for further significant growth, although some areas such
as Cranbourne West and Cranbourne East are running out of land and growth will transfer
to other areas over time. The map shows strong increases in population in Cranbourne West,
Cranbourne East, Botanic Ridge and Clyde North in the coming ten years.
But in the following decade, 2021-31, the growth phase is Cranbourne West and
Cranbourne East has largely come to an end and much of the development in Clyde
North has transferred south and growth in Botanic Ridge has transferred east (Chart 20).
Chart 20: Cranbourne area | Forecast population change, 2021-2031
21
Source: .id Small Area Forecast information (SAFi), 2015
10 Easey Street, PO Box 1689 Collingwood, Victoria 3066 australia
p +61 3 9417 2205 | e info@id.com.au | w id.com.auThis next chart outlines how the age structure of Cranbourne West will change over time.
There is a classic family based structure with large numbers of parent and child aged residents.
The sheer magnitude of growth over the forecast period means all ages will increase over the
forecast horizon.
Chart 21: Population by five year age group,Cranbourne West SA2, 2011-2031
PERSONS
Source: .id Small Area Forecast
information (SAFi), 2015
AGE GROUP
22
However a closer look shows that as growth slows in the latter period, there is actually some
loss in 25-29 year olds, which was one of the major gains in the previous ten years (Chart 22).
The beginning of an aging in place process is becoming apparent. This signals the beginning
of a change in service mix requirements as the population structure begins to alter.
Chart 22: Population change by age, Cranbourne West SA2, 2011-2031
PERSONS
Source: .id Small Area Forecast
information (SAFi), 2015
AGE GROUP
10 Easey Street, PO Box 1689 Collingwood, Victoria 3066 australia
p +61 3 9417 2205 | e info@id.com.au | w id.com.auIn the South Melbourne-Port Melbourne area, growth tends to be achieved through changes
in land use. For example there have been significant dwelling increases in the Bay Street area
of Port Melbourne as a result of conversion from industrial and warehousing uses to residential,
although much of the growth has been completed by 2011.
There is only relatively small amounts of population growth anticipated in South Melbourne
and Port Melbourne between 2011 and 2021, with much of it concentrated in the industrial
area to the south of the West Gate Freeway (Chart 23).
Chart 23: Southbank-Port Melbourne area | Forecast population change, 2011-2021
23
Source: .id Small Area Forecast information (SAFi), 2015
By 2021, rates of development are expected to increase in the area and spread further into
the ‘Fishermen’s Bend’ precinct. This will be linked to further land use changes with much
of the industrial and warehousing functions replaced by high-density housing (Chart 24).
10 Easey Street, PO Box 1689 Collingwood, Victoria 3066 australia
p +61 3 9417 2205 | e info@id.com.au | w id.com.auChart 24: Southbank-Port Melbourne area | Forecast population change, 2021-2031
Source: .id Small Area Forecast information (SAFi), 2015
24
The value and application of such high-definition dwelling and population projections
should hopefully be obvious. It is important to be able to accurately estimate the magnitude
of population change across Melbourne and Victoria, but businesses and decision makers
need to know exactly where that change will occur.
High definition forecasts such as these help businesses and policy maker prepare for the
future with confidence.
The challenges of demography
The first decade of the new millennium saw the emergence of new and powerful
demographic trends that challenged our old assumptions and understanding of
demographic relationships. Stronger than expected fertility, immigration and inter-state
migration have successively led to upward revisions to Victoria’s population projections
each time they have been considered in recent years.
While this may excite demographers, there is little to comfort the elders of state charged
with planning and preparing for Victoria’s demographic future. However, forewarned
is forearmed, and while new trends can assert themselves quickly, as has been shown,
the full impact can take several generations to play out. There is always time to prepare.
10 Easey Street, PO Box 1689 Collingwood, Victoria 3066 australia
p +61 3 9417 2205 | e info@id.com.au | w id.com.auThese new trends have made demographic analysis particular tricky in recent years.
Many of the old assumptions and relationships no longer hold. This is one of the reasons
why .id always considers demographics from the top-down and the bottom-up. Our Small
Area Forecast methodology gives us unique insight into how state-wide population flows
will be distributed at the regional, suburban, even at the street-by-street level.
It is our ability to bring such high-definition to these broad macro trends that our
clients value so highly.
.id - See the future in sharper details...
25
10 Easey Street, PO Box 1689 Collingwood, Victoria 3066 australia
p +61 3 9417 2205 | e info@id.com.au | w id.com.au26
end.
.id consulting
10 Easey Street
Collingwood VIC 3066
P (03) 9417 2205
E info@id.com.au
W .id.com.au
10 Easey Street, PO Box 1689 Collingwood, Victoria 3066 australia
p +61 3 9417 2205 | e info@id.com.au | w id.com.auYou can also read