Analyzing the determinants of the spread of covid-19 among the provincial regions in China
←
→
Page content transcription
If your browser does not render page correctly, please read the page content below
Preprint: Please note that this article has not completed peer review.

Analyzing the determinants of the spread of covid-19
among the provincial regions in China
CURRENT STATUS:                    POSTED

Jianfa Shen
The Chinese University of Hong Kong

 jianfa@cuhk.edu.hkCorresponding Author
ORCiD: https://orcid.org/0000-0003-4110-0561

  10.21203/rs.3.rs-26465/v1
SUBJECT AREAS
 Behavioral Geography
KEYWORDS
 spatial diffusion, migration, covid-19 pandemic, infectious disease, China

                                                   1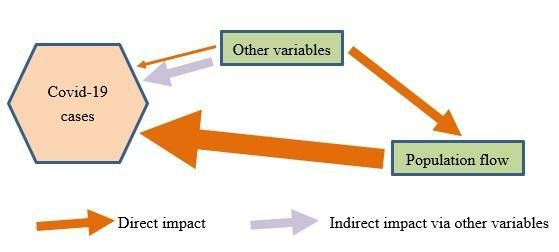
Abstract
China has experienced the spatial diffusion of covid-19 from Wuhan since December 2019. This

research examines the relationship between the geographical, social and economic factors and the

number of covid-19 cases on 26 January, 7 February, 20 February and 6 March 2020 in mainland

China. Both correlation and regression analyses show that the migrants who moved into Hubei in

2005-2010 is a good indicator of the population flow from Hubei to other provinces that caused the

spread of covid-19 in early 2020. Many migrants travelled back to hometown just before the traffic

ban of Wuhan city for the spring holiday. Thus the migration flow from a province to Hubei in the

period 2005-2010 had the highest correlation coefficient with the number of covid-19 cases in four

selected dates. The population flow data from the Baidu map on 20 January 2020 were also highly

correlated with the number of cases, but not as good as above migration data. The regression

equation for the number of cases on 26 January 2020 had the highest adj R2 as it was mainly

determined by the population flow from Hubei. The numbers of cases in subsequent days were also

affected by the local diffusion and the control measure in various provinces. Income and economic

variables became additional explanatory variables indicating their complicated impacts on the

mitigation measures at various provinces in China. The results of this research have important policy

implications to respond to the covid-19 pandemic.

Introduction
The new coronavirus disease (covid-19) pandemic has swept the world since December 2019. There is

great concern on the growth and spread of covid-19 which affects the public health and economy

enormously. Though the initial outbreak in Wuhan is likely linked to an animal host, the subsequent

accelerated transmission has much to do with the preparedness of public health system, and the

government and public responses to such highly infectious diseases in various cities, regions and

countries. The human factor is a crucial one in the spreading, monitoring, mitigation and control of

the pandemic. Wolf (2016) argued that infectious diseases are less of a “natural” disaster, but have

emerged alongside social and spatial inequalities.

The spatialities of health and infectious disease such as SARS in 2003 have received much attention

                                                     2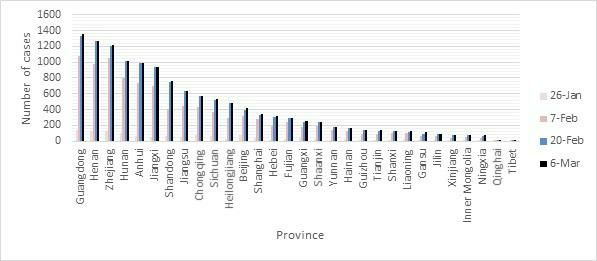
in the literature (Ali and Keil 2008; Mayer 2000). Connolly et al. (2020) argued that the processes of

extended urbanisation may result in increased vulnerability to infectious disease spread and they

highlighted demographic change, infrastructure and governance as three key factors which may be

examined using the landscape political ecology framework. There are great concerns on the urban

impact on public health (Freudenberg et al. 2005; Frumkin et al. 2004). Migration, urban population

growth and high population density are considered major factors influencing the spread of disease

(Coker et al. 2011). Alirol et al. (2010) revealed that rural to urban population movements can

increase risk of disease transmission greatly. Thus the monitoring of migration is crucial to stop the

spread of disease in future outbreaks (Connolly et al. 2020).

In recent four decades, China has experienced large scale rural to urban migration and urbanization

(Shen 2018; Wang and Shen 2017). Population movement in China has increased significantly since

1985 when Chinese people were permitted to move to other places as temporary population. The

temporary population climbed from 6.1 million in 1982 to the peak of 253 million in 2014 (Shen 2013;

2018). The number of inter-provincial migrants in a five-year period grew from 11.0 million between

1985 and 1990 to 60.6 million between 2005 and 2010. The urban population in China increased from

210.82 million in 1982 to 665.57 million in 2010. The level of urbanization reached 49.7% in 2010

(Shen 2018). Previous studies on inter-provincial migration in China have focused on the spatial

patterns (He and Gober 2003), regional concentration of migration flows (He and Pooler 2002),

determinants of migration (Fan 2005a; Liu et al. 2014), the relationship between migration and

regional development (Zhu 2003; Fan 2005b). Tong et al. (2015) discussed how the growing migrant

population, dramatic changes in the natural landscape following rapid urbanization, and changing

climatic conditions can contribute to the emergence of infectious disease. Wu et al. (2017) argued

that income growth, urbanization, and globalization is exacerbating emerging zoonotic risks especially

in China which has been affected by the Black Death, avian influenza and SARS previously.

The outbreak of covid-19 in a city, region or a country often starts with imported cases by the travel

of visitors or residents and then accelerates with local transmission. China has experienced the

spatial diffusion of covid-19 from Wuhan to the rest of China since December 2019. The first

                                                   3
confirmed covid-19 case out of Hubei Province was reported in Henan on 21 January. A man
developed the covid-19 symptom in Wuhan on 29 December 2019 and returned to his hometown,
Zhoukou city, on 7 January 2020 (Health Commission of Henan Province 2020). Until 23 January 2020,
81% of all covid-19 cases were in Hubei and 57% of reported cases outside of Wuhan had travel
history to Wuhan before 23 January 2020 (Kraemer et al. 2020). Then dramatic lockdown measures
were implemented in Wuhan and many places in China so that the new covid-19 cases were reduced
to very small numbers by early March 2020. The pandemic case in China takes place with special
context including high mobility along with rapid urbanization, the timing of spring festival and the
strong government intervention (Chen et al. 2020a; Kraemer et al. 2020; Tian et al. 2020). It also
involves two stages before and after 23 January 2020 when the traffic ban to and from Wuhan (the
epicentre of the covid-19) was imposed: uncontrolled stage and controlled stage. This paper will study
the determinants of the spread of covid-19 among provincial regions in China in such a particular
context.
Some studies have examined the epidemic in Wuhan and China. Wu et al. (2020) estimated the size
of the epidemic in Wuhan based on the number of cases exported from Wuhan to cities outside
mainland China from 31 December 2019 to 28 January 2020. They also forecasted the extent of the
domestic and global public health risks of epidemics using susceptible-exposed-infectious-recovered
metapopulation model. Lai et al. (2020) tested and quantified the efficacy of applying or lifting non-
pharmaceutical interventions (NPIs) under various scenarios and timings. They built a travel network-
based stochastic susceptible-exposed-infectious-removed (SEIR) model to simulate the covid-19
spread between and within all prefecture-level cities in mainland China. Population movement data
were used to estimate the intensity of travel restrictions.
Chen et al. (2020) examined the correlation of population flow data of Wuhan City and Hubei province
extracted from Baidu Qianxi with the number of covid-19 cases for the period 17-30 January 2020
using the Bayesian space-time model of WinBUGS software. High correlation coefficients were found
based on no-linear equation. Ai et al. (2020) examined the effects of population outflow from Wuhan
on the covid-19 transmission in other provinces and cities of China, as well as the impacts of the city
4closure in Wuhan. They indicated that population movement might be one important trigger of covid-
19 infection transmission in China. Ying et al. (2020) conducted Spearman’s correlation analysis
between official data of confirmed covid-19 cases, and real-time travel data and health resources
data for the period 20 January to 19 February 2020 for provinces and cities, reporting high correlation
coefficients. Kraemer et al. (2020) found positive correlation between the growth rate of covid-19
cases and the population flow from Wuhan in the period 9-22 January 2020. A few studies also
examined the effect of transmission control measures including traffic ban on the covid-19 epidemic
in China. These studies show that the drastic control measures substantially mitigated the spread of
covid-19 in China (Kraemer et al. 2020; Tian et al. 2020).
Although some initial studies have revealed the relationship between population flow and the spread
of covid-19 in China mostly focusing on the data in January and February 2020, other geographical,
social and economic factors have not be examined systematically. This research will examine the
relationship between geographical, social and economic variables and the number of covid-19 cases
in various provinces in mainland China. The paper will reveal the significant determinants of the
spread of covid-19 among the provincial regions in China.
The remainder of this paper is organized as follows. In the next section, the research methodology
and data will be introduced. The spread of covid-19 among the provincial regions in China will be
documented in the following section. Then the determinants of the covid-19 cases will be analysed
using correlation and regression analyses. Some conclusions are reached in the final section.
Research Methodology And Data
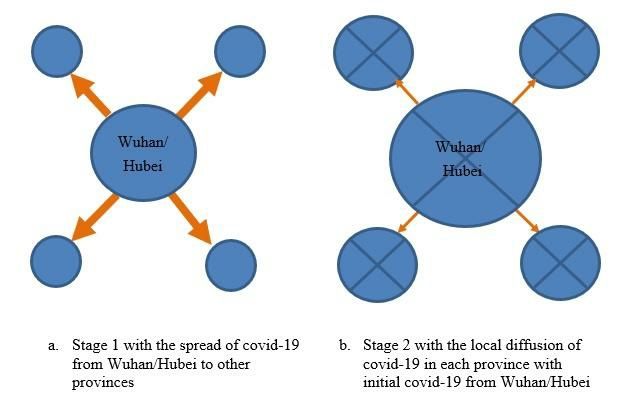
As mentioned before, the spread of covid-19 among the provincial regions in China can be divided
into two stages before and after 23 January 2020 when the traffic from Wuhan was locked. Other
cities and provinces began to control the traffic after 23 January 2020. Figure 1 presents the two
stages of the spread of covid-19 in mainland China. In the first stage, the spread of covid-19 among
the provincial regions in China was largely the inter-provincial diffusion from Wuhan and Hubei. This
paper uses the number of covid-19 cases on 26 January 2020 to represent this situation and the
number would be largely determined by the population connection between Hubei and other
5provinces. 26 January 2020 was three days after the traffic ban from Wuhan as the number of cases
would increase some days after the infected people arrived at a destination. Furthermore, it was also
the earliest date when systematic data for all provinces were available. In the second stage after
February 2020, the number of covid-19 cases largely represents further local diffusion in various
provinces and the number would be largely determined by the initial cases transferred from Hubei
(thus the population connection) and the controlling measures in various destination provinces in
containing the local diffusion. The number of covid-19 cases in February and March 2020 represents
such situation.
The spread of covid-19 is related to both the spatial configuration and the population flows between
Wuhan and other provinces (Alirol et al. 2010; Chen et al. 2020; Ying et al. 2020; Kraemer et al.
2020). It may also be related to population and economic size of a province, population density,
urbanization level, income level and economic growth rate (Coker et al. 2011; Tong et al. 2015; Wu et
al. 2017). Thus following variables are selected to analyse the determinants of the spread of covid-19
(Table 1). The variables in group 1 spatial configuration and the population flows include Distance to
Hubei, Mig from Hubei (migration from Hubei during 2005-2010) and Jan 20 from Wuhan share (the
share of a province in the total population flow from Wuhan on 20 January 2020). It is hypothesized
that they would have positive impacts on the case number of a province. Mig to Hubei and Jan 20 t
The variables in group 2 population and economic size of a province include Area, Pop18, UrbanPop18
and GDP18 which measure territory, population, urban population and GDP (Gross Domestic Product)
in 2018 respectively. It is hypothesized that they would have positive impacts on the case number of
a province. The variables in group 3 population density and urbanization level include Density18 and
Urbans18 which measure population density and the urbanization level in 2018 respectively.
Urbanization and population concentration would facilitate virus spread (Coker et al. 2011). Thus it is
hypothesized that they would have positive impacts on the case numbers of a province. The variables
in group 4 income level and economic growth rate include GDPPC18, UrbanI18, RuralI18 and GDPI18
which measure GDP per capita, urban disposable income per capita and rural disposable income per
capita and GDP growth rate in 2018 respectively. The data in year 2018 are used as the most
6statistical data for 2019 are not available yet. The virus is considered to occur more likely in more
developed areas although its spread may be similar in both rich or poor areas (Tong et al. 2015; Wu
et al. 2017). Thus it is hypothesized that they would have positive impacts on the case numbers of a
province.
The following analytical strategies are adopted in this research. Correlation analysis would be
conducted in the first stage to check the relationship between the number of covid-19 cases and
other variables mentioned above. Those with significant and large correlation coefficients would
indicate their possible impacts on the covid-19 spread, especially the variable with the highest
correlation coefficient which is not likely to be caused by indirect correlation with other variables.
Indirect correlation will also be examined for some significant correlations with the number of covid-
19 cases. In the second stage, stepwise regression will be adopted to identify multiple significant
variables that may have contributed to the number of covid-19 cases. This is useful as correlation
analysis can only assess the relationship between two variables including both direct and indirect
impacts. The estimated regression equation can also show how each explanatory variable contributes
to the number of covid-19 cases in each province especially the direct impacts while the indirect
impacts (impact via other significant variables) will be controlled. Figure 2 presents the conceptual
framework of direct and indirect impacts of various determinants on the number of covid-19 cases.
The numbers of confirmed covid-19 cases in 30 provinces in mainland China except Hubei provinces
are considered in this study. The data of these cases are retrieved from the real time big data report
on new coronavirus disease pandemic of Baidu App (Baidu 2020) which are based on the official
sources of the national and provincial authorities. The numbers of cases reported on 26 January, 7
February, 20 February and 6 March 2020 by province are considered and they are represented by
variables D0126, D0207, D0220 and D0306 respectively (Table 1).
26 January 2020 was the peak of newly confirmed daily cases in China (except 1 February when the
case number jumped due to adjustment of the criteria for confirmed cases). It was just three days
from 23 January when the traffic ban to and from Wuhan was imposed by Wuhan municipal
government. The number of cases reported in various provinces on 26 January 2020 represented the
7covid-19 diffusion before the traffic ban as the symptom of infected people would emerge in 1-14
days usually. Among cases known to have travelled from Wuhan, the time from symptom onset to
confirmation was 6.5 days and 4.8 days for those travelled before and after 23 January 2020
respectively as more active surveillance was used after 23 January 2020 (Kraemer et al. 2020). It is
also estimated that the average incubation period of covid-19 was 5.1 days based on 38 cases. Using
the upper limit of 8 days as incubation period, the cases reported in other provinces that was
imported from Hubei would have been reduced substantially by 1 February 2020 (Kraemer et al.
2020). The case numbers in subsequent days represented cases by movement of infected people
from Wuhan/Hubei (as recorded by the data on 26 January 2020) and subsequent local transmission
at destination. 7 February 2020 was the date when enhanced admission and isolated treatment of
cases in Hubei was implemented (WHO 2020). 20 February 2020 was one month from the date when
the population movement data was used to explain the case numbers. 6 March 2020 was the latest
date at the time of the research when the outbreak in China slowed done significantly.
A number of geographical, social and economic variables are used to explain the number of covid-19
cases in various provinces in mainland China. These include the distance, population flow and
migration flow between Hubei and various provinces, and other demographic and economic variables.
The distance to Hubei is the highway distance between Wuhan and the capital cities of various
provinces. Population flows between Wuhan and other provinces on 20 January 2020 are the big data
on migration from Baidu map (2020). It is a kind of big data by estimating the movement of people
based on the hotspots of internet users. Such data are called migration data by Baidu map.
Population flow data are more proper term. The date of 20 January 2020 was chosen as many people
in China were travelling back to hometown for the spring festival and was three days before the traffic
ban from Wuhan city on 23 January. The population flow on that day represents the normal population
flows before the holiday which could have caused the spread of covid-19 to other provinces. Migration
data are also used to capture long-term stable population connections between Hubei and other
provinces. The data refer to the migration in the period 2005-2010 and are from the most recent 2010
census (Population Census Office of State Council and Department of Population and Employment
8Statistics 2012). Data on other demographic and economic variables for various provinces in 2018 are
from National Bureau of Statistics (2019).
The spread of covid-19 among the provincial regions in China
The number of pneumonia cases by unknown causes in Wuhan (China) was 27 on 31 December 2019.
This is the first official figure released publicly by Wuhan Municipal Health Commission (2019). In
Wuhan, the reported number was 44 on 3 January 2020 and the number of pneumonia cases by
unknown virus was 41 on 10 January 2020 and the number of confirmed pneumonia cases by new
coronavirus was 41 on 13 January 2020 (Wuhan Municipal Health Commission 2020a; 2020b; 2020c).
The data on covid-19 in China before 13 January 2020 were likely undercounted as many cases were
not tested and confirmed. It is noted that different causes are cited in these reports: unknown causes,
unknown virus and new coronavirus (named by WHO as covid-19 on 11 February 2020). It was
reported that only suspected patients who had been to the South China Seafood Market (the widely
claimed origin of covid-19) could be tested in early days.
On 20 January 2020, the famous Chinese medical expert, Dr Zhong Nanshan, said on CCTV (China
Central Television) that the disease is contagious among people, signalling a key alarming to the
general public. The number of confirmed covid-19 cases in China increased to 291 by 20 January 2020
(National Health Commission of China 2020; Wuhan Municipal Health Commission 2020d). 258 were
in Wuhan city, 12 in rest of Hubei province except Wuhan and 21 in rest of China except Hubei (Table
2): 14 in Guangdong, 5 in Beijing and 2 in Shanghai. Outside China, there were 5 cases in total on that
day, one case in Japan, one case in Korea and three cases in Thailand (National Health Commission of
China, 2020; Wuhan Municipal Health Commission, 2020c). The number of covid-19 cases in China
increased to 2761 on 26 January 2020, 80813 on 6 March 2020 and then slowly to 82813 by 27 March
2020. The number of cases outside China increased to 39 on 26 January, 17481 on 6 March 2020 and
427086 by 27 March 2020.
In the period 20-26 January 2020, there were rapid increase of covid-19 cases in Wuhan (from 258 to
715), rest of Hubei (12 to 725) and rest of China (21 to 1321). After the traffic ban from Wuhan on 23
January 2020, the explosive growth in the number of cases occurred only in Wuhan in the period from
926 January to 6 March 2020. The growth in the rest of Hubei and the rest of China was much slower.
This paper is focused on the spread of the covid-19 cases from Hubei to 30 provinces in mainland
China. Figure 3 shows the location of these provinces in China.
As shown in figure 4, Guangdong, Henan, Zhejiang, Hunan, Anhui and Jiangxi had the largest number
of covid-19 cases in the period from 26 January to 6 March 2020, each with over 900 cases by 6
March 2020. Henan, Hunan, Anhui and Jiangxi are neighbours of Hubei province. Guangdong and
Zhejiang are two economically advanced large provinces and are among the top three provinces in
terms of covid-19 cases. The next group of provinces including Shandong, Jiangsu, Chongqing,
Sichuan, Heilongjiang, Beijing and Shanghai had the second largest number of covid-19 cases in the
period from 26 January to 6 March 2020, each with over 340 cases by 6 March 2020. Chongqing is the
neighbour of Hubei province while Shandong, Jiangsu, Sichuan and Shanghai are not far away from
Hubei province. Beijing is the capital city of China with strong connection with Wuhan. Indeed,
Shandong, Chongqing, Sichuan and Beijing had a larger number of covid-19 cases than Jiangxi in the
first group on 26 January 2020. Heilongjiang is an exceptional case. It is far away from Hubei
province. It had a small number of covid-19, 21, on 26 January 2020 which increased rapidly to 479 by
20 February 2020. The next section attempts to analyse the determinants of the covid-19 cases in
various provinces in China.
Determinants of the covid-19 cases: correlation and regression analyses
Table 1 presents the correlation coefficients between the number of cases and various variables. It is
interesting to note that the migration flow from a province to Hubei in the period 2005-2010 (Mig to
Hubei) had the highest correlation coefficient with the number of covid-19 cases in four selected
dates, over 0.880. The migration flow data were nine years ago but were a good indicator of the
migrants who had moved into Hubei from various provinces. The population flow from Wuhan and
Hubei to other provinces just before the traffic ban of Wuhan city was closely related to migrants who
travelled back to hometown in January 2020 for the spring holiday. Indeed, the first known covid-19
case out of Hubei Province was a male patient who worked in Wuhan as a migrant and developed the
covid-19 symptom on 29 December 2019. He returned to his hometown, Zhoukou city, on 7 January
102020 to receive medical care and this covid-19 case was confirmed on 21 January 2020 (Health
Commission of Henan Province 2020). As the number of cases in later days included the secondary
spread in the local community at the destination, thus its correlation with the migration flow
decreased over time from 0.888 to 0.880.
Theoretically, the population flow data from the Baidu map on 20 January 2020 measured the real-
time flow of people from and to Wuhan on that day (Jan 20 to and from Wuhan share). They were
expected to have high correlation with the number of covid-19 cases. Although they were also highly
correlated with the number of cases, over 0.700, the correlation coefficients were smaller than that
with the migration flow from a province to Hubei in the period 2005-2010. It is also noted that the
population flows to and from Wuhan on 20 January 2020 had similar correlation coefficients with the
number of cases. This indicates that the population flows between Wuhan and other provinces are
symmetrical involving different people moving in opposite directions (the number of people made the
return trip in the same day would be small for inter-provincial travel).
The real-time flow of people from Wuhan includes people who had stayed for a long time (such as
migrants) and a short time (such as visitors for a few days). Those who had stayed in Wuhan and
Hubei for a long time would have more chance to be infected and thus they played a greater role in
the spread of virus to other provinces. Thus one important finding of this study is that the return of
migrants who had stayed in affected areas for a long time (not a few days like visitors) would
contribute to the number of cases in other provinces significantly. Many of them maybe usual
residents in Wuhan and Hubei, but they were migrants came from other provinces previously. Just
before the spring festival period in 2020, many such migrants returned to their hometown to meet
their families in other provinces. In terms of the impact of visitors, some infected cases in a province
were caused by residents of the province who visited the affected area due to their two-way trips. In
the meantime, visitors from the affected area would also spread the virus at the destination. With the
introduction of the control of population movement from the epicentre, the spread of virus may be
controlled effectively.
The variables in group 2 population and economic size of a province, population (Pop18), urban
11population (UrbanPop18) and GDP (GDP18) in 2018 had large correlation coefficients with the number
of cases, over 0.700. This is because population and economic size had high correlation coefficients
with migration flow, over 0.600 in most cases (Table 3). Thus a province had a large population and a
large GDP would had a large migration flow to Hubei or Wuhan (direct impact on the flow), thus had
more cases of virus infection as indirect impact as explained above. However, the size of territory had
no significant correlation with the number of cases. This is because both the size of territory (area)
and population density would affect the total population, but both of them had no significant
correlation with the total population which had a large correlation coefficient with the number of
cases.
Distance to Hubei had negative correlation with the number of cases as indirect impact with
correlation coefficients around 0.600. This is consistent with the gravity model of migration as there
would be larger migration or population flows when the province is closer to Hubei or Wuhan (direct
impact on flow), with correlation coefficients around -0.4 to -0.6 in this case (Table 1). Due to the
central location of Hubei and its proximity to provinces with large population and economy in China,
the correlation coefficients between Distance to Hubei and population (Pop18), urban population
(UrbanPop18) and GDP (GDP18) in 2018 were also very significant, around -0.5 (Table 3).
However, the case number had no significant correlation with the variables in group 3, population
density (Density18) and urbanization level (Urbans18), and the variables in group 4 income level and
economic growth rate including GDPPC18, UrbanI18, RuralI18 and GDPI18. Two exceptions were that
UrbanI18 and RuralI18 had significant correlation with the number of cases on 26 January 2020
(D0126) with correlation coefficients of 0.361 and 0.391 respectively. This means that more
developed regions may have strong connection with Hubei and thus more exported cases from
Wuhan and Hubei before the traffic ban from Wuhan.
Although some variables did not have significant correlations with the number of covid-19 cases
directly by using the simple correlation coefficients, they could be significant variables in the stepwise
regression which was used to select the best and significant multiple variables that affect the number
of cases in provinces. Table 4 presents the result of stepwise regression. The regression equation for
12the number of cases on 26 January 2020 (D0126) had the highest adj R2 as it was mainly determined
by the population flow from Hubei. The numbers of cases in subsequent days (D0207, D0220 and
D0308) were also affected by the local diffusion and the control measure in various provinces. Thus
more variables were included in the regression equation but with smaller adj R2, but over 0.873 in all
these days. To check for the existence of multicollinearity, the variance inflation factor (VIF) were
calculated and all were under ten. Thus, no multicollinearity is identified among these regression
equations.
Mig to Hubei was the most significant variable in all regression equations of 4 days as indicated by
the highest t-value. This is consistent with the results of correlation analysis as this variable has the
highest correlation coefficient with the number of cases. The regression equation for the number of
cases on 26 January 2020 (D0126) includes another significant variable of urban income, UrbanI18.
Thus a province had a higher urban disposable income may have more cases, possibly indicating that
more developed provinces may have more population flow than the previous migration flow in 2005-
2010 used in the analysis.
The regression equation for the number of cases on 7 February 2020 (D0207) includes two other
significant variables of rural income (RuralI18) and GDP per capita (GDPPC18). The two variables had
positive and negative impacts on the number of cases respectively. This means that a province with
higher rural income would have more cases and a province with higher GDP per capita would have
fewer cases, after controlling the impact of the migration flow to Hubei in 2005-2010. The regression
equation for the number of cases on 20 February 2020 (D0220) and 6 March 2020 (D0306) also
include above two significant variables of rural income (RuralI18) and GDP per capita (GDPPC18) with
similar effects on the number of cases. Another significant variable of GDP in 2018 (GDP18) also had
positive impact on the number of cases. So a province with a larger economy also had more cases.
It is clear that after the traffic ban on Wuhan in 23 January 2020, the impact of migration flow on the
number of covid-19 cases was reduced. In the meantime, income and economic variables became
additional explanatory variables which may indicate their complicated impacts on the mitigation
13measures at various provinces in China.
Conclusion
Migration, urban population growth and high population density are considered major factors
influencing the spread of disease (Coker et al. 2011). It has been argued that income growth,
urbanization and globalization is exacerbating emerging zoonotic risks in China (Wu et al. 2017; Tong
et al. 2015). China has experienced the spatial diffusion of covid-19 from Wuhan since December
2019 which has been examined in a few studies. These studies show that the drastic control
measures substantially mitigated the spread of covid-19 in China (Kraemer et al. 2020; Tian et al.
2020). Kraemer et al. (2020) found positive correlation between the growth rate of covid-19 cases and
the population flow from Wuhan in the period 9-22 January 2020. But the impacts of geographical,
social and economic factors on the spatial spread of covid-19 have not be examined systematically.
This research examines the relationship between geographical, social and economic variables and the
number of covid-19 cases in various provinces in mainland China using correlation analysis and
stepwise regression. The numbers of confirmed cases of new coronavirus disease (covid-19) in 30
provinces in mainland China except Hubei provinces on 26 January, 7 February, 20 February and 6
March 2020 are considered in this study.
This paper reveals the significant determinants of the spread of covid-19 among the provincial
regions in China. Both correlation and regression analyses show that the migrants who moved into
Hubei in 2005-2010 is a good indicator of the population flow from Hubei to other provinces causing
the spread of the covid-19 in early 2020. Many migrants travelled back to hometown just before the
traffic ban of Wuhan city for the important traditional spring holiday in January 2020. Thus the
migration flow from a province to Hubei in the period 2005-2010 had the highest correlation
coefficient with the number of covid-19 cases in four selected dates, over 0.880. The population flow
data from the Baidu map on 20 January 2020 were also highly correlated with the number of cases,
over 0.700, but not as good as above migration data due to the difference in visitors and migrants.
Population (Pop18), urban population (UrbanPop18) and GDP (GDP18) in 2018 had large correlation
coefficients with the number of cases, over 0.700. This is because population and economic size had
14high correlation coefficients with migration flow, over 0.600 in most cases. Distance to Hubei had
negative correlation with the number of cases with correlation coefficients around 0.600. The case
number had no significant correlation with population density (Density18), urbanization level
(Urbans18), GDPPC18, UrbanI18, RuralI18 and GDPI18 with two exceptions. UrbanI18 and RuralI18
had significant correlation with the number of cases on 26 January 2020. This means that more
developed regions have strong connection with Hubei and thus more exported cases from Wuhan and
Hubei before the traffic ban from Wuhan.
The regression equation for the number of cases on 26 January 2020 had the highest adj R2 as it was
mainly determined by the population flow from Hubei. The numbers of cases in subsequent days were
also affected by the local diffusion and the control measure in various provinces. Mig to Hubei was the
most significant variable in all regression equations of 4 days. After the traffic ban on Wuhan in 23
January 2020, the impact of migration flow on the number of covid-19 cases was reduced. In the
meantime, income and economic variables became additional explanatory variables indicating their
complicated impacts on the mitigation measures at various provinces in China.
The results of this research have important policy implications to respond to the covid-19 pandemic.
The migrants in a particular region may have a higher chance to travel especially for specific holidays
or social events such as spring festival in China. In the time of new virus outbreak, proper advice
should be given to those people who are likely to travel. In the case of China, many migrants had
returned to hometown before the traffic ban in Wuhan on 23 January 2020. The traffic control in
Wuhan and in many other places in China prevented further movement and return of migrants to
their working cities and regions after the spring festival to mitigate the spread of covid-19. These
measures had been proven to be effective by March 2020. Another useful implication is that the
people who carry the virus and spread to a region can be the people from that region, including the
migrants who return to their hometown and visitors who return from an infected area to their home
region. Of course, people from the origin can also carry and spread the virus to their destinations as
visitors. The migration and population flows involving people from both the origin and destination are
causing the spread of the virus regionally and locally.
15Declarations
The author declares no competing interests.
References
Alirol, E., Getaz, L., Stoll, B., et al. (2010). Urbanisation and infectious diseases in a globalised world.
Lancet Infectious Disease, 10, 131–141.
Ai, S., Zhu, G., Tian, F. et al. (2020). Population movement, city closure and spatial transmission of the
2019-nCoV infection in China. medRxiv 2020: 2020.02.04.20020339. doi:
https://doi.org/10.1101/2020.02.04.20020339, accessed on 13 April 2020.
Ali, S.H., & Keil, R. (2008). Networked Disease: Emerging Infections in the Global City. Oxford: Wiley-
Blackwell.
Baidu. (2020). Real time big data report on new coronavirus disease pandemic, Baidu App.
Baidu map. (2020). Big data on migration, Baidu map eye/Baidu flow, https://qianxi.baidu.com/,
accessed on 8 March 2020.
Chen, S., Yang, J., Yang, W., Wang, C., & Bärnighausen, T. (2020a). COVID-19 control in China during
mass population movements at New Year. Lancet, 395(10226), 764-766.
Chen, Z., Zhang, Q., Lu Y. et al. (2020b). Distribution of the 2019-nCoV epidemic and correlation with
population emigration from Wuhan, China. medRxiv 2020:2020.02.10.20021824. doi:
https://doi.org/10.1101/2020.02.10.20021824, accessed on 13 April 2020.
Coker, R.J., Hunter, B.M., Rudge, J.W. et al. (2011). Emerging infectious diseases in southeast Asia:
Regional challenges to control. The Lancet, 377(9765), 599–609.
Connolly, C., Keil, R., & Ali, S.H. (2020). Extended urbanisation and the spatialities of infectious
disease: Demographic change, infrastructure and governance. Urban Studies, OnlineFirst, 1-19,
https://doi.org/10.1177/0042098020910873, accessed on 13 April 2020.
Fan, C. C. (2005a). Modeling Interprovincial Migration in China, 1985-2000. Eurasian Geography and
Economics, 46(3), 165-184.
Fan, C. C. (2005b). Interprovincial migration, population redistribution, and regional development in
China: 1990 and 2000 census comparisons. Professional Geographer, 57(2), 295-311.
16Freudenberg, N., Galea S. and Vlahov D. (2005). Beyond urban penalty and urban sprawl: Back to
living conditions as the focus of urban health. Journal of Community Health, 30(1), 1–11.
Frumkin H., Frank, L.D., & Jackson, R. (2004). Urban Sprawl and Public Health: Designing, Planning,
and Building for Healthy Communities. Washington, DC: Island Press.
Health Commission of Henan Province. (2020). National Health Commission confirmed the first
imported pneumonia case caused by new coronavirus in the province. 21 January 2020.
http://www.hnwsjsw.gov.cn/contents/858/48535.shtml, accessed on 13 April 2020.
He, C., & Gober, P. (2003). Gendering interprovincial migration in China. The International Migration
Review, 37(4), 1220-1251.
He, J., and Pooler, J. (2002). The regional concentration of China’s interprovincial migration flows,
1982-90. Population and Environment, 24(2), 149-182.
Kraemer, M.U.G., Yang, C.H., Gutierrez, B. et al. (2020). The effect of human mobility and control
measures on the COVID-19 epidemic in China. Science, 25 Mar 2020: eabb4218.
Lai, S., Ruktanonchai, N.W., Zhou, L. et al. (2020) .Effect of non-pharmaceutical interventions for
containing the COVID-19 outbreak in China. medRxiv preprint. DOI:
https://doi.org/10.1101/2020.03.03.20029843, accessed on 13 April 2020.
Liu, Y., Stillwell, J., Shen, J. and Daras, K. (2014). Interprovincial migration, regional development and
state policy in China, 1985-2010. Applied Spatial Analysis and Policy, 7(1), 47-70.
Mayer, J.D. (2000). Geography, ecology and emerging infectious diseases. Social Science & Medicine,
50(7–8), 937–952.
National Bureau of Statistics. (2019). China Statistics Yearbook 2019. Beijing: China Statistics Press.
National Health Commission of China. (2020). The situation of pneumonia pandemic caused by new
coronavirus by National Health Commission. 21 January 2020.
Population Census Office of State Council and Department of Population and Employment Statistics.
(2012). Tabulations on the 2010 Population Census of the People’s Republic of China, Vol. 3. Beijing:
China Statistical Press.
Shen, J. (2013). Increasing internal migration in China from 1985 to 2005: Institutional versus
17economic drivers. Habitat International, 39(1), 1-7.
Shen, J. (2018). Urbanization, Regional Development and Governance in China. London and New York:
Routledge.
Tian, H. et al. (2020). An investigation of transmission control measures during the first 50 days of the
COVID-19 epidemic in China. Science, 31 Mar 2020: eabb6105.
Tong, M., Hansen, A., Hanson-Easey, S. et al. (2015). Infectious diseases, urbanization and climate
change: Challenges in future China. International Journal of Environmental Research and Public
Health, 12(9), 11025–11036.
Wang, L., & Shen, J. (2017). Comparative analysis of urban competitiveness in the Yangtze River Delta
and Pearl River Delta regions of China, 2000-2010. Applied Spatial Analysis and Policy, 10(3), 401-
419.
WHO. (2020). Report of the WHO-China Joint Mission on Coronavirus Disease 2019 (COVID-19). 16-24
February 2020. Geneva: World Health Organization.
Wolf, M. (2016). Rethinking urban epidemiology: Natures, networks and materialities. International
Journal of Urban and Regional Research, 40(5), 958–982.
Worldometer. (2020). COVID-19 Coronavirus Pandemic. https://www.worldometers.info/coronavirus/,
accessed on 12 March 2020.
Wu, J.T., Leung, K., & Leung, G.M. (2020). Nowcasting and forecasting the potential domestic and
international spread of the 2019-nCoV outbreak originating in Wuhan, China: a modelling study.
Lancet, 395(10225), 689-697.
Wu, T., Perrings, C., Kinzig, A. et al. (2017). Economic growth, urbanization, globalization, and the
risks of emerging infectious diseases in China: A review. Ambio, 46(1), 18–29.
Wuhan Municipal Health Commission. (2019). Bulletin on the situation of pneumonia pandemic by
Wuhan Municipal Health Commission. 31 December 2019.
http://wjw.wuhan.gov.cn/front/web/showDetail/2019123108989, accessed on 30 March 2020.
Wuhan Municipal Health Commission. (2020a). Bulletin on the situation of pneumonia caused by
unknown virus by Wuhan Municipal Health Commission. 3 January 2020.
18http://wjw.wuhan.gov.cn/front/web/showDetail/2020010309017, accessed on 30 March 2020.
Wuhan Municipal Health Commission. (2020b). Bulletin on the situation of pneumonia caused by
unknown virus by Wuhan Municipal Health Commission. 14 January 2020.
http://wjw.wuhan.gov.cn/front/web/list2nd/no/710, accessed on 30 March 2020.
Wuhan Municipal Health Commission. (2020c). Bulletin on the situation of pneumonia caused by new
coronavirus by Wuhan Municipal Health Commission. 19 January 2020.
http://wjw.wuhan.gov.cn/front/web/list2nd/no/710, accessed on 30 March 2020.
Wuhan Municipal Health Commission. (2020d). Bulletin on the situation of pneumonia caused by new
coronavirus by Wuhan Municipal Health Commission. 21 January 2020.
http://wjw.wuhan.gov.cn/front/web/showDetail/2020012109085, accessed on 30 March 2020.
Ying, S., Li, F., Geng, X. et al. (2020). Spread and control of COVID-19 in China and their associations
with population movement, public health emergency measures, and medical resources. medRxiv
2020: 2020.02.24.20027623. doi: https://doi.org/10.1101/2020.02.24.20027623, accessed on 13 April
2020.
Zhu, Y. (2003). The floating population's household strategy and the migration's role in China's
regional development and integration. International Journal of Population Geography, 9(6), 485-502.
Tables
Table 1 Correlation coefficients between number of covid-19 cases and various variables
19Variables Unit D0126 D0207 D0220 D0306
D0126 Case 1 0.942** 0.928** 0.932**
D0207 Case 0.942** 1 0.990** 0.990**
D0220 Case 0.928** 0.990** 1 1.000**
D0306 Case 0.932** 0.990** 1.000** 1
Area 10,000 sq -0.358 -0.344 -0.346 -0.349
km
Pop18 Million 0.709** 0.711** 0.762** 0.763**
UrbanPop18 Million 0.741** 0.733** 0.775** 0.776**
GDP18 Billion 0.700** 0.677** 0.710** 0.712**
Density18 Persons/ sq 0.189 0.143 0.130 0.134
km
Urbans18 % 0.261 0.183 0.165 0.170
GDPPC18 RMB per 0.279 0.192 0.171 0.176
person
UrbanI18 RMB per 0.362* 0.268 0.230 0.237
person
RuralI18 RMB per 0.391* 0.344 0.314 0.318
person
GDPI18 % 0.153 0.222 0.209 0.206
Distance to Hubei km -0.560** -0.594** -0.603** -0.604**
Mig from Hubei Persons 0.627** 0.590** 0.549** 0.554**
Mig to Hubei Persons 0.888** 0.882** 0.880** 0.880**
Jan 20 from Wuhan share % 0.706** 0.750** 0.764** 0.761**
Jan 20 to Wuhan share % 0.804** 0.772** 0.742** 0.746**
Note: * Significance level 0.05; ** Significance level 0.01.
20Table 2 Growth of covid-19 cases in Wuhan, China and the world 20 Jan to 27 March 2020
Date 20 Jan 2020 26 Jan 2020 6 Mar 2020 27 Mar 2020
Rest of World 5
39 17481 427086
China 291
2761 80813 82213
Rest of China 21
1321 13147 14412
Rest of Hubei 12
725 17795 17795
Wuhan 258 715 49871 50006
Data sources: Baidu (2020); Worldometer (2020) for the world number on 26 January 2020; National
Health Commission of China (2020); Wuhan Municipal Health Commission (2020d) for data on 20
January 2020.
Note: China includes the cases in mainland China, Hong Kong, Macau and Taiwan. Rest of China
excludes the cases in Hubei province; Rest of Hubei excludes the cases in Wuhan city.
Table 3 Correlation coefficients between population migration/flow and population and economic size
Variables Pop18 UrbanPop18 GDP18 Mig to Jan 20 from Jan 20 to
Hubei Wuhan Wuhan
share share
Pop18 1 0.970** 0.849** 0.777** 0.629** 0.622**
UrbanPop18 0.970** 1 0.939** 0.741** 0.539** 0.740**
GDP18 0.849** 0.939** 1 0.626** 0.405* 0.786**
Mig to Hubei 0.777** 0.741** 0.626** 1 0.873** 0.704**
Jan 20 from 0.629** 0.539** 0.405* 0.873** 1 0.432*
Wuhan share
Jan 20 to Wuhan 0.622** 0.740** 0.786** 0.704** 0.432* 1
share
Distance to -0.522** -0.522** -0.494** -0.564** -0.556** -0.405*
Hubei
Note: * Significance level 0.05; ** Significance level 0.01.
Table 4 Regression coefficients from stepwise regression
21Independent variable Unstandardized coefficient Standardized t-value Adj. R
coefficient square
D0126 0.895
Constant -44.729 -4.602**
Mig to Hubei 0.001 0.879 14.610**
UrbanI18 0.001 0.337 5.601**
D0207 0.881
Constant -282.209 -4.137**
Mig to Hubei 0.008 0.832 12.781**
RuralI18 0.044 0.734 4.382**
GDPPC18 -0.005 -0.487 -2.918**
D0220 0.873
Constant -260.064 -2.908**
Mig to Hubei 0.008 0.676 7.150**
RuralI18 0.054 0.701 4.041**
GDPPC18 -0.008 -0.592 -3.221**
GDP18 0.042 0.249 2.378*
D0306 0.875
Constant -261.606 -2.928**
Mig to Hubei 0.008 0.677 7.200**
RuralI18 0.054 0.700 4.060**
GDPPC18 -0.008 -0.586 -3.208**
GDP18 0.042 0.249 2.386*
Note: * Significance level 0.05; ** Significance level 0.01.
Figures
22Figure 1
Two stages of the spread of covid-19 in mainland China
Figure 2
Direct and indirect impacts of various determinants on the number of covid-19 cases
23Figure 3
Location of Wuhan and provinces in China. Note: The designations employed and the
presentation of the material on this map do not imply the expression of any opinion
whatsoever on the part of Research Square concerning the legal status of any country,
territory, city or area or of its authorities, or concerning the delimitation of its frontiers or
boundaries. This map has been provided by the authors.
24Figure 4
Number of covid-19 cases by province in mainland China Data source: Baidu (2020).
25You can also read