Central East Local Health Integration Network Long-term Care Home Demand and Utilization - December 2019
←
→
Page content transcription
If your browser does not render page correctly, please read the page content below
Central East
Local Health Integration Network

Long-term Care Home Demand and
Utilization

December 2019
Table of Contents
1. Introduction ......................................................................................... 4
    1.1.   Purpose........................................................................................................................... 4
    1.2.   Background and Scope .................................................................................................. 4
      1.2.1      Table1: Central East LHIN Long-term Care Home Bed Configuration .............. 5
      1.2.1      Figure 1: Distribution of Central East LHIN Long Term Care Homes ............... 6
      1.2.2.     Long-term Care Characteristics in Central East LHIN ....................................... 7
    1.3.   Alternate Level of Care ................................................................................................. 9
    1.4.   Population Demographics ............................................................................................. 9
      1.4.1 Table 2: Population 2016 Census Data .................................................................... 10
      1.4.2 Table 3: Scope of Eligible Redevelopment Projects in Central East LHIN ............ 11
      1.4.3 Table 4: Central East LHIN Current Beds per 1000 Aged 65-74 and 75+ ............ 12
      1.4.4 Table 5: Central East LHIN 2022 Projected Beds per 1000 Aged 65-74 and 75+ . 13
      1.4.5 Table 6: Summary of Statistics at the Sub-region Level ........................................ 15
2. Scarborough North (SN) LHIN Sub-region: ................................ 16
    2.2    Population and Demand for Long-term Care............................................................. 16
      2.2.2 Table 7: Scarborough North –Current LTCH Beds by Geographical Area ............ 17
    2.3    Cultural and Specialized Programming Considerations: .......................................... 18
3 Scarborough South (SS) Sub-region: ............................................ 19
    3.2    Population and Demand for Long-Term Care............................................................ 19
      3.2.1      Table 8: Scarborough South Sub-region– LTCH Beds by Geographical Area .. 19
    3.3    Cultural and Specialized Programming Considerations: .......................................... 21
4 Durham West (DW) Sub-region: ..................................................... 22
    4.2    Population and Demand for Long-term Care............................................................. 22
      4.2.1      Table 9: Durham West – LTCH Beds by Geographical Area ............................ 23
    4.3    Cultural and Specialized Programming Considerations: .......................................... 25
5 Durham North East (DNE) LHIN Sub-region: ............................ 26
    5.2    Population and Demand for Long-term Care............................................................. 26
      5.2.1      Table 10: Durham North East – LTCH Beds by Geographical Area ................. 26
    5.3 Cultural and Specialty Programming Considerations:.................................................. 28
6. Northumberland County (NC) LHIN Sub-region: ..................... 28

2
6.2 Population and Demand for Long-term Care ................................................................. 28
6.2.2 Table 11: Northumberland County – LTCH Beds by Geographical Area ......... 28
6.3 Cultural and Specialized Programming Considerations: .......................................... 30
7 Peterborough City and County (PCC) Sub-region: ................... 31
7.2 Population and Demand for Long Term Care ............................................................ 31
7.2.1 Table 12: Peterborough City and County – LTCH Beds by Geographical Area .... 31
7.3 Cultural and Specialized Programming Considerations: .......................................... 33
8 Haliburton County and City of Kawartha Lakes (HCCKL) Sub-
region: ...................................................................................................... 33
8.2 Population and Demand for Long-term Care............................................................. 33
8.2.1 Table 13: Haliburton County and City of Kawartha Lakes – LTCH Beds by
Geographical Area ................................................................................................ 34
8.3 Cultural and Specialized Programming Considerations: .......................................... 35
9 Final Considerations ........................................................................ 35
9.2 Specialized Programming Considerations: ..................................................................... 35
31. Introduction 1.1. Purpose The purpose of this study is to analyze demand, growth, capacity and need within LHIN Sub-regions and neighbourhoods. A sub-region is a smaller geographic planning region within the Central East LHIN that helps the LHIN to better understand and address patient needs at the local level. In the Central East LHIN there are seven (7) Sub-regions: 1) Scarborough North (SN); 2) Scarborough South (SS); 3) Durham West (DW); 4) Durham North East (DNE); 5) Northumberland County (NC); 6) Peterborough City and County (PCC); and 7) Haliburton County and City of Kawartha Lakes (HCCKL). For more information on LHIN Sub-regions and population, demographics, and health system information, visit our interactive tool on the Central East LHIN website at http://www.centraleastlhin.on.ca/. 1.2. Background and Scope In the Central East LHIN there are 68 Long-term Care Homes with a total of 9,693 long- term care beds distributed across seven (7) Sub-regions. The 9,693 beds consist of 9,514 Long- Stay beds, 16 Interim beds, 45 Short-Stay Respite beds (SSR), 107 Convalescent Care Program (CCP) beds and 11 Beds in Abeyance (BIA). Table 1 below contains additional details at the LHIN Sub-region level. The long-stay column includes interim beds but does not include Beds in Abeyance (BIA). 4
1.2.1 Table1: Central East LHIN Long-term Care Home Bed Configuration
# Beds Long
# LTC Current Stay
LHIN Sub-region (SS, LS, Interim CCP BIA SSR
Homes Incl.
Interim and
BIA) Interim
Scarborough North 5 1,071 1,057 0 10 0 4
Scarborough South 17 3,161 3,071 0 55 11 24
Durham West 7 1,021 1,020 0 0 0 1
Durham North East 12 1,770 1,722 11 32 0 5
Northumberland
8 667 665 0 0 0 2
County
Peterborough City and
8 1,111 1,090 5 10 0 6
County
Haliburton County and
11 892 889 0 0 0 3
City of Kawartha Lakes
Total 68 9,693 9,514 16 107 11 45
Source: 2016-2019 Long Term Care Home Service Accountability Agreements
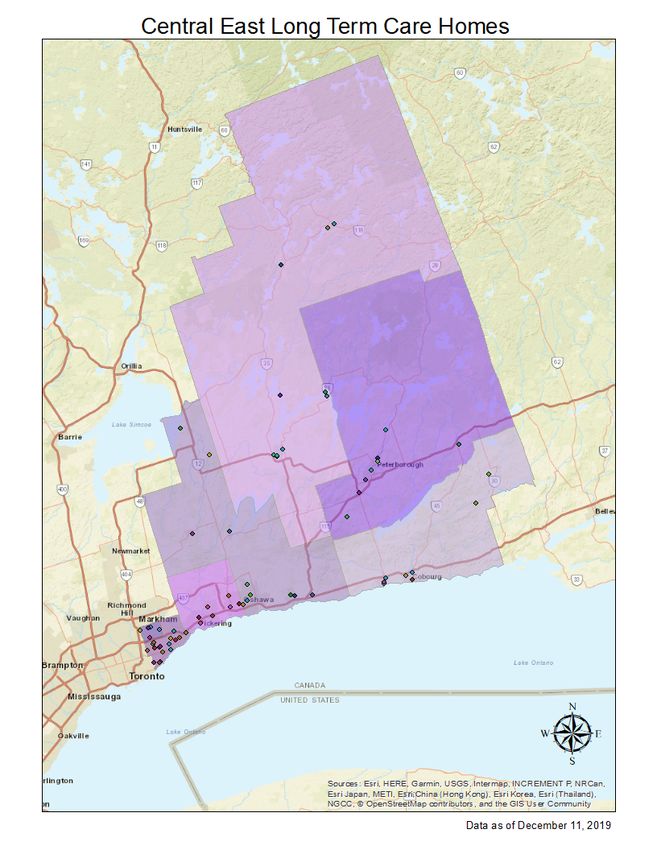
5Figure 1 below provides a snapshot of how the 68 Long Term Care Homes are distributed
across the Central East LHIN.
1.2.1 Figure 1: Distribution of Central East LHIN Long Term Care Homes
6There are also 16 Interim beds located in Peterborough (5 beds) and in Oshawa (11 beds).
Note that Interim beds are subject to temporary licensing and may not be available to the
system over the longer term.
Short-Stay Respite beds (SSR) are renewed annually and the numbers presented above are
the 2019 numbers.
Note that the 11 Beds in Abeyance (BIA) are located in Scarborough South and are currently
not in service. They are licensed and will be considered when these homes redevelop.
This document will investigate population characteristics, long-term care home capacity,
waitlists and demand at the LHIN Sub-region level. It will also touch upon Alternate Level
of Care for Long-Term Care. The need for Long-term Care beds as well as specialized services
such as Dementia and Behavioural Supports is also explored. What is not in scope in this
study is an analysis of the Assisted Living, Adult Day Program or other services designed to
support patients in the community.
1.2.2. Long-term Care Characteristics in Central East LHIN
The document entitled “Environmental Scan 2019-2022 Integrated Health Service Plans”
(the Environmental Scan) is comprised of the data prepared by representatives of the
Health Analytics Branch of the Ontario Ministry of Health and Long-Term Care, the
Access to Care division of Cancer Care Ontario, and Health Shared Services Ontario.
Interpretation of the data provided was completed by representatives of the all LHINs as
a collaborative pan-LHIN project. The following Profile of Long‐Term Care in the Central
East LHIN was included in the Environmental Scan:
1.2.2.1 Long-Term Care Waitlist & Placements
Insight was offered in the Environmental Scan regarding the Long-Stay demand and
selected characteristics of LTCH residents. Note that the Environmental Scan is based
on March 2018 data and waitlist numbers will differ slightly in comparison with the
Long-Term Care Home System Report as well as the Central East LHIN calculations.
Table 6 found on page 14 provides the waitlist data extracted December 11, 2019 from the
Central East LHIN report named ‘Long Term Care Waitlist’ that extracts data from our
electronic patient record Client Health Related Information System (CHRIS).
71.2.2.2 Long-Stay Demand
The Environmental Scan makes the following observations relating to long-stay demand in
the Scarborough North Sub-region,
Comparing within Central East LHIN, the Scarborough North Sub‐region has the
highest shortfall of Long‐Stay beds among all Ontario Sub‐regions.
Note however, according to the Central East LHIN data that Scarborough North also has the
highest number of Out of Region (OOR) applications (2,006 and a high percentage of 3B
applicants (1,297). These 3B applicants potentially include spouses with lower care needs
who tend to apply at the same time as their spouse/partners, seeking the culturally-specific
services provided by these LTCHs and those in other LHINs.
The Ministry of Health and Long-Term Care Health Data Branch September 2019 report
entitled, “Long-Term Care Home System Report from New CPRO” reports the Central East
demand to be at 17,285. Note that demand is calculated by adding existing Long-Term Care
Home residents to the number of residents on the waitlist, and does not represent unique
individuals but rather choices. This is the highest demand in the Province, followed by
Hamilton Niagara Haldimand Brant LHIN (which has the highest number of beds) and next
by Central LHIN. According to this report, the Central East LHIN has the 2nd highest number
of beds and the highest waitlist of 7,842 (not including transfers) with a utilization rate of
99.2%. There were 1,554 clients placed from January to September 2019.
1.2.2.3 Selected Characteristics of Long-Term Care Home Residents
Also included in the Environmental Scan are characteristics related to Long-Term Care
Home Residents.
In Central East LHIN, 84% of Long-Term Care Home Residents were over the age
of 75 with 58% being over the age of 85;
In 2016/17, the mean age of residents of LTC Homes in Central East LHIN was 84;
The mean length of stay for residents of LTC Homes in Central East LHIN was
1,009 days (about 2.8 years) with half of residents remaining in LTC homes for less
than 625 days;
Nearly 81% of residents need extensive help with daily activities such as getting
out of bed, eating, or toileting;
27% are highly or entirely dependent on staff;
82% have some form of cognitive impairment; 28% are severely impaired;
44% exhibit some level of aggressive behaviour related to their cognitive
impairment or mental health condition with 6% exhibiting very severe aggressive
behavior; and
8 65% of active LTC Residents in Central East LHIN LTC Homes have been
identified as having some form of Dementia.
The Central East LHIN reports that from December 2018 to November 2019 there were on
average 43% of patients on waitlists for long-term care homes who exhibit behaviours, with
the highest percentage waiting in hospital. There is no significant difference between
Clusters – Durham Cluster, Scarborough Cluster and Northeast Cluster in terms of the
percentage of patients on LTCH waitlists with behaviours. Currently, the Scarborough
Cluster has the greatest number of patients with behaviours on the waitlists (2,935) followed
by Durham Cluster (1,789) and the Northeast Cluster (1,297).
1.3. Alternate Level of Care
The Alternate Level of Care (ALC) number of patients designated as ALC for LTC and the
total ALC days is reported for each of the seven (7) LHIN Sub-regions. A report conducted
by the Optimus SBR consulting team in April 2016 reviewed the Central East LHIN’s ALC
strategies and outcomes and concluded that “Central East LHIN’s persistently high inpatient
ALC rate is primarily (76%) attributable to ALC patients waiting for LTC. The proportion
waiting for LTC has nearly doubled from 2007, when it was 41%. At the same time,
institutional ALC patients represent a small fraction of all people waiting in the community
for LTC.” The report went on to state that “Central East LHIN has the longest recorded LTC
waitlist for all LHINs, and hence the most serious capacity constraint in LTC relative to its
existing demand. Central East LHIN also has among the largest 75+ populations in the
province which is also expected to grow, suggesting these LTC and ALC pressures will get
progressively worse over time. Further investment in ALC strategies that do not alleviate
LTC demand are likely to have a limited impact on Central East LHIN’s ALC rates going
forward.” Table 6 on page 14 provides ALC rates for each of the LHIN Sub-regions.
1.4. Population Demographics
Table 2 below summarizes the population demographic data for the Central East LHIN
based on the 2016 census data.
91.4.1 Table 2: Population 2016 Census Data
% of
Pop. 65-74 75+ Total
Sub-Region
All Ages Pop. Pop. Pop.
65+
Scarborough
North 175,504 18,005 18,130
21%
Scarborough
423,690 35,975 29,940
South 16%
Durham West 339,825 25,685 17,385 13%
Durham North 28,095
East 306,037 21,595
16%
Northumberland 10,875
County 73,754 7,945
26%
Peterborough 17,550
City and County 138,236 13,975
23%
Haliburton County 14,645
and City of 93,485 10,350
Kawartha Lakes 27%
CE LHIN 1,550,531 150,830 119,320 17%
Ontario 13,448,494 1,266,390 985,265 17%
Source: Health Analytics & Insights Branch. Prepared October 2018.
Note that the Integrated Health Service Plan (IHSP5) contains data which reflects population estimates calculated by the
Health Analytics and Insights Branch (HAIB) based on a combination of census data, including the 2016 Census data
presented above.
The populations 65 and over represent 17% of the total population. Note also that the
population of the Central East LHIN is projected to increase by 6.0% by 2021 and by 11.4%
by 2026.
The Ministry of Finance on its website (2019) states that:
“The arrival of Baby Boomers into the 65+ age group begins in 2011. The number of
seniors is projected to more than double, increasing from 1.8 million in 2009 to 3.7
million by 2030. Even faster growth is projected for the oldest age group during this
period, with the population aged 90+ rising by 147 per cent. By 2030, seniors will
10account for 21.9 per cent of Ontario’s population, much higher than the current
13.7 per cent share.”
Although the various sources of data do not provide exact projections at the LHIN
Sub-region level, the LHIN will continue to see population growth, across all LHIN
Sub-regions with a higher concentration of age 65+ and 75+ (in proportion to overall
population growth) expected outside the Greater Toronto Area (GTA).
Table 3 below outlines the total distribution of Long-Term Care beds, highlighting
those eligible for redevelopment by 2025 (or 2022). Short-stay respite (SSR), Beds in
Abeyance (BIA), and Convalescent Care Program (CCP) beds can be converted to long-
stay and are therefore, included in the total. Note that the 16 Interim beds (temporary
licenses) are also included in the total beds to align to existing statistics related to
waitlists and flow, however, it is cautioned that they are considered temporary
licenses and there is no guarantee that they will be included in redevelopment projects
moving forward.
1.4.2 Table 3: Scope of Eligible Redevelopment Projects in Central East LHIN
Total
Beds
Number Number
Total # Total # New Beds Eligible to
LHIN Sub-region of Homes of Beds
LTCHs Licences Awarded Develop
Eligible Eligible
or
Redevelop
1 + 1 new
Scarborough North 5 1,071 254 224 478
LTCH
11 + 1 New
class LTCH
Scarborough South 17 3,161 with 1,895 257 2,152
additional
beds
Durham West 7 1,021 3 405 124 529
11Total
Beds
Number Number
Total # Total # New Beds Eligible to
LHIN Sub-region of Homes of Beds
LTCHs Licences Awarded Develop
Eligible Eligible
or
Redevelop
Durham North East 12 1,770 8 856 178 1,034
Northumberland
8 667 6 470 29 499
County
Peterborough City
8 1,111 4 + 1 new 425 283 708
and County LTCH
Haliburton County
and City of 11 892 413 0 413
5
Kawartha Lakes
Total 68 9,693 41 4,718 1,095 5,813
Source: Long-Term Care Home Service Accountability Agreements Minister’s Letters- Long-Term Care Home
Bed Allocation
Table 4 below provides an analysis of the current bed supply in the Central East LHIN as
it relates to the beds per 1000 aged 65 to 74 and 75+.
1.4.3 Table 4: Central East LHIN Current Beds per 1000 Aged 65-74 and 75+
Total # Beds Population Beds Per
LHIN
Current Per Beds 65+ 1,000 65+
Sub- 2016 2016
Total # Beds 1,000 Per
region Population Population
LTCHs (all 65 to 1,000
Aged 65-74 Aged 75+
types) 74 75+
SN 1,071 18,005 59 18,130 59 36,135 30
5
12Total # Beds Population Beds Per
LHIN
Current Per Beds 65+ 1,000 65+
Sub- 2016 2016
Total # Beds 1,000 Per
region Population Population
LTCHs (all 65 to 1,000
Aged 65-74 Aged 75+
types) 74 75+
SS 17 3,161 35,975 88 29,940 106 65,915 48
DW 7 1,021 25,685 40 17,385 59 43,070 24
DNE 12 1,770 28,095 63 21,595 82 49,690 36
NC 8 667 10,875 61 7,945 84 18,820 35
PCC 8 1,111 17,550 63 13,975 79 31,525 35
HCCKL 11 892 14,645 61 10,350 86 24,995 36
68 9,693 150,830 64 119,320 81 270,150 36
Total
Source: Health Analytics & Insights Branch. Prepared October 2018.
Table 5 below provides an analysis of the projected bed supply after approved development
and redevelopment projects are complete in 2022.
1.4.4 Table 5: Central East LHIN 2022 Projected Beds per 1000 Aged 65-74 and 75+
Beds
Total Beds Per
LHIN 2016 Beds Per
Total # Beds Population Per 1,000
Sub- Population 1,000
LTCHs (2022) Aged 75+ 1,000 65+
region Aged 65-74 65–74
(Long-stay) 75+
SN 1,295 18,005 18,130 72 71 36
5
SS 17 3418 35,975 29,940 95 114 52
13Beds
Total Beds Per
LHIN 2016 Beds Per
Total # Beds Population Per 1,000
Sub- Population 1,000
LTCHs (2022) Aged 75+ 1,000 65+
region Aged 65-74 65–74
(Long-stay) 75+
DW 7 1145 25,685 17,385 44 66 27
DNE 12 1948 28,095 21,595 69 90 39
NC 8 696 10,875 7,930 64 88 37
PCC 8 1394 17,550 13,945 79 100 44
HCCKL 11 892 14,645 10,330 61 86 36
68 10,788 150,830 119,320 72 90 40
Total
Source: Health Analytics & Insights Branch. Prepared October 2018.
Note that the Integrated Health Service Plan (IHSP5) contains data which reflects
population estimates calculated by the Health Analytics and Insights Branch (HAIB)
based on a combination of census data, including the 2016 Census data presented above.
With the addition of the 1,095 new beds the Central East LHIN will have a total of 5,813
beds and 41 LTCHs to redevelop by 2025.
The Central East LHIN has analyzed the current and projected demand and usage in
Long-Term Care Home beds in the LHIN and in each of the seven (7) LHIN Sub-regions
and the communities within those Sub-regions. A more in-depth analysis of the
population of seniors, demographics, growth projections, number of LTCH beds at the
neighbourhood level, waitlists and LTC turn-over rate is included in Table 6 below and
the sections that follow. Note that Table 6 presents a number of statistics and below
each ranks the LHIN Sub-region from highest to lowest for each statistic. The waitlist
data used to calculate the beds per person on the waitlist and number of years to place
people on the waitlist is based on waitlist numbers that capture unique individuals
waiting as first choice.
141.4.5 Table 6: Summary of Statistics at the Sub-region Level
SN SS DW DNE NC PCC HCCKL
Population
65-74 18,005 35,975 25,685 28,095 10,875 17,550 14,645
1st 2nd 4th 3rd 7th 5th 6th
Population 18,130 29,940 17,385 21,595 7,945 13,975 10,350
over 75 1st 2nd 4th 3rd 7th 5th 6th
Population 36,135 65,915 43,070 49,690 18,820 31,525 24,995
over 65 4th 1st 3rd 2nd 7th 5th 6th
Percentage of
Total 21% 16% 13% 16% 26% 23% 27%
Population
over 65 5th 5th
4th 6th 2nd 3rd 1st
(tie) (tie)
Beds 1,071 3,161 1,021 1,770 667 1,111 892
(long-stay)
4th 1st 5th 2nd 7th 3rd 6th
Beds Per
1000 65+ 30 48 24 36 35 35 36
(current)
4th 1st 5th 2nd (tie) 3rd (tie) 3rd (tie) 2nd (tie)
Beds Per
1000 65+ 36 52 27 39 37 44 36
(projected)
With new
6th 1st 7th 3rd 4th 2nd 5th (tie)
beds
27 38 152 31 71 37
ALC for LTC
Patients
6th (tie) 3rd 1st 5th 2nd 4th
14,010 13,113 31,212 5,297 21,176 7,579
ALC for LTC
(Days)
3rd (tie) 4th 1st 6th 2nd 5th
1,248 1,804 1,654 609 1,367 657
3,260*
15SN SS DW DNE NC PCC HCCKL
Waitlist
(1st choice,
1st 5th 2nd 3rd 7th 4th 6th
unique)
Waiting at a
category 1- 4,204 2,012 2,460 2,406 680 1,376 700
3A/4A
(greatest
1st 4th 2nd 3rd 7th 5th 6th
need)
Ave. Annual
Placement 217 926 292 515 233 313 312
7th 1st 5th 2nd 6th 3rd 4th
# Beds per
Person on WL 0.3 2.46 0.57 1.04 1.1 0.8 1.36
(1st choice)
7th 1st 6th 4th 3rd 5th 2nd
# Years to
Placement 14.11** 1.42 6.42 3.00 2.32 3.54 2.15
from Waitlist;
approx 1st 7th 2nd 4th 5th 3rd 6th
# Out of 2,006** 749 277 299 59 98 54
Region
Applicants
1st 2nd 4th 3rd 6th 5th 7th
*Represents patients who are counted once only for their first choice.
**Scarborough North has a significant portion of applicants from within and outside of
region applying for culturally specific homes.
2. Scarborough North (SN) LHIN Sub-region:
2.2 Population and Demand for Long-term Care
The Environmental Scan identifies the following characteristics of the Scarborough North
LHIN Sub-region in relation to the other LHIN Sub-regions in the Province:
7th highest percent of residents with one (1) or more unplanned ED visits in the last
30 days of life;
5.8% of patients from Scarborough North Sub‐region were complex (4+ conditions).
(Ontario ‐ 5.8%);
7th highest population density;
16 Lowest percentage of residents who report English as their mother tongue in all
Ontario Sub-regions;
Highest percentage of residents who report no knowledge of English or French;
Highest percentage of residents who were immigrants;
4th highest percentage of residents who were recent immigrants. The country of origin
for the largest proportion of recent immigrants was China;
Highest percentage of residents who were first generation Canadian;
Highest percentage of population who were visible minorities;
2nd lowest percentage of residents reporting Aboriginal identity;
Across Ontario’s Sub‐regions, the utilization rate for Home Care Services for
Scarborough North was 38.3 per 1,000 residents (the second lowest in the LHIN);
Among the eight (8) highest Sub‐regions in nursing visit rates in 2017/18;
4th highest percentage of residents who died in hospital;
3rd highest percentage of seniors (65+) living in low‐income households;
3rd highest percent of residents with one (1) or more unplanned ED visits in the last
30 days of life (tied with North York West);
At the end of 2017/18, residents of Scarborough North had had the 8th longest wait to
date for discharge from an ALC designation in hospital (open cases).
The second lowest home care referrals per 1,000 population (38.1) among Central East
LHIN Sub-regions.
Table 7 below provides a detailed LTCH overlay of Long Term Care Homes by
neighbourhood in the Scarborough North Sub-region.
2.2.2 Table 7: Scarborough North –Current LTCH Beds by Geographical Area
Long-term
Geographical Area Long-term Care Home Beds
Care Homes
Yee Hong 249 Long Stay
Agincourt North Scarborough
Finch (1 Respite)
Agincourt South- No Homes in
0
Malvern West this Postal Code
No Homes in
L'Amoreaux 0
this Postal Code
Milliken Mon Sheong 158 Long Stay
(2 Respite)
17Long-term
Geographical Area Long-term Care Home Beds
Care Homes
Yee Hong
154 Long Stay
McNichol (1 Respite)
Steeles Tendercare 244 Long Stay
(10 Convalescent Care Beds)
Tam O'Shanter-Sullivan Sheppard Lodge 252 Long Stay
Scarborough North 1,057 Long Stay
Sub-region 5 4 Respite
Total - Current 10 Convalescent Care Beds
Source: Health Analytics Branch LHIN and Sub-region Census 2016 Profile Central East LHIN Sub-region
Profiles. Central East LHIN 2016-2019 Long-Term Care Home Service Accountability Agreements.
2.3 Cultural and Specialized Programming Considerations:
All but one (1) of the five (5) LTCs in the Scarborough North Sub-region primarily provides
cultural and linguistic programming to Chinese-speaking residents:
Mon Sheong Scarborough (160 beds) – identified as Chinese cultural/linguistic;
Yee Hong Centre for Geriatric Care – Scarborough Finch (250 beds) – identified as
Chinese cultural/linguistic with a 25-bed Japanese Unit;
Yee Hong Centre for Geriatric Care- McNicholl (155 beds) – identified as Chinese
cultural/linguistic;
Tendercare Living Centre (254 beds) – 95% Chinese cultural/linguistic population (no
formal identification); and
Shepherd Lodge (252 beds) – identified as Pentecostal/religious.
The percentage of immigrants in Scarborough North is the highest at 66.9%. In addition,
there were 0.2% of people identifying as indigenous in this LHIN Sub-region.
The Scarborough North electoral riding demographics are described by Revolvy.com (2018)
as: “Ethnic groups: 46.0% Chinese, 20.8% White, 15.1% South Asian, 5.3% Black, 3.8%
Filipino, 1.9% West Asian, 1.6% Arab. Languages spoken are 41.3% Chinese, 32.5% English,
5.1% Tamil, 2.3% Tagalog, 1.8% Armenian, 1.7% Arabic, 1.6% Greek, 11.4% Italian, 1.4%
Urdu, and 1.2% Persian.”
183 Scarborough South (SS) Sub-region:
3.2 Population and Demand for Long-Term Care
The Environmental Scan, identifies the following characteristics of the Scarborough South
Sub-region in relation to the other LHIN Sub-regions in the province:
6.3% of patients from Scarborough South Sub‐region were complex (4+ conditions)
(Ontario ‐ 5.8%);
5th highest population;
8th highest percentage of residents who were first generation Canadian;
4th highest percentage of residents who were visible minorities;
5th highest percentage of residents who died in hospital;
8th highest percentage population living below the low‐income measure;
7th highest percent of residents with one or more unplanned ED visits in the last 30
days of life;
Across Ontario’s sub‐regions, the utilization rate for Home Care Services for
Scarborough South was 39.9 per 1,000 residents (the third lowest in the LHIN); and
Across Ontario’s sub‐regions, Scarborough South and Durham North East had the
seventh and eighth highest number of active patient referrals with 17,860 and 15,879,
respectively.
Table 8 below provides a detailed LTCH overlay by neighbourhood and population
distribution in the Scarborough South Sub-region.
3.2.1 Table 8: Scarborough South Sub-region– LTCH Beds by Geographical Area
Geographical
Long-term Care Homes Long-term Care Home Beds
Area
191 Long Stay
Rouge (M1B) Extendicare Rouge Valley
(1 Respite)
Tony Stacy Centre for 96 Long Stay
Centennial Veteran’s Care (4 Respite)
Scarborough
(M1C) Altamont Care Community 157 Long Stay
(right next to Rouge) (2 Respite)
Eglinton East 195 Long Stay
Trilogy
(M1E) (2 Respite)
19Geographical
Long-term Care Homes Long-term Care Home Beds
Area
167 Long Stay
Guildwood Extendicare Guildwood
(2 Respite)
230 Long Stay
Morningside Seven Oaks (2 Respite and 17 Convalescent Care
Beds)
West Hill Ehatare 32 Long Stay
127 Long Stay
Woburn (M1G) Extendicare Scarborough (3 Respite 20 Convalescent Care Beds
and 4 BIA beds)
No Homes in this Postal
M1H 0
Code
No Homes in this Postal
M1J 0
Code
No Homes in this Postal
M1K 0
Code
Clairlea-
Birchmount Ina Grafton Gage 128 Long Stay
(M1L)
M1M No Homes in this Postal
Code N/A
Craiglee 169 Long Stay
Birchcliffe-
Cliffside (M1N)
Midland Gardens 297 Long Stay (2 Respite)
20Geographical
Long-term Care Homes Long-term Care Home Beds
Area
300 Long Stay
Bendale Acres
(2 Respite)
Bendale (M1P)
Rockcliffe Care Community 202 Long Stay (2 Respite)
263 Long Stay
Kennedy Lodge
(1 Respite, 18 Convalescent Care Beds
and 7 BIA beds)
Dorset Park 127 Long Stay
Hellenic Home
(1 Respite)
Fieldstone Commons 224 Long Stay
Wexford/
Maryvale The Wexford 166 Long Stay
(M1R)
No Homes in this Postal
M1X 0
Code
Scarborough
South Sub- 3,071 Long Stay
Region 17 24 Respite
55 Convalescent Care Program
Total – 11 Beds In Abeyance
Current
Source: Health Analytics Branch LHIN and Sub-region Census 2016 Profile Central East LHIN Sub-region
Profiles. Central East LHIN 2016-2019 Long-Term Care Home Service Accountability Agreements.
3.3 Cultural and Specialized Programming Considerations:
Scarborough South has a rich tapestry of linguistic and cultural demographics, including
English, French, Tamil, Cantonese, Bengali, Tamil, Tagalog and Urdu to name the top few
(Toronto.ca, 2018). Currently the LTCHs in Scarborough South feature the following
services:
Bendale Acres has a French Language unit;
Ehatare- services an Estonian population;
Hellenic Home – services a Greek community;
Fieldstone Commons has an Armenian Unit;
21 Extendicare Scarborough has a Tamil Unit and a high population of Chinese
speaking residents, although not officially designated as providing services to this
population;
Kennedy Lodge has a high population of Chinese speaking residents, although not
officially recognized as providing services to this population;
Seven Oaks reports having a young adult unit, although it is not officially
recognized as providing services to this population; and
Tony Stacey Centre for Veteran’s Care – has veteran’s priority access beds.
4 Durham West (DW) Sub-region:
4.2 Population and Demand for Long-term Care
Increased growth in the areas to the north and within Pickering, Ajax and Whitby are
expected. Although the demographics indicate that the growing population is primarily
comprised of working-age families, these families may also have aging parents who will
require long-term care close to their loved ones. It is also expected that the Durham
population will grow to 1.2 million by 2041. (www.durham.ca, 2018).
The Environmental Scan identifies the following characteristics of the Durham West LHIN
Sub-region in relation to the other LHIN Sub-regions in the Province:
4.6% of patients from Durham West Sub‐region were complex (4+ conditions).
(Ontario ‐ 5.8%);
7th lowest percentage of population aged 65+;
8th lowest percentage of population aged 75+;
In 2017/18, residents of Durham West had the 6th longest wait before being
discharged from hospital with an ALC designation (closed cases); and
Across Ontario’s Sub‐regions, the utilization rate for Home Care Services for Durham
West was 37.3 per 1,000 residents (the second lowest in the LHIN).
Table 9 below provides the location of LTC Homes and beds by geographic neighbourhood
in the Durham West Sub-region.
224.2.1 Table 9: Durham West – LTCH Beds by Geographical Area
Geographical Area Long-term Care Homes Long-term Care Home Beds
Ajax
No Homes in this Postal
Ajax Northeast 0
Code
Ajax Northwest Winbourne Park 109 Long Stay
(1 Respite)
No Homes in this Postal
Ajax Waterfront 0
Code
No Homes in this Postal
Applecroft 0
Code
Carruthers N/A 0
Central Ajax N/A 0
100 Long Stay
Downtown Ajax Ballycliffe Lodge
No Homes in this Postal
Riverside-Hermitage 0
Code
No Homes in this Postal
Westney Heights 0
Code
Whitby
No Homes in this Postal
Brooklin East 0
Code
No Homes in this Postal
Brooklin West 0
Code
23Geographical Area Long-term Care Homes Long-term Care Home Beds
No Homes in this Postal
Cochrane South 0
Code
Downtown Whitby Fairview Lodge 198 Long Stay
No Homes in this Postal
Dryden Anderson 0
Code
No Homes in this Postal
Dryden East 0
Code
No Homes in this Postal
Manning 0
Code
Whitby Brock North Village of Taunton Mills 120 Long Stay
Sunnycrest Nursing Home 136 Long Stay
Whitby South
No Homes in this Postal
Williamsburg 0
Code
Pickering
No Homes in this Postal
Amberlee 0
Code
No Homes in this Postal
Brock Ridge Pickering 0
Code
No Homes in this Postal
Dunbarton 0
Code
Frenchmans Bay Bay Ridges 124 Long Stay
No Homes in this Postal
West Rouge 0
Code
24Geographical Area Long-term Care Homes Long-term Care Home Beds
Pickering City Centre Orchard Villa 233 Long Stay
No Homes in this Postal
Pickering North 0
Code
Durham West Sub-
1,020 Long Stay
region 7
1 Respite
Totals - current
Source: Health Analytics Branch LHIN and Sub-region Census 2016 Profile Central East LHIN Sub-region
Profiles. Central East LHIN 2016-2019 Long-Term Care Home Service Accountability Agreements.
4.3 Cultural and Specialized Programming Considerations:
Ontario Shores (OS) has recently opened a unit for people designated ALC to LTC with
behaviours, although this will specifically address a hospital need and is a provincial
resource.
According to the Durham Region Commissioner of Planning and Economic Development
#2018-INFO-53, #2017-INFO-66 and #2017-INFO-135 Reports, the following demographics
represent Durham Region:
In 2016, visible minorities comprised 27.1% of Durham’s population, which
represents an increase from 2011 (20.7%), 2006 (16.8%) and 2001 (12.4%).
Respondents who reported being South Asian (8.6%), Black (8%), Filipino (2.3%) and
Chinese (1.9%) comprise the largest groups of visible minorities.
In 2016, 11,930 persons in Durham (2% of the population) reported identity with at
least one (1) Aboriginal group. This represents an increase from 2011 (8,905 persons
or 1.5%) and 2006 (6,565 persons or 1.2%).
Approximately 15% of Durham residents reported a mother tongue different than
either of Canada’s two (2) official languages (English & French) in 2016. The most
prevalent non-official languages reported as mother tongue in Durham in include (in
rank order): Urdu (Pakistani), Tamil, Tagalog (Filipino), Italian, Spanish, Persian
(Farsi), Polish, Arabic, German, Mandarin, Portuguese, and Cantonese.
25According to the Durham Region Health Department’s Population at a Glance (2019), the
aging of the population is apparent with growth occurring in ages 55 and older. In
particular, seniors 90 years and older had the highest population growth in Durham Region
with an overall increase of 114%. The largest increase occurred in Pickering where the
population of seniors 90 and older almost tripled, going from just over 250 in 2008 to over
630 in 2018.
5 Durham North East (DNE) LHIN Sub-region:
5.2 Population and Demand for Long-term Care
The Environmental Scan identifies the following characteristics of the Durham North East
LHIN Sub-region in relation to the other LHIN Sub-regions in the Province:
6.1% of patients from Durham North East Sub‐region were complex (4+ conditions)
(Ontario ‐ 5.8%);
Compared to Ontario, the proportion of people with a regular medical doctor was
significantly higher in Durham North East;
Across Ontario’s Sub‐regions, Durham North East had the 8th highest number of
active patient referrals with 15,879; and
The utilization rate for Home Care Services for Durham North East was 49.6 per
1,000 residents (the highest rate in the LHIN).
Table 10 below provides a summary of LTCH beds by neighbourhood level for the Durham
North East LHIN Sub-region.
5.2.1 Table 10: Durham North East – LTCH Beds by Geographical Area
Long-term Care Home
Geographical Area Long-term Care Homes
Beds
147 Long Stay
Lakeview Manor
(2 Respite)
Brock
54 Long Stay
Bon Air Residence
(1 Respite)
60 Long Stay
Clarington Marnwood Lifecare Centre
26Long-term Care Home
Geographical Area Long-term Care Homes
Beds
184 Long Stay
Glen Hill Strathaven (15 Convalescent Care
Program
11 Interim)
87 Long Stay
Fosterbrooke
(1 Respite)
Thornton View 154 Long Stay
157 Long Stay
(1 Respite and 17
Extendicare Oshawa
Convalescent Care
Oshawa Program)
Hillsdale Estates 300 Long Stay
Hillsdale Terraces 200 Long Stay
Chartwell Wynfield 172 Long Stay
Port Perry / Scugog / 107 Long Stay
Mississaugas of Scugog Port Perry Place
Island
Uxbridge Reachview Village 100 Long Stay
1,722 Long Stay
5 Respite
TOTAL 12 32 Convalescent Care
Program
11 Interim
Source: Health Analytics Branch LHIN and Sub-region Census 2016 Profile Central East LHIN Sub-region
Profiles. Central East LHIN 2016-2019 Long-Term Care Home Service Accountability Agreements.
275.3 Cultural and Specialty Programming Considerations:
According to the “Durham Region Profile”, located on the Regional Municipality of Durham
website, the majority of immigrants in the Durham North East communities are from the
United Kingdom, Algeria, and to a lesser degree, other European countries. Oshawa has a
slightly more diverse population with people from Sri Lanka, the Philippines and Pakistan
to name a few.
According to the Environmental Scan, 2.7% of the population in this LHIN Sub-region has
an Aboriginal identity; 1.6% has a First Nations identity and 1% has a Metis identity
Population and Demand for Long Term Care.
6. Northumberland County (NC) LHIN Sub-region:
6.2 Population and Demand for Long-term Care
The Environmental Scan identifies the following characteristics of the Northumberland
County LHIN Sub-region in relation to the other LHIN Sub-regions in the Province:
5th highest percentage of residents who reported English as their mother tongue;
4th lowest percentage of residents who were recent immigrants;
6th highest percentage of patients receiving palliative care who died in hospital; and
The utilization rate for Home Care Services for Northumberland County was 69.1 per
1,000 residents (the second highest in the LHIN).
Table 11 below provides population demographics at the neighbourhood level for the
Northumberland County LHIN Sub-region.
Northumberland County in its “2009 Growth Management Strategy” published on
Northumberland County’s website, forecasted that by 2031”, the population in the County
will increase to 115,910. The report also states that 80% of recent migrants are of retirement
age.
6.2.2 Table 11: Northumberland County – LTCH Beds by Geographical Area
Long-term Care
Geographical Area Long-term Care Homes
Home Beds
Alnwick/ Haldimand No Homes in this Postal Code 0
Alderville First Nation
28Long-term Care
Geographical Area Long-term Care Homes
Home Beds
Streamway Villa 59 Long Stay
Cobourg Extendicare Cobourg 69 Long Stay
Golden Plough Lodge 151 Long Stay
Cramahe No Homes in this Postal Code 0
Hamilton No Homes in this Postal Code 0
58 Long Stay
Regency Manor
(2 Respite)
Port Hope
97 Long Stay
Hope St Terrace
Extendicare Port Hope 128 Long Stay
Burnbrae Gardens 43 Long Stay
Trent Hills
CVH – Warkworth Place 60 Long Stay
Totals - current 665 Long Stay
8
2 Respite
Source: Health Analytics Branch LHIN and Sub-region Census 2016 Profile Central East LHIN Sub-region
Profiles. Central East LHIN 2016-2019 Long-Term Care Home Service Accountability Agreements.
296.3 Cultural and Specialized Programming Considerations: According to the Environmental Scan, 2.7% of the Northumberland County’s Sub-region’s population is of Aboriginal identity; 1.9% is of First Nations identity and .8% is of Metis identity. 30
7 Peterborough City and County (PCC) Sub-region:
7.2 Population and Demand for Long Term Care
The Environmental Scan identifies the following characteristics of the Peterborough City
and County LHIN Sub-region in relation to the other LHIN Sub-regions in the Province:
7th highest percentage of residents who reported English as their mother tongue;
3rd highest percentage of patients who received palliative care who died in hospital in
2016/17;
Among the eight (8) Sub‐regions with the highest percentage of complex patients (4+
conditions);
Among the highest eight (8) ranking Ontario Sub‐regions for total length of stay;
In 2017/18, residents of Peterborough City and County had the 2nd longest wait
before being discharged from hospital with an ALC designation (closed cases);
Among the highest length of stay in acute hospital beds (including acute days and
days waiting for an alternate level of care) in 2016/17; and
7th highest inpatient rehabilitation admission rate in the Province.
The 2011 census figures from Statistics Canada show nearly one (1) in five (5) people in
Peterborough was aged 65 or older in 2011 - 19.5%, the highest ratio in the country among
municipalities. According to the City of Peterborough’s “Planning Peterborough to 2031”,
(2009), by 2031, the population is expected to grow to 88,000.
Table 12 below provides a summary of Long Term Care Home beds at the neighbourhood
level for the Peterborough City and County LHIN Sub-region.
7.2.1 Table 12: Peterborough City and County – LTCH Beds by Geographical Area
Long-term Care
Geographical Area Long-term Care Homes
Home Beds
Asphodel-Norwood Pleasant Meadow Manor 61 Long Stay
Cavan-Monaghan Centennial Place Millbrook Inc. 128 Long Stay
Springdale Country Manor 68 Long Stay
Douro-Dummer No Homes in this Postal Code 0
Galway-Cavendish and No Homes in this Postal Code 0
Harvey
31Long-term Care
Geographical Area Long-term Care Homes
Home Beds
Trent Lakes No Homes in this Postal Code 0
Havelock-Belmont-Methuen No Homes in this Postal Code
0
North Kawartha No Homes in this Postal Code 0
Otonabee-South Monaghan, No Homes in this Postal Code 0
Hiawatha First Nation
159 Long Stay
(2 Interim beds, 3
Extendicare Peterborough Respite and
10 Convalescent Care
Program)
Peterborough Riverview Manor Nursing 124 Long Stay
Home
St. Joseph’s At Fleming 200 Long Stay
Fairhaven 252 Long Stay
(3 Interim and 1
Respite)
Smith-Ennismore-Lakefield - 98 Long Stay
Selwyn and Curve Lake First Extendicare Lakefield
(2 Respite)
Nation
1,090 Long stay
6 Respite
Totals – current 8 5 Interim
10 Convalescent
Care
Source: Health Analytics Branch LHIN and Sub-region Census 2016 Profile Central East LHIN Sub-region
Profiles. Central East LHIN 2016-2019 Long-Term Care Home Service Accountability Agreements.
327.3 Cultural and Specialized Programming Considerations:
According to the Environmental Scan, 4.4% of the population in Peterborough City and
County is of Aboriginal identity, 3.0% of the population is of First Nations identity and 1.4%
of the population is of Metis identity. These are the highest rates in the LHIN.
Operators of redeveloping LTCHs in Peterborough City and County have indicated a
willingness to consider building a culturally safe and appropriate unit for First Nations or
Indigenous patients.
Note that the Peterborough Regional Health Centre also has a transitional behavioural unit
which is not designated under the Long-Term Care Act, 2007.
8 Haliburton County and City of Kawartha Lakes (HCCKL) Sub-region:
8.2 Population and Demand for Long-term Care
The Environmental Scan identifies the following characteristics of the Haliburton County
and City of Kawartha Lakes LHIN Sub-region in relation to the other LHIN Sub-regions in
the Province:
Haliburton County and City of Kawartha Lakes has the highest percentage of
population aged 65+ and highest percentage of population aged 75+ of all the 76
Ontario Sub-regions. Note that this represents a percentage of total population and
not the highest number of people over 65 and 75;
3rd highest percentage of residents who reported English as their mother tongue;
2nd lowest percentage of residents who were recent immigrants;
2nd highest percentage of patients receiving palliative care who died in hospital in
2016/17;
Among the eight (8) Sub‐regions with the highest percentage of complex patients (4+
conditions); and
Among the eight (8) Sub‐regions with the highest percentage of high cost healthcare
users.
33Table 13 below provides population demographics at the neighbourhood level for the
Haliburton County and City of Kawartha Lakes LHIN Sub-region.
8.2.1 Table 13: Haliburton County and City of Kawartha Lakes – LTCH Beds by
Geographical Area
Long-term Care Home
Geographical Area Long-term Care Homes
Beds
Algonquin Highlands No Homes in this Postal Code 0
Extendicare Haliburton 60 Long Stay
Dysart and Others
Highland Wood 30 Long Stay
Highlands East No Homes in this Postal Code 0
Caressant Care Lindsay 124 Long Stay
Caressant Care On McLaughlin Road 96 Long Stay
Extendicare Kawartha Lakes 64 Long Stay
Fenelon Court 67 Long Stay
Kawartha Lakes
Frost Manor 62 Long Stay
Pinecrest Nursing Home 65 Long Stay
Specialty Care Case Manor 96 Long Stay
164 Long Stay
Victoria Manor Home for the Aged
(2 Respite)
61 Long Stay
Minden Hills Hyland Crest Senior Citizen's Home
(1 Respite)
Haliburton County and
889 Long Stay
City of Kawartha Lakes 11
(3 Respite)
Sub-Region Total
Source: Health Analytics Branch LHIN and Sub-region Census 2016 Profile Central East LHIN Sub-region
Profiles. Central East LHIN 2016-2019 Long-Term Care Home Service Accountability Agreements.
348.3 Cultural and Specialized Programming Considerations:
According to the Environmental Scan, 2.5% of the population in the Haliburton County and
City of Kawartha Lakes Sub-region is of Aboriginal identity, 1.4% of the population is of First
Nations identity and 1.1% of the population is of Metis identity. (The Environmental Scan).
9 Final Considerations
Demand and capacity can be difficult to determine based on a single indicator. There are
many factors to take into consideration such as:
Waitlists – often cultural, linguistic or religious designated or identified LTCHs may
attract significant out of region or spousal reunification applications;
Significant population growth is expected, particularly in Durham West and Durham
North East;
The cost, availability and zoning of land remains a significant issue in Durham Region
and Scarborough;
Rural homes face challenges, particularly due to size and potential restrictions on
movement out of communities;
9.2 Specialized Programming Considerations:
a. All seven (7) LHIN Sub-regions require more secure units;
b. Each cluster (Scarborough, Durham and North East) should have access to a
behavioural specialized unit;
c. All seven (7) Sub-regions should have access to high acuity priority access beds
(i.e. bariatric, IV, vented patients) Additional data is required to scope the demand
for these beds;
d. More beds need to be offered at the basic rate. On average, approximately 66% of
all waitlists in the Central East LHIN are for basic beds.
If you have questions or would like to discuss your redevelopment plans with the Central
East LHIN, please contact:
Emily Van de Klippe
Director - Quality and Performance, Home and Community Care
Central East Local Health Integration Network
920 Champlain Court | Whitby, ON | L1N 6K9
Telephone: 905-430-3308 x 3213
Toll Free: 1-800-263-3877
Email: Emily.VandeKlippe@lhins.on.ca
35You can also read