Visitor Opinions about the Layout of The Price of Freedom: Americans at War - National Museum of American History Smithsonian Institution Offi ce ...
←
→
Page content transcription
If your browser does not render page correctly, please read the page content below
Visitor Opinions about the Layout of
The Price of Freedom: Americans at War
               An Exhibition at the
     National Museum of American History

           Smithsonian Institution
         Office of Policy and Analysis
               Washington DC

                  June 2005
Table of Contents
Acknowledgements ................................................................................................. ii
Background ..............................................................................................................1
Survey Methodology................................................................................................2
Conclusions ..............................................................................................................2
Visitor Reaction to The Price of Freedom: Americans at War (PoF) .....................4
Preferences of Museum Visitors ..............................................................................6
Layout and Design of PoF .......................................................................................8
Exhibition Entrance ...............................................................................................11
The Public Space Between The American Presidency (TAP) and PoF .................13
Demographic Characteristics of PoF Visitors .......................................................15
Endnotes.................................................................................................................16
Appendix A: Survey Questionnaire .......................................................................17
Appendix B: Tables of Survey Responses .............................................................18
Page i
Exhibition Layout Survey
Office of Policy and Analysis
Smithsonian Institution
June 2005ACKNOWLEDGEMENTS
Soon after The Price of Freedom: Americans at War (PoF)opened, the Director of the
National Museum of American History (NMAH) asked the Office of Policy and Analy-
sis (OP&A) to review the layout of the exhibition design, including the public space in
front of the exhibition. The study was designed and executed by David Karns and Zahava
Doering, who succeeded in capturing visitor opinions about intangible, as well as tan-
gible, matters. Their work will help the museum and other museums to understand better
how different people perceive physical design aspects of exhibitions. As usual, designing
the survey, collecting the data, analyzing the results, and preparing a report is a complex
process. I would like to extend my appreciation to both analysts for their professionalism
and know that this study will contribute to improved decision making regarding exhibi-
tion spaces. In addition to the two analysts, Amy Marino, OP&A, provided invaluable
assistance by training approximately three dozen NMAH staff and volunteer interviewers.
She ably managed the process of scheduling interviewing sessions covering this survey of
PoF visitors as well as three other surveys at the same time. Lance Costello contributed
quality assurance with careful copy reading and editing. We acknowledge the invalu-
able assistance of Judy Gradwohl, Associate Director for Public Programs, NMAH, Julia
Garcia, Program Assistant, NMAH, and Andrea Lowther, Manager of Visitor Programs,
NMAH, in all facets of the study. Of course, I must thank Brent Glass, Director, NMAH,
for his interest in the lessons of PoF with regard to exhibition layout.
Carole M. P. Neves, Director
Office of Policy and Analysis
Page ii
Exhibition Layout Survey
Office of Policy and Analysis
Smithsonian Institution
June 2005BACKGROUND ferent conflicts are projected on a scrim and artifacts
from different periods are highlighted through theatri-
The National Museum of American History (NMAH) cal lighting effects. The entrance is defined by a vir-
opened a major permanent exhibition about American tual doorway formed by glass blocks in the floor and
military history in November 2004 called The Price lights in the ceiling that divide the exhibition from the
of Freedom: Americans at War (PoF). remodeled public space between PoF and The Ameri-
can Presidency (TAP) and Philadelphia exhibitions
In approximately 18,000 square feet, PoF presents a across the hallway
history of the interactions between American society
and military from before the Revolutionary War to re- NMAH asked the Office of Policy & Analysis
cent actions in Afghanistan and Iraq. PoF does not at- (OP&A) to study visitor reactions to three aspects of
tempt to present an exhaustive military history; some the layout and design of PoF: (1) perceptions of the
periods receive more attention than other periods. ease of navigating through the exhibition (wayfind-
The underlying story of the exhibition is that Ameri- ing); (2) reactions to the PoF entrance; and (3) reac-
can freedom has been bought with the sacrifices of tions to the remodeled public space in front of the
American soldiers, sailors, and aviators over the last exhibition and between PoF and TAP. This study did
two plus centuries. PoF devotes space to eight con- not include visitor assessments of the exhibition’s
flicts covering the span of American history: (1) War content or presentation.
of Independence; (2) Wars of Expansion; (3) Civil
War; (4) World War I; (5) World War II; (6) Cold War;
(7) Vietnam War; and (8) New American Roles. The
exhibition uses multiple paths through the exhibition
with a number of wayfinding guides to aid visitors.
The exhibition entrance introduces a new, dynamic
multimedia design. Changing images representing dif-
Page 1
Exhibition Layout Survey
Office of Policy and Analysis
Smithsonian Institution
June 2005SURVEY METHODOLOGY CONCLUSIONS
OP&A designed, tested, and distributed a one-page The Price of Freedom: Americans at War is an
self-administered questionnaire (See Appendix A) eminently successful exhibition from the perspective
addressing the three topics of interest to NMAH. Be- of overall visit experiences. No single Smithsonian
tween April 5 and April 17, NMAH staff, trained by exhibition surveyed by OP&A has had as many
OP&A in standard survey procedures, intercepted eli- satisfied visitors as PoF with nearly 80 percent rating
gible PoF visitors.a* Eligible visitors excluded visitors their experience as “superior” or “excellent.” These
under the age of 12 and persons who were visiting high ratings were confirmed in a survey of visitors
PoF as part of an organized group. Thus, the sample exiting NMAH during the same time period in 2005.
includes only “voluntary” visitors to PoF. Some
visitors come to the National Mall museums with One out of seven visitors to PoF are strictly PoF des-
organized groups, but visit exhibitions as individuals. tination visitors—that is, visitors who came specifi-
Such visitors were defined as eligible. In particular, cally to see PoF and were visiting NMAH only.
a number of students came with school groups, but
appeared to visit PoF as individuals or a small group The major conclusion that emerges from this survey
rather than an organized group. of visitors to PoF is that different segments of NMAH
visitors have differences in preferences for exhibition
Of the 749 visitors selected to participate, 534 com- entrances, layouts, and public space design. To adopt
pleted questionnaires for a cooperation rate of 71 a single style for any aspect of museum design runs
percent.b a risk of reducing the satisfaction of significant
numbers of NMAH visitors. NMAH visitors appear
to be sufficiently aware of their preferences to select
exhibitions that may offer acceptable experiences—
because of content or significance—and to accept
* See Endnotes on page 16.
Page 2
Exhibition Layout Survey
Office of Policy and Analysis
Smithsonian Institution
June 2005design aspects that may not be their most desired.
While this survey did not pursue this matter, visitor There was greater diversity in expressed opinions
preferences could include variety in the size of towards the new design for the public space near
exhibitions. PoF than regarding the exhibition layout or the
exhibition entrance. Visitors were equally split
While majorities of PoF visitors rated all aspects of between preferring a public space with displays and
the exhibition layout and design favorably, substantial the cleaner, emptier space. More first-time NMAH
numbers of visitors found the layout confusing so visitors indicated that they preferred the new public
that they were not always sure where they were space design for all NMAH hallways than repeat
and were uncertain whether they missed something visitors. Repeat NMAH visitors may have come
important. Visitors who used the guides and maps at to associate cluttered hallways with Smithsonian
the beginning of exhibition sections felt significantly museums or they may like diversity in public space
better oriented in PoF. PoF appears to have sufficient design.
places to sit and rest to satisfy most visitors—unlike
most exhibitions. Likewise, most visitors were not As is documented in the survey of visitors exiting
eager for additional exits so that they could leave the NMAH, there were no statistically significant
exhibition earlier. demographic group differences between PoF visitors
and overall NMAH visitors. On the other hand,
The exhibition design—a closed entrance international visitors were significantly less happy—
with a theatrical, multimedia presentation was and more likely to leave before seeing the entire
overwhelmingly well received by PoF visitors, exhibition—than American visitors. Considering the
even those who normally prefer an open exhibition relative share of international visitors and the size of
entrance where they can visually see much of what the survey samples, it was not possible to determine if
an exhibition offers. The entrance to The Price of international visitors tended to allocate their visit time
Freedom is a success. to exhibitions other than PoF.
Page 3
Exhibition Layout Survey
Office of Policy and Analysis
Smithsonian Institution
June 2005Figure 1
Visitor Reaction to PoF as an Exhibition
How would you describe your experience in this
exhibition today? PoF was a very successful exhibition with satis-
faction widespread across visitors. Visitors who
saw the entire exhibition were significantly more
satisfied with PoF than those who left earlier.
In particular, PoF appears a stronger attraction
for Americans than for international visitors.
While the focus of this study was layout design and
wayfinding, questionnaire pretesting showed that visi-
tors expected to rate the exhibition overall. A number
of visitors said that they used a question rating exhibi-
tion layout as an opportunity to express their overall
exhibition rating. As a result, the final questionnaire
25% Superior included one question to give respondents an opportu-
53% Excellent nity to express their overall reaction before answering
20% Good questions regarding layout, entrance, or the public
2% Fair space (Figure 1).
0% Poor
Overall, PoF visitors were pleased with their exhibi-
tion experience. One-quarter (25%) rated their experi-
ence in the exhibition as “superior”, while more than
half (53%) rated it “excellent.”c
Page 4
Exhibition Layout Survey
Office of Policy and Analysis
Smithsonian Institution
June 2005rior” and 20 percent “poor” to “good”. Visitors who
Figure 2
Quality of Experience by Seeing the Entire came specifically to see the exhibition were signifi-
Exhibition cantly happier (33% “superior”) than other visitors
(20% “superior”).
60 55
49 Exiting PoF visitors were asked whether they had
50
seen the entire exhibition. Nearly three-quarters
40
32
(73%) of the respondents saw the entire exhibition
Percent
30 27 (Appendix B: Table 2). PoF visitors who exited
20 18
20 without seeing the entire exhibition were significantly
less satisfied with the exhibition than those who saw
10
the entire exhibition. As Figure 2 illustrates, visitors
0
who exited PoF without seeing the entire exhibition
Superior Excellent Good
Saw all of PoF Did not see all of PoF are dramatically less satisfied—32 percent rated
their experience as poor, fair, or good—than those
While the percent of visitors who said that they found visitors who saw the entire exhibition (Appendix B:
their experience in PoF “superior” was roughly equal Table 3). Although, older visitors were more likely to
across age groups, the percent who said that their exit before finishing the exhibition, the relationship
experience was “poor,” “fair,” or “good” was higher between exiting early and satisfaction was only
among younger visitors than older visitors—9% significant for Generation Y visitors (27 and younger).
for visitors over 59 and 29% among Generations X
(28-38) and Y (27 and younger) visitors. Likewise, The Price of Freedom exhibition appears to hold
international visitors rated the exhibition significantly the attention of American visitors more since
lower—14 percent “superior” and 60 percent “poor” international visitors were significantly more likely
to “fair”—than American visitors—25 percent “supe- to leave without seeing the entire exhibition (47% of
Page 5
Exhibition Layout Survey
Office of Policy and Analysis
Smithsonian Institution
June 2005international visitors left early compared with 26% of PREFERENCES OF MUSEUM VISITORS
American visitors). Visitors who said that PoF was
a particular reason for coming to NMAH were more A majority of PoF visitors prefer entrances
likely to see the entire exhibition (78%) than other with a teaser about the content of an exhibition
visitors (69%). Notice, however, that nearly a quarter (closed entrances), and a majority also plan
of PoF destination visitors left without seeing the their time and visit in a museum. Nevertheless,
entire exhibition. The most significant predictor of large minorities expressed the opposite prefer-
leaving before seeing all of the exhibition was age— ences—for open entrances and not planning
37% of visitors older than 59 years old compared their time.
with 22% of persons between 28 and 50, and 32% of
younger than 28). NMAH decided to explore a new entrance design
for The Price of Freedom exhibition compared with
The Price of Freedom used kiosk-like structures previous exhibitions. Traditionally, NMAH exhibition
at the beginning of each of the major sections to entrances have fallen into one of two general catego-
reinforce section breaks, introduce the content of the ries: closed or open.
sections, and place the section in the framework of a
tactile map of the exhibition (Appendix B: Table 4). As a visitor approaches an open entrance at an exhibi-
These guide and map kiosks enhanced the exhibition tion such as On Time, much of the content of the exhi-
experience of visitors by a ratio of 4 to 1—ratio of bition is visible. In a sense, the open entrance reduces
enhanced to did not enhance—among the one-third possible concerns about how large and time consum-
of visitors who reported using them. Another three ing the exhibition is and what types of artifacts it con-
out of eight PoF visitors noticed or looked at the tains. Closed entrances—as used at NMAH for First
guides, although those visitors claimed to not have Ladies and Engines of Change—pose a “teaser” with
needed to use them—for these visitors the guides may an artifact or graphic panel ostensibly depicting the
have been partially successful by reinforcing section exhibition’s content, however, a possible visitor faces
divisions. Less than one out of three visitors claimed
Page 6
to not have seen the guides.
Exhibition Layout Survey
Office of Policy and Analysis
Smithsonian Institution
June 2005uncertainty about the potential layout, presentation,
Figure 3 and content beyond the entrance. While PoF adopted
Preference for exhibition entrances a closed entrance, it is a more theatrical presentation
than other closed entrances in the museum.
The question is: how do NMAH visitors vary in their
preferences for closed entrances—adventurous—or
open entrances—cautious?
Three out of five PoF visitors expressed a preference
for a closed exhibition entrance (60%) (Figure 3).
Women were significantly more likely to prefer open
entrances (45%) compared with men (35%). Like-
wise, the oldest visitors—over 59—were more likely
to prefer open entrances (56%) compared to younger
visitors (38%). Visitors with a physical impairment
60% A teaser outside, but most not visible that limits their ability to walk, climb, or lift objects
40% Most visible from outside were more likely to prefer closed entrances (63%)
than visitors without such impairments (38%). Unac-
companied visitors were significantly more likely to
prefer closed entrances (75%). Since this question
was only asked of exiting PoF visitors, it is not pos-
sible to determine the correlation between entrance
preferences and choosing whether to see an exhibition
or not, however, visitors who express a preference for
Page 7
Exhibition Layout Survey
Office of Policy and Analysis
Smithsonian Institution
June 2005open entrances, such as women, visit First Ladies—a LAYOUT AND DESIGN OF POF
closed entrance—more often than some visitors who
prefer closed entrances. The layout and design of PoF were successful.
Visitors expressed relatively high levels of
A majority of visitors said that they try to plan their satisfaction with the exhibition design and
visit to a museum and the amount of time that they layout, although some felt that the winding
will spend either sometimes (41%) or usually (26%). layout was complicated and confusing. Visitor
Only one-third rarely plan their museum visits (Ap- orientation aides such as guides and maps at
pendix B: Table 6). Age was a significant correlate of the beginning of exhibition sections worked to
visit planning behavior—the only statistically signifi- orient visitors who used them—or were aware
cant correlate among the demographic variables. Visi- of the guides.
tors 60 and over were much more likely to identify
themselves as “planners” (42% usually) than “wan- Visitors were more critical of the exhibition’s layout
derers” (22% rarely). On the other hand, younger and design than of their overall experience, which
visitors are more likely to be “wanderers” (35% rarely was based on the exhibition’s content as well as
compared with 23% usually). The frequency of plan- design. Less than one-sixth of PoF visitors rated the
ning is lowest for Generation Y visitors where only overall design as “superior” (15%) while nearly half
19% said that they usually plan their visits. rated it “excellent” (48%) (Figure 4). Again, visitors
who exited early were more critical of the layout
(46% rated it “poor,” “fair,” or “good”) than those
who saw the entire exhibition (34% “poor,” “fair,” or
“good”).
Exiting PoF visitors could agree or disagree with
seven aspectsd of the exhibition’s design (Appendix
Page 8
Exhibition Layout Survey
Office of Policy and Analysis
Smithsonian Institution
June 2005Figure 4
B: Table 8):
How Would You R ate the Layout and Design of
• The exhibition has enough entrances/exits
This Exhibition? (70% favorable and 11% unfavorable);
• Information panels are not too far away
or small to read (69% favorable and 11%
unfavorable);
• It is clear where the sections began and ended
(64% favorable and 15% unfavorable);
• There are enough places to sit and rest (60%
favorable and 19% unfavorable);
• I feel that I did not miss something important
(57% favorable and 20% unfavorable);
• The layout is not complicated nor confusing
(55% favorable and 18% unfavorable); and
• I always knew where I was (52% favorable
15% Superior
and 25% unfavorable).
48% Excellent
33% Good
4% Fair
More than half of all respondents had favorable
1% Poor reactions to each of the seven design aspects;
however, the lowest scores were all associated with
wayfinding in the exhibition.
Roughly one in five to one visitors indicated that they
felt confused or lost, and one in four that they had
missed something important in the exhibition.
Page 9
Exhibition Layout Survey
Office of Policy and Analysis
Smithsonian Institution
June 2005The mean number of favorable responses to the two-thirds of PoF visitors (63%) who felt that the
statements was 4.1 (with a median of four favorable layout was confusing either did not see the guides
responses). Favorable responses were correlated with or failed to look at them (Appendix B: Table 9).
the overall rating of the exhibition layout and design Conversely, nearly the same portion of the visitors
so that, on average, a “good” rating for the exhibition (59%) who felt that the layout was not confusing at
layout was associated with 3.4 favorable marks, while least looked at the guides.
“excellent” was associated with 4.6 and “superior”
with 5.1 favorable marks. Similarly, less than half (46%) of visitors who did not
look at the guides said that they always knew where
The three most significant predictors of satisfaction they were in the exhibition (Appendix B: Table 10).
with the exhibition layout were: The percentage of visitors who did not feel lost was
1. Disagreeing that the layout was complicated significantly higher among visitors who at least
and confusing, looked at the guides (58%).
2. Disagreeing that information panels were too
far away or small to read, and Older visitors and persons with disabilities were
3. Agreeing that there were enough places to sit more likely to want more seating. A substantial
and rest. minority of older visitors felt that seating was not
adequate (34%), even though more than half of the
Having enough exits/entrances had no effect of visitor older age cohort felt that there was enough seating
satisfaction. (53%), while the remaining expressed no opinion.
Visitors with disabilities were the most likely to feel
The perception that the layout was complicated and that the seating was inadequate (42%).
confusing was significantly associated with whether
a visitor at least looked at the guides and maps at the Visitors who left PoF before seeing the whole
beginning of each section of the exhibition. Nearly exhibition were less likely to feel that they saw
Page 10
Exhibition Layout Survey
Office of Policy and Analysis
Smithsonian Institution
June 2005everything important (46%) than visitors who saw EXHIBITION ENTRANCE
the entire exhibition (62%). Age was correlated with
visitors feeling that they knew where they were at all The design of the entrance to PoF was a success
times. Older visitors (38%) were twice as likely to be from the perspective of attracting visitors to the
confused or lost as Generation Y visitors (19%). exhibition and showing them where to enter the
exhibition.
Men (76%) were more likely to say that PoF has
enough exits/entrance than women (64%). Exiting visitors also provided an overall rating of
the entrance to PoF, shown below, and evaluated
the impact of three aspects of the entrance design.
One in six visitors considered the overall design
of the entrance to be “superior” (17%), lower than
the ratings for the overall exhibition experience,
but comparable to their rating of layout and design
(Figure 5). Two fifths of PoF visitors had an
unfavorable reaction to the entrance (40% “good,”
Page 11
Exhibition Layout Survey
Office of Policy and Analysis
Smithsonian Institution
June 2005“fair,” or “poor”).
Overall rating of the entrance is, however, positively
Younger visitors (27 and under) were more likely to associated with the number of “agree” responses to
be more favorable (26% “Superior” compared with the three entrance statements. Visitors who rated the
17% for all visitors). Likewise, visitors without any entrance “superior” agreed with an average of 2.8
physical disability gave significantly more favorable statements compared with 2.6 and 2.2 for visitors who
ratings to the PoF entrance (18% “superior” and 40% said “excellent” or “poor” to “good” respectively.
“good,” “fair,” or “poor”) than visitors reporting a
disability (7% “superior” and 63% “good,” “fair,” or The most significant predictor of the entrance
“poor”), although there were few disabled visitors. satisfaction rating was agreeing that “it invites me in”
followed by feeling that “it gives a good idea of what
Visitors could evaluate the entrance further by the exhibit is about.”
agreeing or disagreeing with three statementse about
the entrance (Appendix B: Table 12):
1. Gives a good idea of what the exhibit is about
(88% agree).
2. Shows where to enter (84% agree)
3. Invites me in (81% agree).
Almost universally, PoF visitors agreed with each
of the statements about its entrance. In fact, two-
thirds of the exiting visitors (66%) agreed with all
three statements. As a result, it is difficult to extract
significant differences between demographic groups
in their reactions to the three entrance descriptions.
Page 12
Exhibition Layout Survey
Office of Policy and Analysis
Smithsonian Institution
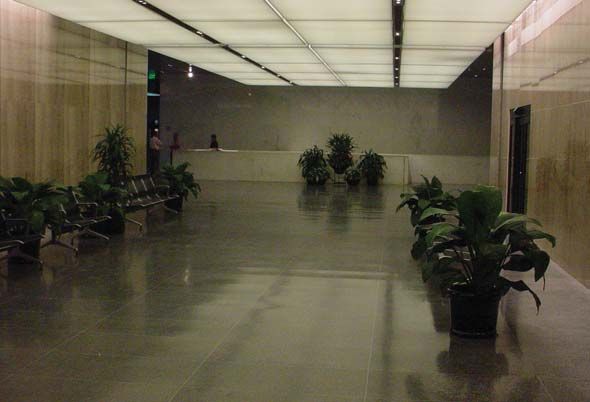
June 2005THE PUBLIC SPACE BETWEEN TAP AND POF
PoF visitors were divided in their opinions
regarding the new design of the public space
connecting TAP and PoF. While, a majority
felt that the space worked for them, there were
strong feelings that the new design should not be
universally applied to all NMAH public spaces.
Nearly half (47%) of the visitors rated the newly
installed marble lined public space (shown to the left)
that extends from between TAP and PoF on the west
to the escalator on the east as either “good” or “fair” were assigned a “public space score” based on
(Appendix B: Table 13). One out of eight rated the the number of favorable responses they gave to
marble space “superior” (12%). the three statements. Favorable responses to the
first two statements were defined as “agree,” whle
Again, visitors could register their agreement or “disagree” was defined as favorable for the third
disagreement with three statements about the public statement—“displays are needed in the corridor.”f The
space (Appendix B: Table 14): average number of favorable responses—the public
1. Good place to rest (54% agree) space score—was 1.2 and nearly a third (30%) gave
2. All hallways in the museum should look like no favorable responses. Only one out of ten (9%)
this (35% agree). gave favorable responses to all three statements.
3. Displays needed in the corridor (30% There is a strong association between a visitor’s
disagree) overall rating for the hallway and their “public space
As with layout design and the entrance, visitors score.” Visitors who rated the space “superior”
Page 13
Exhibition Layout Survey
Office of Policy and Analysis
Smithsonian Institution
June 2005marked a mean of 1.7 favorable responses to the half of repeat Smithsonian visitors (53%) rated the
three statements. Those who gave “excellent” ratings space as “good” or poorer compared to two-fifths of
marked an average of 1.3 favorable responses, while first-time visitors (39%).
0.9 were marked by those who rated the public space
either “fair” or “good.” Older visitors (59 and over) were twice as likely to
disagree (22%) that the public space is a good place
The most significant predictor of a visitor’s overall to rest as visitors under 27 years old (11%). Persons
rating of the public space was their response to the making their first visit to NMAH found the space a
second statement—“All hallways in the museum better place to rest (60%) than repeat Smithsonian
should look like this.” The other two statements— visitors (45%). There was also significant
“good place to rest” and “displays needed in the disagreement between the youngest and oldest PoF
corridor”—also were significantly correlated with the visitors regarding whether more displays are needed
overall rating of the public space. in the new public space. Older visitors (59 and
over) were twice as opposed to more displays (47%
The ratings of the overall exhibition experience and disagree) in the space as the younger visitors (23%
the public space were significantly associated with disagree for 27 and younger). More first-time NMAH
each other. One-third (35%) of respondents who visitors agreed that “all museum hallways should
rated their exhibition experience “superior” also rated look like this” (40%) compared with repeat visitors
the space “superior” compared with five percent of (27%). Repeat visitors to NMAH may prefer diversity
those who rated their experience “poor” to “good.” in the design of public space or they may expect
Conversely, one-quarter (24%) and three-quarters cluttered hallways in Smithsonian museums. The
(76%) rated the public space “fair” or “good.” current survey does not address whether preferences
or expectations were more important to visitors.
Generation Y visitors were twice as likely to rate the
space “superior” (20%) as older visitors (9%). Over
Page 14
Exhibition Layout Survey
Office of Policy and Analysis
Smithsonian Institution
June 2005DEMOGRAPHIC CHARACTERISTICS OF tuted 14 percent of PoF visitors (Appendix B: Table
THE PRICE OF FREEDOM VISITORS 20). The vast majority of visitors resided in the United
States, although they were widely distributed across
Demographically, PoF visitors are typical the country (Appendix B: Table 21).
NMAH spring 2005 visitors. Consider-
ing that more than half of NMAH visitors Adults constituted most of the PoF visitor popula-
made a visit to PoF, this is not surprising.g tion—with other adults but no children (42%), with
children (29%), alone (17%), or with an organized
Two-out-of-five PoF visitors were making their first group (7%) (Appendix B: Table 22). Slightly more
visit to the Smithsonian and, by extension, to NMAH. than half of the visitors were men (53%), statistically
Another one-sixth were first-time visitors to NMAH indistinguishable from the overall NMAH population
although they had visited other Smithsonian museums (Appendix B: Table 23).
before the day they answered the survey (see Appen-
dix B: Table 15). Relatively few visitors reported having vision, hear-
ing, or physical impairments (7%), identical with the
Nearly two-fifths (38%) said that they came specifi- overall NMAH population (Appendix B: Table 24).
cally to see PoF.h One-third of the visitors indicated
that they planned to visit NMAH exclusively (34%), The PoF questionnaire also asked visitors if they had
while the rest were visiting other Smithsonian muse- ever served in a military unit. One-fifth (20%) indi-
ums on the survey day (Appendix B: Table 19). cated military service (Appendix B: Table 25). This
service was significantly associated with gender—
Generation Y visitors—under 27 years old—form men were four times as likely to have served (31%) as
the largest group of visitors (28%) and are twice as women (7%)—and age—visitors older than 50 were
numerous as either Generation X visitors (28 to 38) more than twice as likely to have served (33%) as
or senior citizens (59 and over), both of which consti- those under 50 (13%).
Page 15
Exhibition Layout Survey
Office of Policy and Analysis
Smithsonian Institution
June 2005Endnotes Flag—and rated higher than recent art museum
exhibitions.
a PoF has two exits. One is in the Civil War d The statements were written as alternating
section, approximately half way through positive and negative statements. The ratings of
the exhibition. The other is at the end of the the few respondents who marked either agree or
exhibition after visitors pass the Medals of Valor disagree for each item were deleted from the data
exhibit. Because of the winding path through set.
PoF, both exits access the same short hallway e These three items all had the same polarity, that
within a few feet of each other. Visitors were is, visitors expressed a favorable reaction to the
intercepted as they left the short hallway. Some entrance items by agreeing with a statement.
visitors—observed as a small, but undetermined Providing the same answer to each item may or
percentage—exit through the exhibition entrance. may not represent response bias.
Based on observations, visitors exiting through f Visitors who gave identical responses to all three
the entrance were less common than in an statements were deleted from the analysis of these
exhibition such as America on the Move. Such three statements.
visitors were not intercepted. g OP&A conducted a related survey of 273 visitors
b The survey data were weighted to control biases exiting NMAH during the same time as the PoF
due to visitors on more and less crowded days and survey, the Spring 2005 NMAH Exit Survey
visitors who choose not to participate as well as (Spring Exit). This survey was used to compare
those who cooperated. Thus, the results presented the demographic characteristics of PoF visitors
in this report are statistically representative of with the general NMAH population.
NMAH visitors to PoF during the spring of 2005. h The percentage who claimed to have come to
If every visitor exiting PoF were interviewed, NMAH specifically to visit PoF is higher than
there is a 95 percent probability that percentages the percent answering a somewhat comparable
for the entire population will be within five question on the Spring 2005 survey, “Was there
percent of the survey percentage (given the something in particular that you wanted to see or
sample size). do in this museum today?” While 63% indicated
c Comparisons with other major exhibitions are that they wanted to see or do something in
presented in the Spring 2005 exit survey report. particular, only 15% made the extra effort to write
PoF was one of the two highest rated exhibitions in PoF as that thing.
in NMAH—the other being Preserving the
Page 16
Exhibition Layout Survey
Office of Policy and Analysis
Smithsonian Institution
June 2005Appendix A
Survey Questionnaire
Page 17
Exhibition Layout Survey
Office of Policy and Analysis
Smithsonian Institution
June 2005Appendix B
Tables of Survey Responses
Table 1 Table 4
Rating of Experience in The Price of Freedom Did you use the maps and guides at the start of each section?
Rating Percent (%) Response Percent (%)
Superior 25 Used and enhanced visit 27
Excellent 53 Used but did not enhance visit 7
Good 20 Looked at but did not use 20
Fair 2 Noticed, did not look at 17
Poor 0 Did not see 29
Total 100 Total 100
Percent of respondents answering 96 Percent of respondents answering 96
Table 5
Table 2 What is your preference for exhibition entrances?
Did You See the Entire Exhibition?
Exhibition entrance preference Percent (%)
Saw all of PoF Percent (%) A teaser outside but most inside not visible 60
Yes 73 Almost everything visible from the outside 40
No 27
Total 100
Total 100
Percent of respondents answering 87
Percent of respondents answering 95
Table 6
Do you carefully plan your visit and time in a museum?
Table 3
Quality of Experience and Seeing Entire Exhibition Plan museum visits Percent (%)
Usually 26
Superior Excellent Good* Total Sometimes 41
Amount seen (%) (%) (%) (%) Rarely 33
Saw all of PoF 27 55 18 100
Did not see all of PoF 20 49 32 101 Total 100
* Good includes poor and fair ratings Percent of respondents answering 96 Page 18
Exhibition Layout Survey
Office of Policy and Analysis
Smithsonian Institution
June 2005Table 7 Table 9
Overall Rating of The Price of Freedom’s Layout and Design Association Between Perception that
Exhibition Layout is Confusing and
Percent Looking at Section Guides
Rating (%)
Superior 15 Layout is complicated Disagree Neither Agree
Excellent 48 and confusing (%) (%) (%)
Good 33 Looked at or used 59 55 37
Fair 4 section guides
Poor 1 Did not see or look 41 45 63
at guides and maps
Total 101
Total 100 100 100
Percent of respondents answering 94
Table 10
Table 8 Association Between Looking at Section Guides
Ratings of Aspects of Exhibition Layout and Design and Visitors’ Perceptions that
They Always Knew Where They Were
Favorable Neither Unfavorable Total
Rating (%) (%) (%) (%) Looked at or Did not see or
Enough entrances / exits* 70 18 11 99 Layout was complicated used guides look at guides
Information panels were and confusing (%) (%)
far away or small to read** 69 21 11 101 Agree 20 29
Clear where sections began Neither 22 25
and ended* 64 21 15 100 Disagree 58 46
Enough places to sit and rest* 60 21 19 100
I may have missed Total 100 100
something important** 57 22 20 99
Layout complicated
and confusing** 55 28 18 101
Always knew where I was* 52 23 25 100
* Favorable is defined as agreeing with statement.
** Favorable is defined as disagreeing with statement.
Page 19
Exhibition Layout Survey
Office of Policy and Analysis
Smithsonian Institution
June 2005Table 11 Table 14
Overall Rating of The Price of Freedom’s Entrance Ratings the Marble Hallway
Rating Percent (%) Favorable Neither Unfavorable Total
Superior 17 Rating (%) (%) (%) (%)
Excellent 42 Good place to rest* 54 31 15 100
Good 36 All hallways in the museum 35 52 13 100
Fair 3 should look like this*
Poor 1 Displays needed in
the corridor** 30 32 37 100
Total 99
* Favorable is defined as agreeing with statement.
Percent of respondents answering 94 ** Favorable is defined as disagreeing with statement.
Table 12 Table 15
Ratings the Exhibition Entrance Distribution of PoF Visitors by First-time or Repeat Visit
Favorable Neither Unfavorable Total Type of visit Percent (%)
Rating (%) (%) (%) (%) First Smithsonian visit 40
Invites me in * 81 16 3 100 Repeat Smithsonian, first NMAH visit 17
Shows where to enter * 84 10 6 100 Repeat visit to NMAH
Gives a good idea of what and Smithsonian 44
the exhibit is about * 88 9 4 100
Total 100
* Favorable is defined as agreeing with statement.
Percent of respondents answering 93
Table 13
Overall Rating of Marble Hallway in Front of Price of Freedom
Rating Percent (%)
Superior 12
Excellent 41
Good 43
Fair 4
Poor 0
Total 100
Percent of respondents answering 91 Page 20
Exhibition Layout Survey
Office of Policy and Analysis
Smithsonian Institution
June 2005Table 16 Table 19
Distribution of Price of Freedom Visitors by First-time or Type of Visit: Specifically to See PoF
Repeat NMAH Visit and Visiting NMAH Only and General Smithsonian or NMAH Visit
Type of visit Percent (%) Type of Visit Percent (%)
Repeat NMAH visit & general SI visit 28 PoF destination visit and NMAH only 15
First SI visit & general SI visit 28 PoF destination in general SI visit 23
Repeat NMAH visit & NMAH only 15 General NMAH visit 19
First SI visit & NMAH only 12 General SI visit 44
First NMAH visit & general SI visit 10
First NMAH visit & NMAH only 7 Total 101
Total 100 Percent of respondents answering 92
Percent of respondents answering 94
Table 20
Distribution of Price of Freedom Visitors by Age
Table 17
Did you come specifically to see Price of Freedom? Age Percent (%)
59 and older 14
Specifically to see PoF Percent (%) 50 to 58 17
Yes 38 39 to 49 28
No 62 28 to 38 14
27 and younger 28
Total 100
Total 101
Percent of respondents answering 96
Percent of respondents answering 96
Table 18
Type of Visit: General Smithsonian Visit or NMAH Visit Only
Type of Visit Percent (%)
General SI visit 66
Only visiting NMAH 34
Total 100
Percent of respondents answering 94 Page 21
Exhibition Layout Survey
Office of Policy and Analysis
Smithsonian Institution
June 2005Table 21 Table 23
Distribution of Price of Freedom Visitors by Residence Distribution of Price of Freedom Visitors by Gender
Residence Percent (%) Gender Percent (%)
Metro Washington 8 Female 47
Southeast 17 Male 53
Mid Atlantic 15
Midwest 14 Total 100
New England 12
Mountain Plains 8 Percent of respondents answering 96
West 18
Country other than U.S. 8
Table 24
Total 100 Distribution of Price of Freedom Visitors by Disability
Percent of respondents answering 90 Disability Percent (%)
Physical impairment 5
Deafness or hearing impairment 2
Table 22 Blindness or severe vision condition 1
Distribution of Price of Freedom Visitors by No physical, sight or hearing impairment 93
Composition of Visit Group
Total 101
Visit Group Percent (%)
Group of adults 42 Percent of respondents answering 85
Unaccompanied adult 17
Adults with youth 15
One adult with youth 14 Table 25
Adult with organized group 7 Distribution of Price of Freedom Visitors
Youth with organized group 4 by Military Service
Group of youth 1
Unaccompanied youth 1 Served in military unit Percent (%)
Yes 20
Total 101 No 80
Percent of respondents answering 93 Total 100
Percent of respondents answering 96
Page 22
Exhibition Layout Survey
Office of Policy and Analysis
Smithsonian Institution
June 2005You can also read